• Aucun résultat trouvé

Performance and energy efficiency of big data applications in cloud environments: A Hadoop case study

N/A
N/A
Protected

Academic year: 2021

Partager "Performance and energy efficiency of big data applications in cloud environments: A Hadoop case study"

Copied!
26
0
0

Texte intégral

(1)

HAL Id: hal-01271141

https://hal.archives-ouvertes.fr/hal-01271141

Submitted on 11 Feb 2016

HAL is a multi-disciplinary open access archive for the deposit and dissemination of sci-entific research documents, whether they are pub-lished or not. The documents may come from teaching and research institutions in France or

L’archive ouverte pluridisciplinaire HAL, est destinée au dépôt et à la diffusion de documents scientifiques de niveau recherche, publiés ou non, émanant des établissements d’enseignement et de recherche français ou étrangers, des laboratoires

Performance and energy efficiency of big data

applications in cloud environments: A Hadoop case

study

Eugen Feller, Lavanya Ramakrishnan, Christine Morin

To cite this version:

Eugen Feller, Lavanya Ramakrishnan, Christine Morin. Performance and energy efficiency of big data applications in cloud environments: A Hadoop case study. Journal of Parallel and Distributed Computing, Elsevier, 2015, 79-80, pp.80-89. �10.1016/j.jpdc.2015.01.001�. �hal-01271141�

(2)

Performance and Energy Efficiency of Big Data

Applications in Cloud Environments: A Hadoop Case

Study

Eugen Feller, Lavanya Ramakrishnan, Christine Morin

To cite this version:

Eugen Feller, Lavanya Ramakrishnan, Christine Morin. Performance and Energy Efficiency of Big Data Applications in Cloud Environments: A Hadoop Case Study. Journal of Parallel and Distributed Computing, Elsevier, 2015, 79-80, pp.80-89. <hal-01102203>

HAL Id: hal-01102203

https://hal.inria.fr/hal-01102203

Submitted on 15 Jan 2016

HAL is a multi-disciplinary open access archive for the deposit and dissemination of sci-entific research documents, whether they are pub-lished or not. The documents may come from teaching and research institutions in France or abroad, or from public or private research centers.

L’archive ouverte pluridisciplinaire HAL, est destin´ee au d´epˆot et `a la diffusion de documents scientifiques de niveau recherche, publi´es ou non, ´emanant des ´etablissements d’enseignement et de recherche fran¸cais ou ´etrangers, des laboratoires publics ou priv´es.

(3)

Performance and Energy Efficiency of Big Data

Applications in Cloud Environments: A Hadoop Case

Study

Eugen Fellera,b, Lavanya Ramakrishnana, Christine Morina,b

aLawrence Berkeley National Laboratory

1 Cyclotron Road, Berkeley, CA 94720, USA

bInria Centre Rennes - Bretagne Atlantique

Campus universitaire de Beaulieu, 35042 Rennes Cedex, France

Abstract

The exponential growth of scientific and business data has resulted in the evolution of the cloud computing environments and the MapReduce parallel programming model. The focus of cloud computing is increased utilization and power savings through consolidation while MapReduce enables large scale data analysis. Hadoop, an open source implementation of MapReduce has gained popularity in the last few years. In this paper, we evaluate Hadoop performance in both the traditional model of collocated data and compute services as well as consider the impact of separating out the services. The separation of data and compute services provides more flexibility in envi-ronments where data locality might not have a considerable impact such as virtualized environments and clusters with advanced networks. In this paper, we also conduct an energy efficiency evaluation of Hadoop on physical and virtual clusters in different configurations. Our extensive evaluation shows that: (1) coexisting virtual machines on servers decrease the disk throughput; (2) performance on physical clusters is significantly better than on virtual clusters; (3) performance degradation due to separation of the services de-pends on the data to compute ratio; (4) application completion progress correlates with the power consumption and power consumption is heavily application specific. Finally, we present a discussion on the implications of using cloud environments for big data analyses.

Email addresses: efeller@lbl.gov (Eugen Feller), lramakrishnan@lbl.gov (Lavanya Ramakrishnan), christine.morin@inria.fr (Christine Morin)

(4)

Keywords: Cloud Computing, Hadoop MapReduce, Performance, Energy Efficiency, Virtualization

1. Introduction

In recent times, the amount of data generated by scientific as well as busi-ness applications has experienced an exponential growth. For instance, the Large Hadron Collider (LHC) is expected to generate dozens of petabytes of data [1] per year. Similarly, Facebook is already processing over 500 terabytes of new data daily [2].

Cloud computing environments and MapReduce [3] have evolved sepa-rately to address the need to process large data sets. Cloud computing en-vironments leverage virtualization to increase utilization and decrease power consumption through virtual machine (VM) consolidation. The key idea of MapReduce is to divide the data into fixed-size chunks which are processed in parallel. Several open-source MapReduce frameworks have been devel-oped in the last years with the most popular one being Hadoop [4]. While Hadoop has been initially designed to operate on physical clusters, with the advent of cloud computing it is now also deployed across virtual clusters (e.g., Amazon Elastic MapReduce [5]). The flexibility and on-demand nature of cloud environments show promise for the use of clouds for big data analyses. However, previous work has also identified the network and I/O overheads in virtualized environments which can be a major hurdle for use of clouds for big data applications [6].

Thus, the performance and power implications of running big data anal-yses, especially in the context of Hadoop, in cloud environments are still not well investigated. In this paper we have two goals. First, given the increas-ing importance of Hadoop, we study the performance and energy footprint of Hadoop in virtualized environments. Second, we address the larger open question regarding the suitability, opportunities, challenges and gaps of run-ning big data analyses in cloud environments.

We explore two Hadoop deployment models on both physical and virtual clusters to understand their performance and power implications. Our work considers cloud environments to encompass bare-metal and virtualized en-vironments. First, we use the traditional model of Hadoop where data and compute services are collocated. Second, we consider an alternative Hadoop deployment model that involves separating the data and compute services.

(5)

These two deployment models allow us to study the performance and energy profiles of the compute and data components of the system.

First, we investigate how coexisting VMs impact the disk throughput. We then consider the effects of the deployment models on the application performance (i.e., execution time). Several works (e.g., [7, 8]) have investi-gated the design of energy saving mechanisms for Hadoop. However, only one work [9] has studied the power consumption of Hadoop applications with a focus on physical clusters, the traditional Hadoop deployment model, and compute-intensive applications. Understanding the application performance profile and power consumption is a fundamental step towards devising energy saving mechanisms. Therefore, we also study the power consumption issue since data centers enabling scalable data analysis now require a tremendous amount of energy.

Our study is conducted in realistic conditions on power-metered servers of the Grid’5000 experimentation testbed [10]. Specifically, we address the following five key topics:

• We investigate the impact of VM coexistence on the disk throughput. • We study the performance of Hadoop with collocated and separated

data and compute services on physical and virtual clusters.

• We study the energy consumption of Hadoop applications when exe-cuted on physical and virtual clusters with collocated and separated data and compute services.

• We analyze the power consumption profiles of compute and data-intensive Hadoop applications.

• We discuss the implications of using cloud environments for big data analyses.

The remainder of this paper is organized as follows. We give an overview of our work in Section 2. We describe the methodology in Section 3 and present the results in Section 4. We discuss the implications of using cloud environments for big data analyses in Section 5. In Section 6, we discuss the related work. Finally, conclusions are presented in Section 7.

(6)

TaskTracker B B B B B M R M M R M DataNode R JobTracker NameNode Ma pR edu ce layer HDF S layer Master Slaves M Map task Reduce task Data block

(a) Traditional model: Collocated data and compute TaskTracker M R M M R M JobTracker NameNode MapReduce layer HDFS layer Ma st er

Data slaves Compute slaves B B

B B DataNode

(b) Alternate model: Separated data and compute

Figure 1: Hadoop deployments models. Master and slaves can be either servers or VMs.

2. Overview

Figure 1 provides a high-level overview of the two deployment models we consider in this paper. The two models are: 1) traditional Hadoop model in which data and compute services are collocated (Figure 1a) and 2) alternate model in which data and compute services are separated (Figure 1b). In this section, we discuss these two models in greater detail.

2.1. Traditional Model: Collocated Data and Compute

Figure 1(a) shows the traditional deployment of Hadoop where the data and compute services are collocated on each slave machine. A slave machine can be either a server or VM.

Hadoop provides a compute layer through the MapReduce framework (top layer in Figure 1) and a data layer through the Hadoop Distributed File System (HDFS) (bottom layer in Figure 1). The JobTracker accepts user requests to start MapReduce jobs and manages the jobs execution based on available map/reduce capacity. In the event of a TaskTracker failure, failed tasks are restarted on the remaining TaskTrackers by the JobTracker. The HDFS layer is used to store the input and output data. The system con-sists of a NameNode system service to manage metadata and one or multiple DataNode system services that holds the data blocks. One of the key prop-erties of Hadoop is its ability to exploit the effects of data locality. Data locality enables one to perform map computations where the data within the Hadoop cluster resides thus minimizing the costs of input data movements to

(7)

the map tasks. Consequently, in the traditional Hadoop deployment model, TaskTracker and DataNode system services are collocated on each slave ma-chine. It is possible to run HDFS atop other file system including high performance file systems such as (GPFS, Lustre). However, it is usually not recommended since the locality properties are lost when there are centralized storage servers.

2.2. Alternate Model: Separated Data and Compute

Cloud environments assume that machines are transient i.e., VMs are booted up when an application needs to be executed and shut down when the application is done running. However, this impacts how storage data is managed in these virtual clusters. The Amazon Web Services model provides multiple storage services (e.g., EBS, S3) for storing data. The Hadoop/HDFS model inherently assumes availability of persistent storage on the compute node, to provide data locality. This is in conflict with the flexible model of virtual environments. Hadoop applications running in cloud environments have used ad-hoc approaches to bridge this gap. In this paper, we study an alternate deployment model that separates the compute and data layers. This allows us to study the range of performance and power in Hadoop envi-ronment and provides a strong foundation for building tools that are aware of the virtual machine topology and use it for intelligent data placement.

Figure 1(b) is an alternate deployment model we study in the paper. In this alternate model, the data (i.e., DataNode) and compute (i.e., Task-Tracker) services are run on separate dedicated sets of nodes. However, the performance impacts of such a deployment model are still not well under-stood. In this work we focus on HDFS and thus target the execution of DataNode system services on the data slaves. However, in principle any distributed file system (e.g., Ceph [11], GlusterFS [12]) can be used.

The separation of data and compute services provides flexibility that is a key characteristic of virtualized cloud environments. Previous work has shown that coallocating these layers cause difficulties with elastic MapRe-duce and VM live migration and/or reuse of existing large shared storage infrastructures in traditional clusters [13].

2.3. Effects of Hadoop Deployment Models

Hadoop has been traditionally deployed on static clusters where Hadoop has complete control over the resources. Hadoop has not been designed to run on VMs. Thus, Hadoop assumes that the data nodes and compute

(8)

nodes coexist and do not have the notion of on-demand. Hadoop has little or no support natively to handle elasticity, an important characteristic of cloud environments. Previous work [14] has looked at elasticity in clouds specifically focused on coexisting data and compute nodes. There is still a limited understanding of the effects of running Hadoop in virtual environ-ments with separated data and compute nodes. As we explore, Hadoop on other platforms including cloud environments it is important to understand the implications of such a change.

Dynamic VM addition and removal is an important characteristic of cloud environments allowing automated scale-up/down of virtualized Hadoop clus-ters at runtime. However, adding or removing VMs participating in HDFS is an expensive operation due to the involved time (i.e., data needs to be moved into HDFS and does not already exist there) and space (i.e., CPU, memory, network) overheads. For example, when a slave is removed, for fault tolerance reasons, data blocks which it used to host need to be replicated to another slave. Depending on the number of slaves and data size, a removal operation can take a very long time and result in a significant amount of net-work traffic. Similarly, when new slaves are added, often data blocks needs to be moved to the slaves thus incurring additional network traffic.

2.4. Energy Efficiency

Processing large amounts of data requires huge compute and storage in-frastructures, which consume substantial amounts of energy. One common approach to save energy is to perform Dynamic Voltage and Frequency Scal-ing (DVFS), which involves slowScal-ing down the CPU. However, arbitrary slow-ing down the CPU can yield significant performance degradation [15] espe-cially during compute-bound application phases. It is therefore essential to understand the power consumption of Hadoop applications and their corre-lation with the application progress. Understanding the power consumption is the first step towards the design of effective energy saving mechanisms ex-ploiting DVFS and other power management techniques (e.g., core on/off).

3. Methodology

In this section, we present our evaluation methodology. Our methodology focuses on evaluating the different Hadoop deployment models both from a performance and power perspective. We focus on the following two specific topics: (1) performance and energy trade-offs of Hadoop deployment models

(9)

on both physical and virtual clusters; (2) investigation of Hadoop applications power consumption.

3.1. Workloads

To evaluate the performance and energy efficiency of Hadoop applications in different Hadoop deployment scenarios we use three micro-benchmarks: TeraGen, TeraSort, and Wikipedia data processing [16]. The former two benchmarks are among the most widely used standard Hadoop benchmarks. TeraGen is typically used to generate large amounts of data blocks. This is achieved by running multiple concurrent map tasks. Consequently, TeraGen is a write intensive I/O benchmark. The data generated by TeraGen is then sorted by the TeraSort benchmark. The TeraSort benchmark is CPU bound during the map phase and I/O bound during the reduce phase.

The Wikipedia data processing application is used to represent common operations of data-intensive scientific applications, which involve filtering, reordering, and merging of data. The filter operation takes a large amount of data as input and outputs a subset of the data and is thus read intensive during the map phase. In the current implementation, the filter operation searches for a first title tag in the input data of each map task and writes the content of the title tag back to disk. The reorder operation performs manip-ulations on a data set which result in a similar amount of reads and writes in the map and reduce phases respectively. In the current implementation, reorder searches for a timestamp tag and replaces it with another string of the same length in the entire map input. The merge operation involves ma-nipulations on the data set such that more data is written back to disk than was read. In the current implementation of the merge operation, a string is appended by each map task to its input. The string length is chosen such that the amount of data written back is approximately twice the input size. 3.2. Platform Setup

To conduct the experiments we have used 33 HP Proliant DL165 G7 servers of the parapluie cluster which is part of the Grid’5000 experimentation testbed [10]. The servers are equipped with two AMD Opteron 6164 HE 1.7 GHz CPUs (12 cores per CPU), 48 GB of RAM, and 250 GB of disk space. This results in a total capacity of 768 cores, 48 GB of RAM, and 250 GB of disk space. The servers are interconnected using Gigabit Ethernet. They are powered by six power-metered APC AP7921 Power Distribution Units (PDUs). Each server is running the Debian Squeeze operating system with

(10)

Kernel-based Virtual Machine (KVM) enabled. In the virtualized cluster configuration, the Snooze [17] cloud stack is used to manage the parapluie servers. Snooze system management services are deployed on three dedicated Sun Fire X2270 servers of the parapide cluster. Table 1 summarizes our platform setup.

Each VM has 4 virtual cores (VCORES), 8 GB of RAM, and 45 GB of disk space. This is similar to Amazon’s EC2 large instance configuration. This configuration allowed us to accommodate 161 VMs. In our experiments, the Snooze round-robin VM placement algorithm has assigned the first six VMs on the first server and the remaining 155 ones, 5 per server. This way 4 spare physical cores were left on all the parapluie servers except the first one which was fully utilized. Finally, an external NFS server with 2 TB storage

Table 1: Platform setup summary

parapluie cluster parapide cluster Number of servers 33 3

Server configuration 2 x AMD Opteron 6164 HE 1.7 GHz CPUs (each with 12 cores), 48 GB RAM, 250 GB disk space 2 x Intel Xeon X5570 2.93 GHz CPUs (each with 4 cores), 24 GB RAM, 500 GB disk space

Network interconnect Gigabit Ethernet Gigabit Ethernet Operating system Debian Squeeze Debian Squeeze VM configuration 4 VCORES, 8 GB

RAM, 45 GB disk space

-is used to host data sets for the Wikipedia data processing application. The NFS server is interconnected using Gigabit Ethernet to the parapluie cluster. 3.3. Power Measurement and Hadoop Setups

We use the parapluie cluster in all experiments. The power measurements are done from the first parapide server in order to avoid influencing the experiment results through measurements. The total power consumption of the parapluie cluster is computed by aggregating the power values of the six PDUs every two seconds. In all experiments Hadoop 0.20.2 is deployed on the servers and VMs using our scalable deployment scripts. It is configured

(11)

with 128 MB block size, 128 KB I/O buffer size. We select a replication level of one for the our experiments. Higher replication factors were attempted in our experiments. However, higher replication levels on VMs result in a large number of errors due to replication overheads and Hadoop reaches an unrecoverable state (discussed further in Section 5). The JobTracker and the NameNode system services are running on the first server (or VM). Note, that tuning the Hadoop parameters is known to be a non-trivial task. In this work, the Hadoop parameters were based on published literature and the resource constraints in our environment.

3.4. Experiment Scenarios

In order to provide a fair comparison of Hadoop performance across dif-ferent scenarios, we have configured Hadoop on servers and VMs to have the same map and reduce capacity. On servers, each TaskTracker is configured with 15 map and 5 reduce slots. On VMs, each TaskTracker is configured with 3 map and 1 reduce slots. The first server and VM act as the Job-Tracker. This results in a total of 480 map and 160 reduce slots for the remaining 32 servers and 160 VMs.

We run the TeraGen benchmark to generate 100, 200, 300, 400, and 500 GB of output data, respectively. The output data was then used to execute the TeraSort benchmark. To evaluate the Hadoop Wikipedia data processing application, we used 37, 74, 111, and 218 GB of input data, respectively. The input data was placed on the external NFS server and moved to HDFS for each experiment. We use only a subset of the Wikipedia data which is over 6 TB due to the large amount of time required to transfer data from NFS to HDFS and the server time restrictions on the Grid’5000 testbed. For all applications, 1000 map and 500 reduce tasks are used.

In the experiments with separated data and compute services on a phys-ical cluster (Section 2.2) we deploy Hadoop with the following data-compute server ratios: 8-8, 16-8, 16-16, 8-16, and 8-24. Thus when we refer to the data-computer server ratio of 16-8, our setup has 16 data servers and 8 com-pute servers. Similarly, a data-comcom-pute server ration of 8-24 has 8 data servers and 24 compute servers. The ratios are selected such as to enable the performance and power evaluation of Hadoop with balanced and unbalanced data to compute servers. On virtual clusters, the following data-compute VM ratios are used: 30-30, 80-30, 130-30, 30-80, 80-80, and 30-130. Note that in all ratios, total power of 33 servers is measured due to the lack of power-meters supporting per-outlet measurements. The results shown in this

(12)

paper are all from single runs of an experiment. We were limited due to the length of the experiments and the time restrictions on the Grid’5000 experi-mentation testbed. In order to study variation on the tested, we ran a sample of the data multiple times. The variation was not statistically significant.

3.5. Metrics

For our experiments, we have identified three key metrics of interest: ap-plication execution time, energy, and apap-plication progress correlation with power consumption. The first metric is especially important in order to understand the performance impact of different Hadoop deployments. The second metric enables us to compare the deployment models energy effi-ciency. Power consumption is estimated by computing the application’s av-erage power consumption. Note that given that avav-erage power consumption is near identical across all application runs, the energy metric also captures the execution time degradation.

4. Experiment Results

We now present our experiment results with collocated and separated data and compute services on physical and virtual clusters for the aforemen-tioned workloads. First, we analyze the impact of coexisting VM on the disk throughput. Then, we focus on: (1) application execution time; (2) energy consumption; (3) application power consumption profiles.

4.1. Impact of Coexisting VMs on Disk Throughput

In a cloud environment typically multiple VMs coexist on the servers to improve utilization. However, VM collocation creates interference between the VMs and results in bottlenecks on the shared subsystems (e.g., disk). To analyze the disk I/O overheads resulting through VM coexistence, we have run IOR benchmark [18] across one to five VMs all hosted on a single server and measured the resulting write/read throughput. VMs were configured with 4 VCORES and 4 GB of RAM. Each VM is using a QCOW2 disk image with a shared backing image. The IOR benchmark was configured with 5 GB block size, 2 MB transfer size, and MPI-IO. The number of clients was set to 4 × number of VMs. The results from this evaluation are shown in Figure 2. As it can be observed both the write and read throughput decreases with increasing number of VMs. Read throughput decreases faster due to concurrent read access on a single shared backing image. Note that the we

(13)

were unable to allocate 6 VMs/node with this hardware configuration. We select the configuration of 5 VMs/node for the rest of our experiments since achieving highest utilization is often a goal for most cloud providers.

0 10 20 30 40 50 60 70 80 1 2 4 5 Throughput (MB/sec) Number of VMs Write Read

Figure 2: IOR write and read throughput with multiple VMs sharing a single server. A significant throughput degradation can be observed.

4.2. Alternate Deployment: Energy

Figure 3 shows the energy used for filter, merge, and reorder operations with collocated and separated data and compute services on servers. As it can be observed, the collocated scenario results is the most energy efficient one due to data locality. The impact of separating the data and compute layers heavily depends on the right data to compute ratio choice. For instance, for the read intensive filter operation, it is beneficial to have more data than compute servers. Reorder and merge operations benefit from having more compute than data servers. Adding more compute servers did not yield significant improvements.

Figure 4 shows the energy consumption for filter, merge, and reorder with collocated and separated data and compute services on VMs. Collocation of data and compute layers achieves the best results on VMs as well. Filter operation performs better with an increasing number of data VMs until the I/O becomes the bottleneck at ratio 130-30. Reorder and merge operations benefit from having more compute VMs.

Our results suggest that separating data and compute layers is a viable approach. However, the resulting performance degradation heavily depends on the data to compute server/VM ratio for a particular application. In

(14)

0 0.1 0.2 0.3 0.4 0.5 8-8 16-8 16-16 8-16 8-24 collocation Energy (= Wh)

Wikibench on servers, filter

37GB 74GB 111GB (a) Filter 0 1 2 3 4 5 6 7 8 9 8-8 16-8 16-16 8-16 8-24 collocation Energy (= Wh)

Wikibench on servers, reorder

37GB 74GB 111GB (b) Reorder 0 1 2 3 4 5 6 7 8 9 8-8 16-8 16-16 8-16 8-24 collocation Energy (= Wh)

Wikibench on servers, merge

37GB 74GB 111GB

(c) Merge

Figure 3: Hadoop Wikipedia data processing energy for three data-intensive operations with separated data and compute services on servers. The filter operation benefits from more data nodes. Reorder and merge benefit from more compute nodes.

(15)

0 2 4 6 8 10 12 14 16 30-30 80-30 130-30 30-80 80-80 30-130 collocation Energy (= Wh) Wikibench on VMs, filter 37GB 74GB 111GB (a) Filter 0 2 4 6 8 10 12 14 16 30-30 80-30 130-30 30-80 80-80 30-130 collocation Energy (= Wh) Wikibench on VMs, reorder 37GB 74GB 111GB (b) Reorder 0 2 4 6 8 10 12 14 16 30-30 80-30 130-30 30-80 80-80 30-130 collocation Energy (= Wh) Wikibench on VMs, merge 37GB 74GB 111GB (c) Merge

Figure 4: Hadoop Wikipedia data processing energy for three data-intensive operations with separated data and compute services on VMs. Filter benefits from more data nodes until the I/O becomes the bottleneck at ratio 130-30. Reorder and merge benefit from having more compute nodes.

(16)

practice, the choice of such a ratio is a non-trivial task as it heavily depends on the application characteristics (e.g., I/O-boundness), amount of data to be processed, server characteristics, and the Hadoop parameters.

Note that the average power consumption resulting from changing the ratios experienced only a low variation for two reasons. First, the differ-ence between our server idle and peak power consumption is low (∼ 96 W). Second, the target application (i.e., Wikipedia data processing) for this eval-uation is data-intensive and thus not CPU-bound. CPU is the most power demanding component in our servers. Each time a ratio is changed, Hadoop is redeployed thus requiring Wikipedia data to be moved from NFS to HDFS. Consequently, conducting the experiments required a significant amount of time. For instance, on average over one hour was required to move 34 GB of data from NFS to HDFS on a virtual cluster in contrast to 11 minutes on a physical cluster.

4.3. Application Power Consumption Profiles

5 6 7 8 0 200 0 10 20 30 40 50 60 70 80 90 100 Power (= kW) Left percentage (= %) Time (= sec)

Teragen power consumption - Physical / 500 GB

Power consumption Map left percentage

(a) TeraGen 5 6 7 8 0 200 400 600 800 1000 0 10 20 30 40 50 60 70 80 90 100 Power (= kW) Left percentage (= %) Time (= sec)

Terasort power consumption - Physical / 500 GB

Shuffle start Shuffle end

Power consumption

Map left percentage Reduce left percentage

(b) TeraSort

Figure 5: TeraGen and TeraSort percentage of remaining map/reduce and power con-sumption with collocated data and compute layers on servers for 500 GB. Map and reduce completion correlates with decrease in power consumption.

Figure 5 shows the TeraGen and TeraSort completion progress in con-junction with the power consumption on servers with collocated compute and data layers for input size of 500 GB. Particularly, we plot the percentage of map and reduce remaining against the power consumption. The trends are similar for other data sizes. As it can be observed, the remaining percentage of maps and reduces correlate with the power consumption. Particularly,

(17)

when the map and reduce complete, the power consumption decreases thus indicating underutilized servers. Both TeraGen and TeraSort exhibit dif-ferent power consumption. TeraGen has a relatively long phase of a high steady power consumption between 100% and 40% maps remaining thus in-dicating high CPU utilization. TeraSort has a similar behavior in its map phase. However, the existence of a long shuffle and reduce phase yields a more fluctuating power consumption with tails and peaks.

The results show that in order to optimize the energy consumption, map and reduce capacity has to be selected carefully. For instance, a high map to reduce slots ratio (like in our case) creates a lot of idle time thus wasting energy.

Next, we present the Wikipedia data processing completion progress and power consumption on VMs for the 80 data and 30 compute VMs (see Fig-ure 6). The trend is similar for the collocated scenario and the other ratios of separated data and compute services. Similar power consumption pattern were obtained on servers. Similar to TeraGen and TeraSort, a correlation between the percentage of remaining of map/reduce and the power con-sumption exist. However, another important observation is that the power consumption profile of Wikipedia data processing is significantly different from TeraGen and TeraSort. Particularly, power consumption is steady in the map phase, and more smooth in the reduce phase. A significant drop in power consumption can be observed during the shuffle phase thus making the shuffling phase a good candidate to apply power management mechanisms. These results show that power consumption profiles are heavily application specific.

4.4. Summary

The key findings of our study are:

1. Locality plays a key role in virtualized environments. The collocate data and compute configuration presented the best energy profile. 2. Coexisting VMs negatively impact the disk throughput and thus the

application performance.

3. Hadoop on VMs yields significant performance degradation with in-creasing data scales for both compute and data intensive applications. For instance, TeraSort at 500 GB is 2.7 × faster on servers than on VMs. The overheads are higher because of the high utilization on the node from higher number of VMs/node. Earlier studies reported

(18)

5 6 7 8 0 100 200 300 400 500 600 0 10 20 30 40 50 60 70 80 90 100 Power (= kW) Left percentage (= %) Time (= sec) Wikibench 80-30 filter - VMs / 111 GB

Shuffle start Shuffle end

Power consumption Map left percentage

Reduce left percentage

(a) Filter 5 6 7 8 0 400 800 1200 1600 2000 2400 2800 3200 0 10 20 30 40 50 60 70 80 90 100 Power (= kW) Left percentage (= %) Time (= sec) Wikibench 80-30 reorder - VMs / 111 GB

Shuffle start Shuffle end

Power consumption

Map left percentage Reduce left percentage

(b) Reorder 5 6 7 8 0 400 800 1200 1600 2000 2400 2800 3200 3600 4000 0 10 20 30 40 50 60 70 80 90 100 Power (= kW) Left percentage (= %) Time (= sec) Wikibench 80-30 merge - VMs / 111 GB

Shuffle start Shuffle end

Power consumption

Map left percentage Reduce left percentage

(c) Merge

Figure 6: Remaining percentage of map/reduce and power consumption for Hadoop Wikipedia data processing with 80 data and 30 compute VMs. Power consumption drops as the map and reduce complete.

(19)

smaller percentage overheads when a single VM was configured per server.

4. Separation of data and compute layers increases the energy consump-tion. The degree of the increase depends on the application, data size, and the data to compute ratio. For instance, reorder energy consump-tion with collocated data and compute layers on VMs with 111 GB data is 3.6 × lower than at 130-30 and only 1.2 × lower than at 30-130. 5. Power consumption profiles are application specific and correlate with the map and reduce phases. Selecting the right number of map and reduce slots is crucial to minimize idle times.

5. Discussion

Hadoop and virtualization technologies have evolved separately. However, more recently Hadoop is increasingly run on virtual cloud environments in-cluding public clouds such as Amazon EC2. However, there is a question of what is the right configuration for running Hadoop in these modes. In this paper, we evaluate a number of deployment modes for Hadoop.

In this section, we discuss the current challenges and the practical find-ings from our study. Particularly we focus on: (1) performance and energy efficiency issues in virtualized environments. (2) energy management in big data management systems; (3) persistent data management; (4) elasticity in big data management systems; (5) challenges with experimentation testbeds and; (6)replication factor and failures.

Performance and energy efficiency issues in virtualized environ-ments. Over the past years virtualization has emerged as an ubiqutioius technology to increase server utilization. However, performance and virtual-ization overheads are still open issues in virtualized environments. Previous work has shown that there are I/O overheads in virtualized environments [19, 6]. Our experiments also show that disk I/O throughput drops as the number of VMs per server increases thus decreasing the application per-formance. For performance and energy efficiency reasons, physical clusters currently offer a better choice albeit at the possible cost of utilization. Some of the overheads in virtualization are expected to be alleviated with newer technologies. However, there are still a number of open challenges in trying to determine the performance and energy-efficient configuration of applications running in virtual environments.

(20)

Energy management in big data management system. Designing energy-efficient big data management systems is still an open issue and has been mostly only addressed from the theoretical side to date. Our study has two important implications for the design of the energy saving mechanisms. For data intensive applications such as Wikipedia data processing, energy saving mechanisms involving DVFS might yield energy savings. Our early results show some potential opportunities in the energy profiles. However, more detailed analysis will be required. In production environment clus-ters, energy saving mechanisms must be designed to carefully consider the inter-workload resource complementaries. This can be achieved by schedul-ing memory and CPU-bound map/reduce tasks together on the servers.

Persistent data management. Many of the scientific applications operate on data which initially resides on a shared file system (e.g., NFS). In order to process this data it needs to be moved to a Distributed File System (DFS) (e.g., HDFS). However, moving large amounts of data to a DFS can take a significant amount of time, especially than the data needs to be moved to VMs. For instance, 13 minutes were required to move 37 GB of data from NFS to HDFS deployed on physical servers and over one hour to HDFS de-ployed on VMs. We believe that the problem is two-fold: (1) limited support for tools enabling parallel data movement to HDFS; (2) lack of performance isolation with coexisting VMs. Our paper looks at two deployment models to try and understand the performance and power profiles of these systems. Services such as Amazon’s Elastic MapReduce recommend using persis-tent storage systems like S3 as part of user workflow. However, for a number of existing legacy applications that move to the cloud, this would require re-architecting their application’s data staging process. The focus of this paper was on legacy Hadoop applications that don’t need to be changed to run a virtual environment. In addition, moving the data from S3 to the virtual machine has data staging costs and bottlenecks associated with it. A variety of solutions are possible and persistent data management of large amounts of data in virtual environments requires more investigation.

Elasticity in big data management systems. The traditional Hadoop model with collocated data and compute layers has been commonly used to enable data locality in non-virtualized environments. With the advent of cloud computing, Hadoop is now increasingly used in virtualized envi-ronments. Virtualized environments enable elastic provisioning of storage and compute capacity. However, leveraging elasticity is still a challenging

(21)

task given that Hadoop has been not designed with elasticity in mind. For instance, dynamic addition and removal of data nodes results in data replica-tion and thus is expensive operareplica-tion. One solureplica-tion discussed in this document involves the separation of data and compute layers. Separation of data and compute layers is especially interesting as it enables to deploy a dedicated data cluster, while keeping the compute part elastic. This enables data shar-ing between multiple cloud users as well as on-demand compute capacity. Our experimental results have shown that a separation of data and compute layers is a viable approach but does have performance penalties. Performance degradation can be mitigated by carefully selecting the appropriate data to compute ratio. The right choice of such a ratio remains an open problem.

Challenges with experimentation testbeds. We have identified three key challenges with experimentation testbeds: (1) time restrictions; (2) pow-erful server hardware; (3) support for power measurements. Most of the testbeds including the one used in this study have time restrictions for the usage of resources. For instance, a cluster can be reserved only in the night or over a weekend. Given the data-intensive nature of the experiments per-formed those time restrictions are often not sufficient. Powerful server hard-ware is essential to perform experiments with many VMs and large amounts of data. However, typically only a few clusters are equipped with recent server hardware. Finally, power measurements require power metering hard-ware and softhard-ware to access the hardhard-ware. However, often server power metering hardware is either not available or inaccurate. Even when avail-able, it is often hard to access due to limited documentation and support for programmatic access. The power measurement limitations further narrow down the number of candidate servers to perform the experiments.

Replication Factor and Failures. As mentioned earlier, our experiments use a replication factor of 1. There were two reasons for this choice. First, higher replication factors cause an increase in network traffic resulting in a large number of failures that leaves the virtual machines unusable. Sec-ond, given the virtual environments are transient, the potential benefit from replication against the cost of replication is minimal.

(22)

6. Related Work

We discuss the related work in performance and energy efficiency of Hadoop.

Performance. Jeffrey Shafer et.al [20] have identified several performance issues with the HDFS. Our work complements this work by investigating the performance and energy consumption of Hadoop when executed with sepa-rated data (HDFS) and compute (MapReduce) services. In [21], the authors have proposed VMM-Bypass I/O to improve the performance of time-critical I/O operations. Hadoop performance in virtualized environments can benefit from such mechanisms. Previous work [22], has shown that VMs are suit-able for executing data intensive Hadoop applications through use of sort and wordcount benchmarks. The work by Jian et. al [23] shows that a proper MapReduce implementation can achieve a performance close to par-allel databases through experiments performed on Amazon EC2. Previous work [16] evaluated Hadoop for scientific applications and the trade-offs of various hardware and file system configurations.

It has been identified in previous work that virtualization overhead with one VM per server for Hadoop applications can range from 6% to 16% us-ing distributed grep, distributed sort and a synthetic application with 18.8 GB of data [24]. Our work complements the aforementioned performance efforts by investigating the Hadoop performance with separated data and compute layers and specific data operations. Moreover, it extends existing performance studies targeting collocated data and compute services in two ways. First, our evaluation is based on data sets of up to 500 GB. Second, we report results with multiple VM sharing the servers which is a common practice in cloud environments to increase utilization.

Energy efficiency. Leverich et. al. [7] propose Covering Subset (CS) data layout and load balancing policy. An alternative approach called All-In Strat-egy (AIS) [8] has been found to be a better choice. Previous work shows that DVFS can yield substantial energy savings in compute-intensive Hadoop ap-plication [9]. Berkeley Energy Efficient MapReduce (BEEMR) [25] proposes the processing of interactive jobs on a small subset of servers and transitions the remaining servers into a power saving state. Finally, GreenHadoop [26] considers the availability of green energy (i.e., solar) as well as the MapRe-duce jobs energy requirements when scheduling. Our study complements existing energy efficiency efforts by investigating the impacts of separating data and compute layers on the energy consumption. Moreover, it gives

(23)

insights in the power profiles of data intensive Hadoop applications.

7. Conclusions and Future Work

In this paper, we have investigated the performance and power impli-cations of running Hadoop in various deployment models. Particularly, our study has focused on the application execution time, the energy consumption, and application progress correlation with power consumption when running Hadoop on physical and virtual server and separating the data and compute services.

Evaluating the implications of separating data and compute services is especially important as Hadoop is now increasingly used in environments where data locality might not have a considerable impact such as virtualized environments and clusters with advanced networks. Our extensive evalua-tion shows that: (1) data locality is paramount for energy efficiency; (2) separating data compute services is feasible at the cost of increased energy consumption. The data to compute ratio must be carefully selected based on the application characteristics, available hardware, and the amount of data to be processed; (3) energy saving mechanisms must carefully consider the resource boundness and differences between the map and reduce tasks. We believe that our study provides valuable insights for running Hadoop in phys-ical and virtualized environments with separated data and compute services. Moreover, it can serve as a starting point to design effective energy saving mechanisms.

Our work is the first step towards understanding the performance and power characteristics of running applications in cloud environments. There is additional work needed in the space. First, while Hadoop is increasingly used in virtualized cloud environments, it is still unclear what the correct configuration must be. Second, we need to evaluate using multi-job workloads to understand the effect on elasticity.

8. Acknowledgments

This research was done in the context of the Inria DALHIS associate team, a collaboration between the Inria Myriads project-team and the LBNL’s Ad-vanced Computing for Science Department. This work was also supported by the Director, Office of Science, of the U.S. Department of Energy un-der Contract No. DE-AC02-05CH11231. The experiments presented in this

(24)

paper were carried out using the Grid’5000 testbed, being developed un-der the INRIA ALADDIN development action with support from CNRS, RENATER and several Universities as well as other funding bodies (see https://www.grid5000.fr).

References

[1] J. Ekanayake, S. Pallickara, G. Fox, Mapreduce for data intensive sci-entific analyses, in: Proceedings of the 2008 Fourth IEEE International Conference on eScience, ESCIENCE ’08, 2008, pp. 277–284.

[2] A. Menon, Big data @ facebook, in: Proceedings of the 2012 workshop on Management of big data systems, MBDS ’12, 2012, pp. 31–32. [3] J. Dean, S. Ghemawat, Mapreduce: simplified data processing on large

clusters, in: Proceedings of the 6th conference on Symposium on Opeart-ing Systems Design & Implementation - Volume 6, OSDI’04, 2004, pp. 10–10.

[4] The Apache Hadoop Framework, http://hadoop.apache.org (2013). [5] Amazon Elastic MapReduce, http://aws.amazon.com/

elasticmapreduce/ (2013).

[6] D. Ghoshal, R. S. Canon, L. Ramakrishnan, I/o performance of virtu-alized cloud environments, in: Proceedings of the second international workshop on Data intensive computing in the clouds, DataCloud-SC ’11, 2011, pp. 71–80.

[7] J. Leverich, C. Kozyrakis, On the energy (in)efficiency of hadoop clus-ters, SIGOPS Oper. Syst. Rev. 44 (1) (2010) 61–65.

[8] W. Lang, J. M. Patel, Energy management for mapreduce clusters, Proc. VLDB Endow. 3 (1-2) (2010) 129–139.

[9] T. Wirtz, R. Ge, Improving mapreduce energy efficiency for computation intensive workloads, in: Proceedings of the 2011 International Green Computing Conference and Workshops, IGCC ’11, 2011.

(25)

[10] R. Bolze, F. Cappello, E. Caron, M. Dayd´e, F. Desprez, E. Jeannot, Y. J´egou, S. Lanteri, J. Leduc, N. Melab, G. Mornet, R. Namyst, P. Primet, B. Quetier, O. Richard, E.-G. Talbi, I. Touche, Grid’5000: A large scale and highly reconfigurable experimental grid testbed, Int. J. High Perform. Comput. Appl. 20 (4) (2006) 481–494.

[11] S. Weil, S. A. Brandt, E. L. Miller, D. D. E. Long, C. Maltzahn, Ceph: A scalable, high-performance distributed file system, in: Proceedings of the 7th symposium on Operating systems design and implementation, OSDI ’06, 2006, pp. 307–320.

[12] The Gluster Filesystem, http://www.gluster.org (2013).

[13] R. McDougall, Towards an Elastic Elephant: En-abling Hadoop for the Cloud, http://cto.vmware.com/ towards-an-elastic-elephant-enabling-hadoop-for-the-cloud/ (2012).

[14] A. Iordache, C. Morin, N. Parlavantzas, E. Feller, P. Riteau, Re-silin: Elastic mapreduce over multiple clouds, Cluster Computing and the Grid, IEEE International Symposium on 0 (2013) 261–268. doi:http://doi.ieeecomputersociety.org/10.1109/CCGrid.2013.48.

[15] E. Le Sueur, G. Heiser, Dynamic voltage and frequency scaling: the laws of diminishing returns, in: Proceedings of the 2010 international conference on Power aware computing and systems, HotPower’10, 2010, pp. 1–8.

[16] Z. Fadika, M. Govindaraju, R. Canon, L. Ramakrishnan, Evaluat-ing hadoop for data-intensive scientific operations, in: ProceedEvaluat-ings of the 2012 IEEE Fifth International Conference on Cloud Computing, CLOUD ’12, 2012, pp. 67–74.

[17] E. Feller, L. Rilling, C. Morin, Snooze: A scalable and autonomic virtual machine management framework for private clouds, in: Proceedings of the 2012 12th IEEE/ACM International Symposium on Cluster, Cloud and Grid Computing, CCGRID ’12, 2012, pp. 482–489.

[18] IOR HPC Benchmark, http://sourceforge.net/projects/ior-sio/ (2013).

(26)

[19] K. Yelick, S. Coghlan, B. Draney, R. S. Canon, The Magellan Report on Cloud Computing for Science, Tech. rep., U.S. Department of En-ergy Office of Science Office of Advanced Scientific Computing Research (ASCR) (Dec. 2011).

[20] J. Shafer, S. Rixner, A. Cox, The hadoop distributed filesystem: Balanc-ing portability and performance, in: Performance Analysis of Systems Software (ISPASS), 2010 IEEE International Symposium on, 2010, pp. 122–133. doi:10.1109/ISPASS.2010.5452045.

[21] J. Liu, W. Huang, B. Abali, D. K. Panda, High performance VMM-bypass I/O in virtual machines, in: USENIX Annual Technical Confer-ence (ATC), USENIX Association, Berkeley, CA, USA, 2006, pp. 29–42. URL http://portal.acm.org/citation.cfm?id=1267359.1267362 [22] S. Ibrahim, H. Jin, L. Lu, L. Qi, S. Wu, X. Shi, Evaluating mapreduce

on virtual machines: The hadoop case, in: Proceedings of the 1st In-ternational Conference on Cloud Computing, CloudCom ’09, 2009, pp. 519–528.

[23] D. Jiang, B. C. Ooi, L. Shi, S. Wu, The performance of mapreduce: an in-depth study, Proc. VLDB Endow. 3 (1-2) (2010) 472–483.

[24] D. Moise, A. Carpen-Amarie, Mapreduce applications in the cloud: A cost evaluation of computation and storage, in: A. Hameurlain, F. Hus-sain, F. Morvan, A. Tjoa (Eds.), Data Management in Cloud, Grid and P2P Systems, Vol. 7450 of Lecture Notes in Computer Science, Springer Berlin Heidelberg, 2012, pp. 37–48.

[25] Y. Chen, S. Alspaugh, D. Borthakur, R. Katz, Energy efficiency for large-scale mapreduce workloads with significant interactive analysis, in: Proceedings of the 7th ACM european conference on Computer Systems, EuroSys ’12, 2012, pp. 43–56.

[26] I. n. Goiri, K. Le, T. D. Nguyen, J. Guitart, J. Torres, R. Bianchini, Greenhadoop: leveraging green energy in data-processing frameworks, in: Proceedings of the 7th ACM european conference on Computer Sys-tems, EuroSys ’12, 2012, pp. 57–70.

Figure

Figure 1: Hadoop deployments models. Master and slaves can be either servers or VMs.
Table 1: Platform setup summary
Figure 2: IOR write and read throughput with multiple VMs sharing a single server. A significant throughput degradation can be observed.
Figure 3: Hadoop Wikipedia data processing energy for three data-intensive operations with separated data and compute services on servers
+4

Références

Documents relatifs

Aucune d'entre elles ne doit être

On the one hand, by using semantic analysis the data can be connected and the system can realize data sharing with RDF based on semantic data queries.. On the other hand,

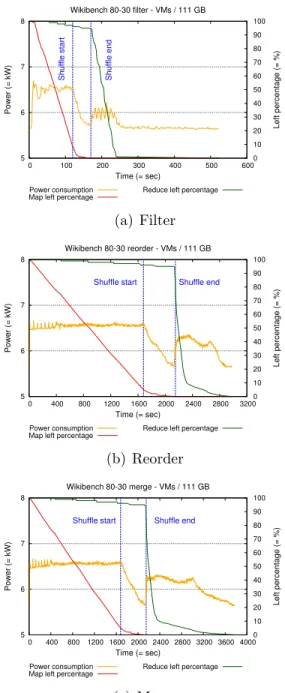
We compare the performance and the energy consumption of two technologies of virtualization (Docker containers and VMware) and bench- mark the software Hadoop (JoshBaer, 2015)

We come to the point that in most experiments the light technology offers better performances in completion time of workloads and it is more adapted to be used with the

Como su nombre lo dice, en esta etapa se crean diferentes grupos dentro de cada proceso y son ordenados para un manejo más sencillo y adecuado de los datos.. •

Hadoop installation delivers the following example MapReduce jar file, which provides basic functionality of MapReduce and can be used for calculating, like Pi value, word counts in

Ce sont des supports de cours mis à votre disposition pour vos études sous la licence Creative Commons Attribution - Pas d’Utilisation Commerciale - Partage dans les Mêmes

1) The prediction about Map task execution time: Figure 8 shows the the prediction about the Map task execution time for various sampling ratio K, K reflects the number of similar