HAL Id: hal-00921640
https://hal.inria.fr/hal-00921640
Submitted on 24 Mar 2014
HAL is a multi-disciplinary open access
archive for the deposit and dissemination of
sci-entific research documents, whether they are
pub-lished or not. The documents may come from
teaching and research institutions in France or
abroad, or from public or private research centers.
L’archive ouverte pluridisciplinaire HAL, est
destinée au dépôt et à la diffusion de documents
scientifiques de niveau recherche, publiés ou non,
émanant des établissements d’enseignement et de
recherche français ou étrangers, des laboratoires
publics ou privés.
Fusion of statistical and structural information for
flowchart recognition
Cérès Carton, Aurélie Lemaitre, Bertrand Couasnon
To cite this version:
Cérès Carton, Aurélie Lemaitre, Bertrand Couasnon. Fusion of statistical and structural information
for flowchart recognition. ICDAR - International Conference on Document Analysis and Recognition,
2013, Washington, United States. pp.1242-1246. �hal-00921640�
Fusion of statistical and structural information
for flowchart recognition
C´er`es Carton
IRISA - INSA
Universit´e Europ´eenne de Bretagne Campus de Beaulieu 35042 Rennes Cedex, France
Aur´elie Lemaitre
IRISA - Universit´e Rennes 2 Universit´e Europ´eenne de Bretagne
Campus de Beaulieu 35042 Rennes Cedex, France
Bertrand Co¨uasnon
IRISA - INSA
Universit´e Europ´eenne de Bretagne Campus de Beaulieu 35042 Rennes Cedex, France
Abstract—A critical step of on-line handwritten diagram recognition is the segmentation between text and symbols. It is still an open problem in several approaches of the literature. However, for a human operator, text/symbol segmentation is an easy task and does not even need understanding diagram semantics. It is done thanks to the use of both structural knowledge and statistical analysis. A human operator knows what is a symbol and how to distinguish a good symbol from a bad one in a list of candidates. We propose to reproduce this perceptive mechanism by introducing some statistical information inside of a grammatical method for document structure recognition, in order to combine both structural an statistical knowledge. This approach is applied to flowchart recognition on a freely available database. The results demonstrate the interest of combining statistical and structural information for perceptive vision in diagram recognition.
I. INTRODUCTION
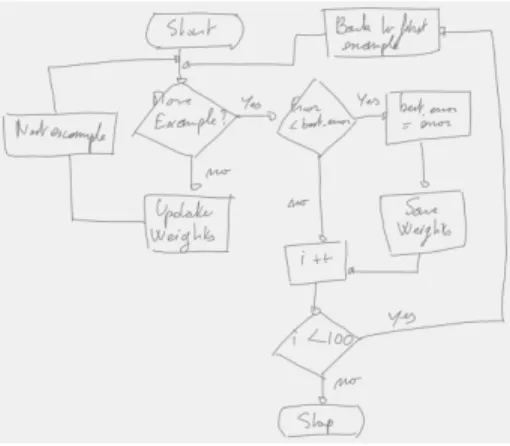
Diagram recognition has for main objective the semantic analysis of its content. We focus here on online document analysis. It is translated by labeling each stroke and grouping strokes depending on the symbol they belong to. Nowadays in diagram recognition, a human operator still outclasses automatic methods. However, this task has been studied in the literature and several methods have been proposed. In figure 1, we can see an example of flowchart, which is a type of diagram. From a human point of view, flowcharts are an example of ”pop-out“ effect. Boxes are salient elements that our attention will focus on first. Then, from these salient elements, we will enlarge our field of vision. Our interpretation and recognition of a diagram will be guided by boxes. We do not need to know that a diamond represents a decision in a flowchart to localize three diamond boxes in this flowchart. Nevertheless, box detection is a major problem in diagram recognition, through segmentation of text and symbols.
Many approaches of the literature tend to constraint writers to decrease the difficulty of text-symbol segmentation. Thus, Qi et al. [1] and Feng et al. [2] impose flowcharts to be com-posed only of symbols, without any text. Tilak [3] relaxes this constraint by authorizing text. However, in this approach, the user has to explicitly choose a kind of writing. Yuan et al. [4] also authorize text and symbol, but they impose the symbols to be mono-stroke. Miyao et al. [5] avoid the drawback of text-symbol segmentation. In their approach, user can add a text to a graphic symbol by using another input window. Moreover,
Fig. 1. Example of handwritten flowchart
the symbols also have to be mono-stroke. By delegating the text-symbol segmentation to the user through this constraint, the results on diagram recognition are significantly improved. This shows that nowadays, we are able to correctly label the found symbols, but the text-symbol segmentation is a major problem to solve in order to improve results.
Concerning flowchart recognition, the existing methods are generally based on statistical approaches. Thus, Qi et al. [1] use Conditional Random Fields for sketch recognition. Yuan et al. [4] use a hybrid SVM-HMM. Awal et al. [6] use a method based on entropy for text-symbol segmentation and TDNN or SVM for symbol recognition. These authors conclude that the introduction of structural knowledge in a statistical approach could improve the recognition. One syntactical approach was proposed by Lemaitre et al. [7] with good results: 91.1% of strokes were correctly labeled.
More generally, in document structure analysis, two main approaches exist: the statistical ones and the syntactical ones. Statistical methods lack the ability to convey the hierarchical structure of a document. Syntactic methods suffer from a lack of flexibility. A more flexible parsing mechanism is possible but it is also more costly due to the increase of the search space. However, a human operator does not choose between a statistical or a structural approach. Quite the opposite, he mixes both approaches to improve results. Though, on diagram recognition, he knows what a box is, i.e. he uses a box structural description. He also knows how to recognize a
good box from a bad one in a list of candidates, i.e. he uses a statistical information. In this paper, we propose to use both statistical and structural approaches to reproduce this perceptive mechanism.
Some attempts to mix both statistical and structural infor-mation were made. Some authors proposed to use stochastic grammars. However, these approaches are limited to 1D-grammars. This limits the combinatorial explosion of solu-tions but prevents generalization to less structured documents. Maroneze et al. [8] introduced statistical information in a bidimensional syntactic analyzer by defining an operator that allows optional activation of the stochastic parsing mechanism. The interest of this approach was shown using uncertainty obtained from a handwritten word recognizer. In this paper, we propose to use the same mechanism, but the novelty is to introduce some statistical information that comes from a score directly defined and so understandable by the user.
In this paper, we propose a way to fuse statistical and struc-tural information for perceptive vision to improve the results of diagram recognition and particularly the segmentation. Thus, we present a perceptive approach for box detection in section II. Then, we will present in section III our experiments on a freely available database and demonstrate that the fusion of statistical and structural information increases recognition rates, by comparison with statistical or structural methods.
II. PERCEPTIVE APPROACH FOR BOX DETECTION
Boxes are salient elements of diagrams. You don’t need to understand the diagram semantic to be able to find where the boxes are. To introduce a perceptive mechanism in diagram recognition, the first step will be to find all the boxes, without trying to find the meaning of these boxes. We first present the different box shapes we want to recognize. Then, we give a structural description of a box and we describe statistical information used to define a good box. Finally, we show the originality of our work which consists in the introduction of statistical information in a grammatical description.
A. Box structural description
Fig. 2. Existing boxes on diagrams
Here, we are going to present our box structural description without any diagram context. The figure 2 presents some examples of boxes that can be found in diagrams. Boxes can be grouped into two main classes according to their shapes: circular shapes and quadrilaterals. On a pen-based interface, to give to the user an experience as close as possible to the paper one, no hypothesis is made on boxes in our approach, except that each stroke belongs to only one symbol. The user can draw them in any order in a symbol or even begin a symbol and finish it after drawing other symbols, whereas in [5] the user has to draw strokes which belong to a symbol in
succession. The symbols do not need to be mono-stroke and text and symbols have the same input mode.
Our box structural description is made in the context of DMOS (Description and Modification of the Segmentation) method [9], an existing grammar-based method for structural document recognition. With it, a quadrilateral can simply be described as: quadrilateral Q ::= AT(wholePage) && oneEdge C1 && AT(edgeEnd C1) && oneEdge C2 && AT(edgeEnd C2) && oneEdge C3 && AT(edgeEnd C3) && oneEdge C4 && checkEdgesAreClose C1 C4.
AT is an operator of position, determining where analysis will be done in the 2D document. With this operator, we can express that a quadrilateral Q is a box which has four edges C1, C2, C3 and C4, the end of one edge beginning not too far from the end of another edge. We then check that the figure found can be a quadrilateral by checking if it is a convex set. A circular shape can be described as:
circular C ::= AT(wholePage) && sequenceOfStrokes.
A circular shape C is described as a sequence of strokes with the beginning of sequence not too far from the ending of sequence.
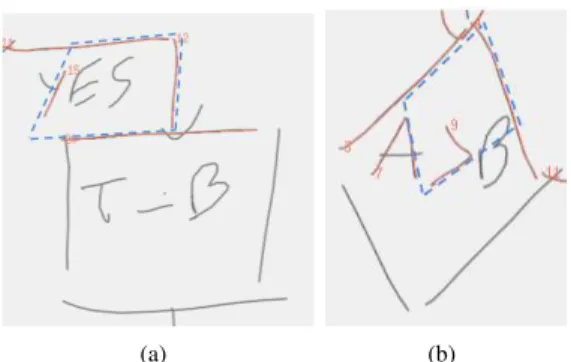
This grammatical description allows us to localize and extract numerous boxes in diagrams but with grammatical description, the first box found is recorded. However, as it can be seen in figure 3, cases may happen where a human operator would not have chosen the first one discovered in the analysis but another one, which is a ”better“ box. We then need to determine what is a good box.
B. Statistical information
(a) (b)
Fig. 3. A simple application of grammatical rules leads to false box detection due to vertices estimation
Now we want to reproduce the human’s capacity to distin-guish what is a good box. In figure 3, we can see examples of boxes recognized by the structural description presented in II-A, represented with dashed edges. Without any context,
a human can say that these boxes were not the right ones to choose. We need to give to our method the ability to reproduce this choice, that is to be able to describe a good box.
To construct boxes, we use line segments extracted through polygonal approximation. The finally built boxes use the whole strokes, with no segmentation. Furthermore, we tolerate in our analysis the strokes that are longer or shorter than the expected edges to deal with handwritings. Figure 3 shows two examples where strokes inside and outside a quadrilateral were used to construct a box. A human operator would not have chosen these quadrilaterals as boxes because they differ too much from initial strokes. We desire here to have a measure able to quantify this deformation:
def ormation(Q) =
P
edge∈Q| estimated length − real length |
perimeter of Q
By dividing by perimeter of Q, we obtain a relative measure and we are able to compare the scores of different quadri-laterals. The difference between the estimated and the real quadrilateral is not made globally but edge by edge. It permits to avoid a compensation phenomenon between extension and shrinkage of edges. The score can be anywhere between 0 and +∞. A score of 0.3 means that there is a difference of 30% between the estimated quadrilateral and the real one (make longer or shorter a stroke has the same cost). For each quadrilateral, a measure can now be associated, assessing its similarity with initial strokes. Through this measure we are now able to compare quadrilaterals between them.
In the diagram presented in figure 3(a), two different boxes can be found using the structural description of a box. These two boxes are presented in 4. The estimated edges are represented by dash lines whereas the real edges are represented by plain lines. Finally, with our deformation score, the box 1 obtains a score of 0.45, the box 2 obtains a score of 0.14. On this example, we can see that a threshold on how close edges must be could not solve vertices estimation problem. The distance between edges 1 and 2 of Box 1 is identical as the distance between edges 4 and 1 of Box 2. However, in the context of Box 2 this distance is acceptable whereas it is not in the context of Box 1. The deformation score correctly reflects our intuitive idea on what is a good box. We now want to introduce this information in our grammatical description, to be able to choose the best box and not the first found box.
(a) Box 1 - deformation = 0.45 (b) Box 2 - deformation = 0.14 Fig. 4. Example of potential boxes of figure 3(a)
C. Fusion of statistical and structural information
To be able to choose the best option available, we decided to introduce this statistical information in our syntactic ap-proach. It is done using the FIND_BEST_FIRST operator introduced by Maroneze [8]. When dealing with multiple choices, we want the analysis to apply the best result as possible. “Best result” is defined using a preference criterion that allows ranking possibilities. In [8], Maroneze used the uncertainty from handwritten word recognizer as a score. Here, we use the intuitive and user-defined score presented in section II-B, based on structural information on boxes. The best quadrilateral is the quadrilateral that has fewer differences with the initial strokes drawn. We will then choose first the quadrilateral with the lowest deformation score.
The introduction of the proposed deformation score in our grammatical rule is easy. We just need to insert the score at the end of our rule. The new grammatical description of a quadrilateral is: quadrilateral Q ::= AT(wholePage) && oneEdge C1 && AT(edgeEnd C1) && oneEdge C2 && AT (edgeEnd C2) && oneEdge C3 && AT (edgeEnd C3) && oneEdge C4 && checkEdgesAreClose C1 C4 && addScore Q.
To compare the different candidate quadrilaterals, we need to insert the FIND_BEST_FIRST operator in our analysis. This operator can be introduced at different levels of the analysis. The level of insertion of FIND_BEST_FIRST is linked to the combinatory since the stochastic analysis is performed on the limited subset of parsing tree defined by the insertion point. If it is introduced at a high level, the solutions space will be too important. To avoid a combinatorial explosion, FIND_BEST_FIRST is inserted after we have found a potential quadrilateral Qp. We then check if we cannot
find a better one composed of at least one of the edges of Qp. If
we can find a better quadrilateral, in the sense exposed below, then this quadrilateral is selected and saved. Thus, we propose to find a quadrilateral: bestQuadrilateral ::= AT(wholePage) && firstQuadrilateral Qp && AT(aroundQuadrilateral Qp) && FIND_BEST_FIRST(quadrilateral Q) && saveSymbol Q.
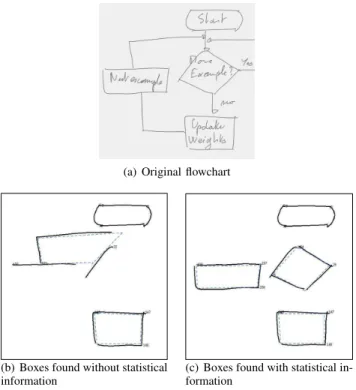
The found boxes are now locally the best choices to do. Figure 5 presents comparative results. Without statistical information, an arrow was used to build a quadrilateral and the two real boxes were not found (diamond and rectangle). With statistical information, this quadrilateral is still found, but its score is higher than the one of the other boxes. Boxes are then selected.
III. EXPERIMENTAL RESULTS
In order to evaluate our method, we have worked on the freely available database presented by Awal et al. in [6].
(a) Original flowchart
(b) Boxes found without statistical information
(c) Boxes found with statistical in-formation
Fig. 5. Example of introduction of statistical information on boxes detection
This database is made of online handwritten flowcharts, of various complexities, that have been written by 31 writers using the Anoto pen technology. A ground truth is provided for each flowchart, containing the label for each stroke and the segmentation of strokes into symbols. The table I summarizes the properties of the database.
TABLE I. PROPERTIES OF THE DATABASE
Writers Patterns Flowcharts Strokes Symbols Training set 31 14 248 23359 5541 Test set 15 14 other 171 15696 3792
First, we use the training set to demonstrate the interest of a perceptive mechanism for box detection. We also compare the box detection with and without integrating statistical informa-tion to assess the score we defined on boxes. Then, we assess the use of the perceptive mechanism in diagram recognition by evaluating results on flowchart recognition. Our method is compared to both structural and statistical methods. We use the metric furnished with the database defined as follow: a symbol is recognized if all the strokes of this symbol are joined to the segmentation, no other stroke is joined to the segmentation and the symbol is correctly labeled.
A. Box perceptive recognition
We show the interest of using a perceptive mechanism by integrating statistical information in a structural approach. In this purpose, we first compare the results obtained with box grammatical description presented in II-A and the results ob-tained from the fusion of statistical information and structural knowledge on box description presented in II-C.
The main objective is to be able to find reliable quadrilat-erals. As they will lead diagram recognition we must be able to rely on them. In table II, we can see that without use of
statistical information, 17 strokes are labeled as quadrilateral whereas they should not. With statistical information, we have only 6 false positives i.e. a decrease of 65%. Moreover, the remaining false positives will have a low impact on diagram recognition as we will show in next section. They correspond to arrowhead strokes which are mislabeled as quadrilateral.
On the number of forgotten boxes, there is a light impact as it can be seen in table II. It is perfectly normal and due to how we integrate statistical information to avoid combinatory explosion. We first look for an area of interest using only box grammatical description. We then check if it was the best option available in this area or not. This explains why we slightly increase the number of found boxes with this method. Only four quadrilaterals are not found. They are presented in figure 6. As it can be seen, they do not respect our grammatical description. One box has only three edges, the three others do not respect the condition that each edge must begin ”not too far“ from another edge.
Fig. 6. The 4 forgotten quadrilaterals on the 909 quadrilaterals of the test set
TABLE II. INTRODUCTION OF STATISTICAL INFORMATION IMPROVES RESULTS ON QUADRILATERAL RECOGNITION
Global recognition False Forgotten Method rate on strokes positive boxes Box structural description 95.3% 17 10 Box stat. and struct. description 95.7% 6 4
In this section, we showed that the introduction of a per-ceptive mechanism allows a significant decrease of mislabeled strokes. We now have reliable boxes to use in a global diagram analysis.
B. Application to flowchart recognition of the improvement given by our perceptive method for box recognition
We now want to show the impact of our method in a dia-gram recognition process. We already saw in previous section that we are able to find boxes without knowing semantics of diagram. We now show that using these boxes, we are able to improve diagram recognition. We choose to use it on a particular type of diagrams, flowcharts.
Flowcharts are composed of circular shapes, quadrilaterals, arrows and text. The circular shape class contains terminators and connections (respectively oval and circles). The quadri-lateral class contains process, data and decision (respectively rectangle, parallelogram and diamond).
We have implemented a grammatical description of flowchart using boxes found with our method. We first rec-ognize circular shapes and quadrilaterals. Our main goal in
this step is to find all the boxes. If a box is not found, it cannot be found at diagram recognition step. Moreover, it will multiply errors during diagram recognition. After that, we try to label each type of boxes, to detect text and to recognize links between boxes. The results obtained with our method are compared to the results obtained with the global flowchart grammatical description presented in [7].
TABLE III. SYMBOLS RESULTS ON THE171FLOWCHARTS OF TEST SET
Class Correct stroke labeling Correct symbol segmentation and recognition Structural [7] Stat + struct Structural [7] Stat + struct Connection 80.0 80.3 81.4 82.4 Terminator 58.9 69.8 70.3 72.4 Data 84.7 84.3 80.4 80.5 Decision 84 90.9 66.5 80.6 Process 85.7 90.4 81.3 85.2 Arrow 79.6 83.8 68.9 70.2 Text 97.8 97.2 71.7 74.1 Total 91.1 92.4 72.4 75.0
The improvement on segmentation and recognition of quadrilaterals is extremely important with our method. With a global structural description of flowchart, we were able to correctly segment and recognize 76.8% of quadrilaterals, composed of data, decision and process symbols (704 quadri-laterals). With the introduction of a perceptive mechanism, we are now able to correctly segment and recognize 82.2% of quadrilaterals (747 quadrilaterals). We reduce by 21% the num-ber of not correctly segmented and recognized quadrilaterals. We obtain a good recognition rate, 92.4%, for the indi-vidual strokes. At symbol level, we can see that the results on process and decision are significantly improved with our method. It shows that the improvement of box segmentation as a strong impact on symbol recognition in flowcharts. At stroke level, the terminator results are also improved, as arrow results. The improvement of arrows results shows that the recognition of salient elements in a diagram improves the recognition of semantics elements.
TABLE IV. REDUCTION OF COMPUTATION TIME PER FLOWCHART
Training set Test set Structural [7] 5.04 s 3.40 s
Stat + struct 2.30 s 1.94 s
Moreover, the computation time is significantly reduced compared to a global syntactic method as it can be observed in table IV, contrary to what may be assumed with the introduc-tion of a statistical informaintroduc-tion through FIND_BEST_FIRST. The combinatory is controlled through the insertion point of FIND_BEST_FIRST. We do not globally explore all the possible quadrilaterals, in a flowchart, but locally in a detected area of interest. Furthermore, as we know that we can rely on found quadrilaterals, we can eliminate from the analysis all the strokes found in a quadrilateral because we know that they cannot belong to another box.
TABLE V. COMPARISON OF RESULTS ON FLOWCHART DATASET
Stroke labeling Symbol recognition Method Text Non-text Text Non-text Statistical [6] 73.9% 39.8% 71.9% 29.6% Structural [7] 97.8% 80.6% 71.7% 72.8% Stat + struct 97.2% 84.8% 74.1% 75.5%
In table V, the results obtained with our method are com-pared to results obtained by the statistical approach presented by Awal et al. in [6] and by the structural approach presented by Lemaitre et al. in [7]. As it can be observed, the fusion of statistical and structural information improves the flowchart recognition process. In particular, we now obtain 84.8% of correct stroke labeling on non-text symbol, in comparison to 80.6% with structural approach and 39.8% with statistical ap-proach. At a global level, the fusion of statistical and structural information in a perceptive approach improves results compare to both statistical and structural approach.
IV. CONCLUSION
In this paper, we have presented a way to combine statistical and structural information in a perceptive mecha-nism for diagram recognition, which detects boxes as salient elements. Statistical information was introduced using the FIND_BEST_FIRST operator presented in [8], which allows us to perform a stochastic analysis in a limited subset of the parsing tree. Moreover, in our approach, the statistical information does not come from a classifier but from a score directly defined and so understandable by user.
We have validated our work on an open database of 171 flowcharts. Our results show that fusion of statistical and struc-tural information for perceptive vision improves recognition rate. This is thanks to a significant improvement of text-symbol segmentation. We obtain a recognition rate of 84.8% for non-text strokes (decrease of 21.6% of mislabeled strokes compare to the global structural approach). Moreover, it reduces com-putation time in comparison to a global structural approach and simplifies grammar writing.
REFERENCES
[1] Y. Qi, M. Szummer, and T. P. Minka, “Diagram structure recognition by bayesian conditional random fields,” in CVPR, 2005, pp. 191–196. [2] G. Feng, C. Viard-Gaudin, and Z. Sun, “On-line hand-drawn electric
circuit diagram recognition using 2d dynamic programming,” Pattern Recognition, vol. 42, no. 12, pp. 3215–3223, 2009.
[3] G. Tilak and K. Ananthakrishnan, “Sketchuml - sketch based approach to class diagrams,” in Proceedings of IUI, 2009.
[4] Z.-M. Yuan, H. Pan, and L. Zhang, “A novel pen-based flowchart recognition system for programming teaching,” in WBL, 2008, pp. 55–64. [5] H. Miyao and R. Maruyama, “On-line handwritten flowchart recognition,
beautification, and editing system,” in ICFHR, 2012, pp. 83–88. [6] A.-M. Awal, G. Feng, H. Mouch`ere, and C. Viard-Gaudin, “First
exper-iments on a new online handwritten flowchart database,” in DRR, 2011, pp. 1–10.
[7] A. Lemaitre, H. Mouch`ere, J. Camillerapp, and B. Co¨uasnon, “Interest of syntactic knowledge for on-line flowchart recognition,” in Nineth IAPR International Workshop on Graphics RECognition (GREC 2011), 2011, pp. 85–88.
[8] A. O. Maroneze, B. Co¨uasnon, and A. Lemaitre, “Introduction of statisti-cal information in a syntactic analyzer for document image recognition,” in DRR, 2011, pp. 1–10.
[9] B. Co¨uasnon, “Dmos, a generic document recognition method: Appli-cation to table structure analysis in a general and in a specific way,” International Journal on Document Analysis and Recognition, IJDAR, vol. 8, no. 2, pp. 111–122, June 2006.