809 جاح ىفطصم سرلا دي سلا بيارقنلا اللهدبع نادوسلا ةريزلجا ةعماج جاتن ا دراولم لثمألا مادخت سلال يداصتقا يميقت نادوسلا ,ةريزلجا عوشربم حمقلا ( 2014 / 2015 )
Economic assessment of resource use in wheat production in Gezira
Scheme, Sudan (2014/15)
Elsayed, E.M. Elnagarabi¹, Dafalla M. D. Mohamed² and Alawia .O. Hassan³ 1
Department of Agricultural Sciences, University of Gezira, Wad Medani, Sudan. 2
Agricultural Bank of Sudan, Gezira State, Sudan. 3
Agricultural Research Corporation, Wad Medani, Sudan.
ABSTRACT
The Gezira Scheme used to be the main contributor to wheat production in Sudan, but production was sharply declined during the last few years. The main objective of this study was to appraise resource use in wheat production in the Gezira Scheme in season (2014/15). The techniques of descriptive analysis, multiple linear regression and Cobb -Douglas production function were employed in this paper as analytical tools. Results showed that 78% of variation in wheat yield was due to variations in resource use. Elasticity of labor and capital were 0.08 and 0.14, respectively. There are technical inefficiency and technological change problems and underutilized resources. It was concluded that farmers were not optimally utilizing resources and there is an ample scope for improvements in resource utilization. The study recommended cultivation of improved varieties and application of the different agricultural operations at the optimum timing to increase productivity.
INTRODUCTION
Gezira scheme is one of the biggest irrigated projects in the world. It contributes with a share of 60% of Sudan's total wheat production during the period 1980-1990, which played a considerable role on food security and self-sufficiency. However, drastic reduction in wheat cultivated area in Gezira scheme has taken place in 1999 due to the decline in wheat productivity coupled with escalated cost of production. In 1991 wheat has become an optional crop and the total cultivated area in season 2001 reduced to 7% of the total area in 1991 (Al mucashfe, 2006).
A number of empirical studies has been undertaken to determine the optimal resource use in wheat production, the most important of which were summarized below.
Hashim and Faki (1986) concluded that the contribution of irrigation on yield variability was quite significant in most of wheat producing areas and grain yield was increased by 65% and 35% for 1N and 2N fertilizer levels respectively at Massallamia division, increased by 17% and73% in the Southern division and by 93% and 69% at Maatug division respectively.
Ageeb and Mohamed (1986) found that nine irrigations at 10-14days interval instead of eight irrigations at 21 days interval resulted in a substantial increase in wheat yield. Farah. Saeed (1996) studied the response of condor cultivar to variations in irrigation intervals at three growth stages. He found that in all treatments grain yield was better
810
when irrigation was applied every 14days than every 10days during the final growth stage. He added that this finding should discourage farmers from applying excessive water to their wheat fields during maturation stage.
Ibrahim 1996 cited that Izzat (1987) conducted an on-farm trial at three sites in the Gezira scheme representing the Central, Southern and Northern divisions, where different combination of N and P were tested with three methods of application. The results showed that the highest yield was obtained by 2N+1.5P. Results also indicated that wheat yield was highest in Turabi and lowest in Wad Medani.
Alfeel and Albushara (2011) concluded that the technical efficiency of wheat production in Gezira scheme is 0.63 which means that wheat production could have been increased by 37% at the same level of inputs.
RESEARCH METHODOLOGY
To achieve the objectives of the study, this paper depended on both primary and secondary data and information. Primary data was collected by mean of a pre-tested semi-structured questionnaire from 250 farmers applying multi-stage sampling techniques. The primary data was supplemented by secondary data and information collected from the agricultural research corporation, head quarter of the Gezira scheme, annual reports of the bank of Sudan, Central Bank of Sudan, and other relevant previous studies .The techniques of descriptive analysis, multiple regression and Cobb –Douglas production function were used in this paper as analytical tools.
Based on the assumption that the production will vary in a systematic way with the level of input usage and according to David (1996), the relationship between inputs and output can be explained mathematically by the following equation.
Y = α + β1 Χ1 + β2Χ2 + β3Χ3 +...βnΧn Where:
Y: Wheat output per feddan in SGD. Α: Coefficient of production.
β: Coefficients. Χ1: Sowing date Χ2: Varieties.
Χ3: Quantity of seeds per feddan in SDG. Χ4: Quantity of fertilizer per feddan in SDG. Χ5: Quantity of herbicides per feddan in SDG. Χ6: Expenses of irritations per feddan In SDG. X7: irrigation intervals.
Cobb -Douglas production function
The Cobb-Douglas production function is a particular functional form of the production function. It is widely used to represent the technological relationship between the amount of two or more inputs, particularly physical capital and labor, and the amount of output that can be produced by those inputs
Gujarati 1988 stated that the Cobb Douglas production log.log form to be used in the estimation of the regression model. Accordingly, this function represents the basic analytical procedure which is used in this study. The equation of logarithmic Cobb-
811
Douglass function has the following form: y = 0 + K1 + l2 Where: Y: wheat output in SDG. B0: Coefficient of Elasticity. K: Capital used. L: Labor employed. β1: Elasticity of capital β2: Elasticity of Labor.
RESULTS AND DISCUSSION
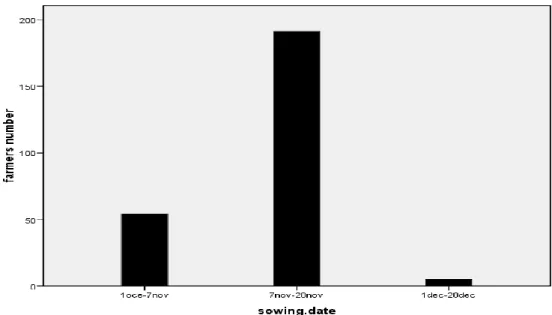
Descriptive analysis1- Sowing date: Early sowing date starts at first of October while late date at the end of December. As shown in figure 1, 97.6% of the sampled farmers practice sowing during the period 7 to28November. However, they adopt recommendations of the Agricultural Research Corporation (ARC).
Figure 1. Sowing date adopted by the sampled farmers in Gezira scheme, season (2014-15).
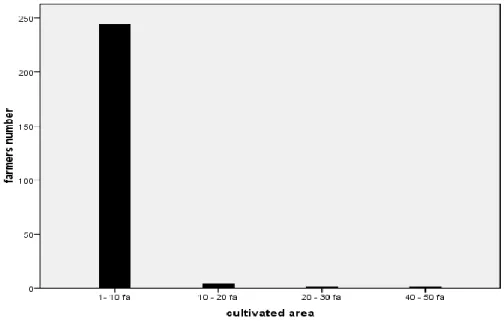
2- Cultivated area: According to Gezira tenancy system, tenants own on average 5 to10 feddan. As figure 2 shows, 97.6% of the surveyed farmers cultivated an area between 1-10 feddan while 0.4% cultivated more than 1-10 feddan with maximum up to50 feddan.
812
Figure 2. Wheat cultivated area in Gezira scheme, season (2014/15).
3- Wheat varieties: Imam, Nielain, Turkey and Buhain are the main common varieties used in the scheme. As in Figure 3, 86.8% of farmers cultivated Imam in season 2014-2015. The high rate of adoption of Imam Cultivars is attributed to its tolerance to high temperature.
Varieties
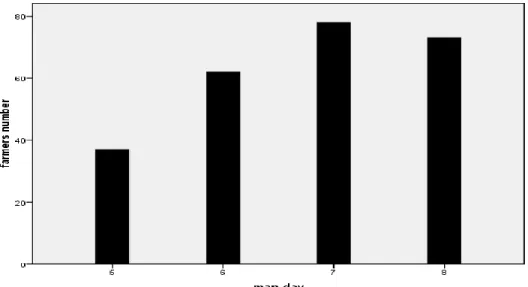
813 4- Labor hours/irrigation:
The time spent on irrigation range between 5-8 hours per day. From the figure 4, 80% of farmers in the sample spent about seven hours/day on the irrigation times. While only 2%spend eight hours per day. The time spend on irrigation differs.
Figure 4. Man day hours/irrigation for wheat production Gezira scheme season (2014/15).
Seed rate
The recommended seed rate by the (ARC) is 50kg/fed (0.12 ton/ha). As figure 5 illustrates 97.6% of sampled farmers have applied the recommended seed rate, which reflects that most of the farmers are aware of the recommended technical package and have received good extension services.
814 6. Fertilizer rate:
95.6%of the farmers in Gezira scheme have applied fertilizer according to the recommendations from the ARC (2:1 urea: super).
Figure 6. Fertilizer applications to wheat crop in Gezira scheme, season (2014/15).
7- Herbicide: 96.4% of farmers used less amount of herbicide in Gezira scheme because all the varieties used are resistant to insects and many farmers are dependent on department of Gezira scheme to apply herbicides.
815
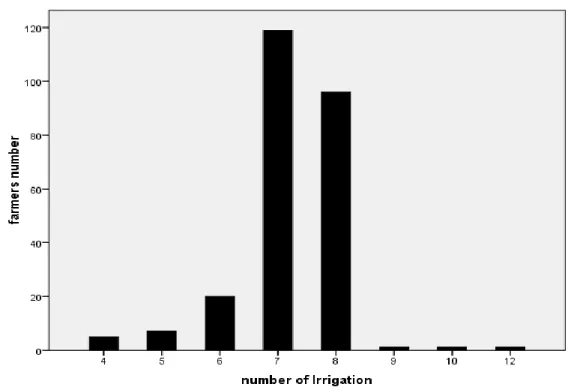
8- Number of irrigations: Wheat needs to have 8 irrigations during the season. 47.6% of farmers gave 7 irrigations. Those farmers applied less number of recommended irrigation because sometimes the water is not available at the right time and sometimes.
Figure 8. Number of irrigations applied by farmers to wheat crop in the Gezira scheme, season (2014/15).
9- Irrigations intervals: 52% of farmers applied 15 days intervals between irrigations. Most farmers applied the recommendation of the (ARC) because this recommendation will lead farmers to achieve high productivity.
816 2. Results of multiple linear regression:
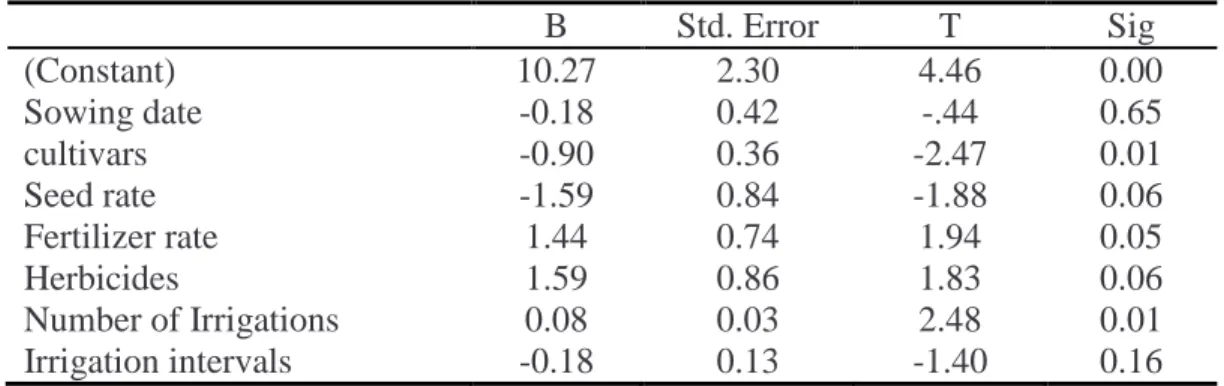
The dependent variable is yield in sac/feddan and the independent variables are sowing date, cultivars, seed rate, fertilizer rate, herbicides, number of irrigations, and irrigation intervals.
Table 1 explained the regression results of wheat production which showed the coefficient of the dependent variables, T values at level of significant of 95% the R² adjusted and F value.
Table 1. Multiple linear regression results of wheat yield in Gezira scheme (2014/15).
B Std. Error T Sig (Constant) 10.27 2.30 4.46 0.00 Sowing date -0.18 0.42 -.44 0.65 cultivars -0.90 0.36 -2.47 0.01 Seed rate -1.59 0.84 -1.88 0.06 Fertilizer rate 1.44 0.74 1.94 0.05 Herbicides 1.59 0.86 1.83 0.06 Number of Irrigations 0.08 0.03 2.48 0.01 Irrigation intervals -0.18 0.13 -1.40 0.16
Source: Author own calculation.
R² adjusted = 0. 78 F value = 4.015.
Y = 10.27 + (-0.18) X1 + (-0.90) X2 + (-1.59) X3 + (1.44) X4+ (1.59) X5+ (0.08) X 6+ (-0.18) X7
As figures of Table 1 read, the significant independent variables are sowing date, variety type, seed rate, fertilizer rate, herbicide, number of irrigations and intervals between irrigation. The coefficient of determination R² (adjusted) equals 0.78. This means that 78% of the variation in wheat production is caused by the variations in the above variables. F value is 4.015 which are highly significant. The intercept term has got a coefficient of10.27 and it is significant.
Sowing date variable has a negative coefficient sign mounting to -0.18 and it is significant. This indicates that the delay in sowing dates leads to decreased yield. Late sowing dates are common practices in Gezira Scheme in particular and in irrigated schemes in general. The reason is the late arrival of machinery, spare parts and fuel which delayed land preparation and sowing date.
The Varieties variables have a negative coefficient amounting -0.90 and it is significant, indicating that Imam variety is of low yield compared with the other improved varieties, which means that farmers using improved varieties are more efficient. This result calls for usage of wheat improved varieties.
The seed rate variable has a negative coefficient amounting -1.59 and is significant. The seed rate is so important in the planting process. If the seed rate increase by1% the average yield decrease by1.59 %. So farmers should reduce the seed rate.
The fertilizer rate variable has a positive coefficient amounting to 1.44 and is significant. The fertilizer rate is the important factors in the agriculture because the
817
fertilizer is of motivational elements to increase production. If fertilizer rate increase by 1% the average yield will increase by1.44%.
Herbicides variable has positive coefficient amounting 1.59 and it is significant. The herbicide is an important factor in agriculture because it reduces weeds. If herbicide rate increases by 1% the average yield will increase by 1.59. So I'd recommend applying more herbicides.
The number of irrigations has positive coefficient amounting 0.08 and it is significant. It is known that the wheat crop needs 7-8 irrigations according to the recommendations. Increasing the number of irrigations or decrease has a direct impact on productivity. The increase in numbers of irrigations by 1% will lead to increase in average yield by 0.08%. The irrigation intervals in the wheat equation have negative regression coefficient amounting-0.18 and it is not significant. By referring to the recommendations of the Agricultural Research Corporation, the period recommended between Rip and the other is 12-14 days, but in some cases and due to the lack of water or dryness there is increasing in the number of days resulting in low productivity. If the intervals between irrigation increased by 1% that will decrease average yield by0.18%.
As the figures of Table 1 read, the coefficients of cultivars, sowing date, seed rate and irrigation intervals all have negative signs which mean that farmers used Imam Variety, delayed sowing date, using less seed rates and using long intervals between irritations. This result implies that the use of those variables is inefficient.
The positive coefficients of fertilizers, herbicides and numbers of irrigations variables indicate that they achieve more wheat output explaining that the use of them is more efficient.
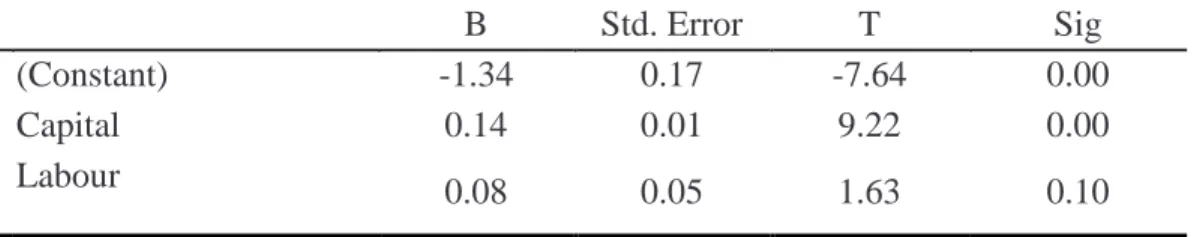
Result of cobb -douglas production function of wheat
The Cobb -Douglas production function presented in Table 2 explained the Cobb-Douglas production function result which showed the coefficient of the dependent variables, T values at level of significant of 95%, the R² adjusted and F value.
Table 2. The result of Cobb -Douglas production function for wheat in Gezira scheme (2014-15).
B Std. Error T Sig
(Constant) -1.34 0.17 -7.64 0.00
Capital 0.14 0.01 9.22 0.00
Labour 0.08 0.05 1.63 0.10
Source: Aauthor Owin Calculations. R² adjusted = 0.25
F value = 42.55
Lny= -1.34 + (0.14) LnK+ (0.08) LnL
According to the T test, capital and labor variables are significant at 5% level of significance.
As the coefficient of determination is equal to 0.25 this means that 25% of variation in wheat production is due to the variations in Labor and capital variables and 75% is due to other factors which are not included in this study, mainly the technological change
818
(Bushara and Dongos, 2010). The coefficient of efficiency t has got a negative sign-1.34 and it is significant which reflects the inefficiency and the problem of the technological change.
The partial technical elasticity of capital and Labor are 0.14 and 0.08respectively, implies that an increase of capital and Labor by 1% will increase wheat output by 0.14%a nd0.08% respectively if other factors are constant, and the share of contribution of Labor in wheat output is relatively less than that of capital.
The overall productive elasticity is 0.22, which is less than1, implies that output of wheat in Gezira scheme produced at decreasing returns to scale concluding that the Cobb-Douglas Production function of wheat in Gezira scheme is non-linear .Non-homogeneous function and has an increasing return to scale.
CONCLUSION
The study concluded that there is under utilization of resource use in wheat production in Gezira Scheme due to the problems of technical inefficiencies and technological change, which is, attributed mainly to the. Macroeconomic policies adopted by the Government (Bushara and Dongos, 2010).
REFERENCES
Ageeb, O.A. and M.S. Mohamed. 1986. Agronomy of wheat. Annual report. Gezira Research Station.
Akash, M.H. 1982. Wheat and barley agronomy. Annual report of the Gezira research station and substations. Season 1975/76
Al-Fee, A.M. and Elbushara. 2011. Economic efficiency of wheat production in Gezira Scheme. Sudan.
Almucashfe, G.M. 2006. Economic appraisal of factors affecting wheat productivity in the Gezira scheme, (2002-2003) Sudan.
BaoHong, T. 2008. Cobb_Douglas production function Cob, c. w; Douglas, p, h.(1928).A theory of production.
Bushara, M.O. and R.E. Dongos. 2010. Decomposing total factor productivity change of bread wheat production in the Gezira Scheme. Sudan J Agric Res 16: 141-168. Farah, S.M. 1996. Water relations and Water Requirements of wheat. Wheat Production
and Improvement in the Sudan Proceedings of the National Research. Fisher, S. and Dorubusch. 1983. introduction to microeconomics.
Gujarti, N.D. 1988. Basic econometrics.2nd edition ",Singapore.
Hashim, A. and H. Faki. 1986. Economic evaluation of on farm research on wheat during the season. Annual report of the Gezira research station. Season 1985/86.
Ibrahim, H.S. 1996. Nutrition of wheat production and improvement in the Sudan. Preceding the national research review workshop 27-30 August 1995. Wad Medani – Sudan. (Sudan Gezira board, annual report1988/99)
819