HAL Id: hal-00329343
https://hal.archives-ouvertes.fr/hal-00329343
Submitted on 14 Jul 2004
HAL is a multi-disciplinary open access
archive for the deposit and dissemination of
sci-entific research documents, whether they are
pub-lished or not. The documents may come from
teaching and research institutions in France or
abroad, or from public or private research centers.
L’archive ouverte pluridisciplinaire HAL, est
destinée au dépôt et à la diffusion de documents
scientifiques de niveau recherche, publiés ou non,
émanant des établissements d’enseignement et de
recherche français ou étrangers, des laboratoires
publics ou privés.
Multipoint analysis of the spatio-temporal coherence of
dayside O+ outflows with Cluster
M. Bouhram, B. Klecker, G. Paschmann, H. Rème, A. Blagau, L. Kistler, P.
Puhl-Quinn, J.-A. Sauvaud
To cite this version:
M. Bouhram, B. Klecker, G. Paschmann, H. Rème, A. Blagau, et al.. Multipoint analysis of the
spatio-temporal coherence of dayside O+ outflows with Cluster. Annales Geophysicae, European
Geosciences Union, 2004, 22 (7), pp.2507-2514. �hal-00329343�
SRef-ID: 1432-0576/ag/2004-22-2507 © European Geosciences Union 2004
Annales
Geophysicae
Multipoint analysis of the spatio-temporal coherence of dayside
O
+
outflows with Cluster
M. Bouhram1, B. Klecker1, G. Paschmann1, H. R`eme2, A. Bl˘ag˘au1,3, L. Kistler4, P. Puhl-Quinn1,*, and J.-A. Sauvaud2
1Max-Planck-Institut f¨ur extraterrestrische Physik, D-85741 Garching, Germany 2CESR-CNRS, BP-4346, F-31028 Toulouse, France
3Space Science Institute, R-76911 Bucharest, Romania
4Space Science Center, University of New Hampshire, Durham, NH-03824, USA *now at Space Science Center, University of New Hampshire, Durham, NH-03824, USA
Received: 30 September 2003 – Revised: 17 March 2004 – Accepted: 14 April 2004 – Published: 14 July 2004 Part of Special Issue “Spatio-temporal analysis and multipoint measurements in space”
Abstract. The spatial distribution of ionospheric ion outflow
from the dayside cusp/cleft has previously been studied in great detail with numerous satellite missions, but only statis-tically. Between July and November 2001, the orbit configu-ration of the Cluster multi-satellite system close to its perigee (4 Earth radii) allows for delay times between spacecraft of about 4 and 35 min in crossing the cusp/cleft. This enables for the first time to assess the spatial and temporal coherence of O+ion outflow on time scales of the order of the satellite
time lag. After presenting two contrasting events in detail, O+velocities and outflow intensities from three spacecraft, available on 18 events, all with a similar orbit, have been cross-correlated to quantify the degree of coherence in the outflow. The main result from the analysis is that, although dayside outflows are a permanent feature, steady-state condi-tions are surprisingly never achieved. In particular, a signifi-cant variability is found for convection drift and local outflow intensities on small time scales. This variability of local in-tensities is not found to depend on the total strenghth of the outflow, which is much more stable and increases with the dynamic solar wind pressure.
Key words. Ionosphere (Ionosphere-magnetosphere
inter-actions) – Magnetospheric physics (Polar cap phenomena)
1 Introduction
Since the discovery of energetic O+ions at magnetospheric
altitudes by Shelley et al. (1972), many satellite observations consistently demonstrated that the Earth’s ionosphere acts as a significant source of magnetospheric plasma (Chappell et al., 1987; Hultqvist et al., 1999). Statistical studies from ear-lier satellite missions point out that the total mass supply is
Correspondence to: M. Bouhram
of the order of 1 kg s−1(Yau and Andr´e, 1997; Cully et al., 2003), while the largest fluxes of heavy ions originate from the dayside cusp and cleft regions (Lockwood et al., 1985; Thelin et al., 1990).
The source of free energy that powers the outflow is a combination of solar UV radiation and solar wind electrome-chanical energy. Long-term average ion outflow data by the DE-1, Polar and Akebono satellites (Yau et al., 1985, 1988; Peterson et al., 2001; Cully et al., 2003) revealed a good cor-relation between the total outflow rate and measurements of the solar and geomagnetic activity, as monitored by the daily
F10.7 and 3h Kp indexes, respectively. On the other hand,
numerous case studies reported a good agreement between strong disturbances in the solar wind inputs, such as during the passage of an interplanetary shock associated with a coro-nal mass ejection, and a dramatic enhancement of the iono-spheric outflowing ion fluxes (Moore et al., 1999; Strange-way et al., 2000; Fuselier et al., 2002). Recently, using a large database of ion observations from the Akebono satel-lite, Cully et al. (2003) found that three solar wind param-eters are primarily responsible for controlling ion outflow rates: the solar wind pressure, the solar wind electric field and the variability in the interplanetary magnetic field (σIMF)
in the one hour preceding. However, if the correlation be-tween ion outflow and any set of solar wind and Kp level
parameters is statistically well established, it is also low, as reported by Cully et al. (2003). Another recent study by Pe-terson et al. (2002) points out that when applying such empir-ical relations to observations with several satellites in shorter time and smaller spatial scales, the outflow rate can deviate enormously, by more than 3 orders of magnitude from the expected average value.
In the dayside auroral and polar regions, the outflow ob-served at high altitude is the result of a long chain of pro-cesses. In the ionosphere, uploading processes, such as Joule heating caused by the dissipation of the Pedersen currents
2508 M. Bouhram et al.: Analysis of dayside O+outflows with Cluster
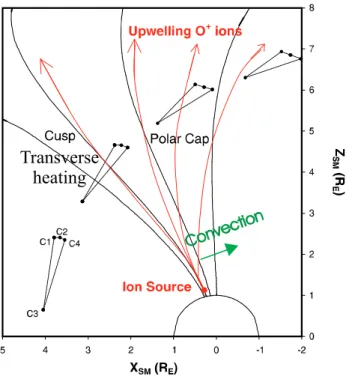
Transverse
heating
Fig. 1. Drawing of the Cluster orbit configuration in the dayside auroral and polar regions between July and November 2001.
and/or upward acceleration associated with soft electron pre-cipitation (see, for example, Liu et al., 1995), raise the scale height of the ionospheric constituents so that heavy ions can reach higher altitudes where stronger energization mecha-nisms occur and lead to ion escape from the Earth’s grav-ity. In the dayside cusp/cleft, the most dominant energization mechanism is transverse heating associated with enhance-ments in the broad-band extremely low-frequency (BBELF) wave activity (Lund et al., 2000). Higher up, ion transport is a combination of upward flow along the magnetospheric field lines via the mirror force and horizontal motion due to the magnetospheric convection, which depends highly on the IMF orientation (Weimer, 1995; Ruohoniemi and Green-wald, 1996). Hence, ions observed at any given point in the high latitude polar cap could originate from different source regions. Since all of these underlying physical processes re-sponsible for non-thermal ion outflow are solar wind depen-dent, the variability in outflowing ion fluxes and energies can be easily understood as a direct reflection of small temporal and spatial scale processes associated with variations in the solar wind energy input. Unfortunately, since most of the previous studies were done from a single satellite, almost no information is currently available on simultaneous temporal and spatial coherence of ion outflow.
The purpose of this paper is to investigate the spatial and temporal coherence of the ion outflow observed on the Clus-ter multi-satellite system. The outline of the paper is as fol-lows. In Sect. 2, we describe the instrumentation used in the present study and the satellite configuration. In Sect. 3, we summarize outflowing ion observations for two specific
2001/09/23
10:00 10:30 11:00 11:30 12:00 12:30 13:00 13:30
Fig. 2. Overview of an upflowing ion event on 23 September 2001. From top to bottom, (a) time evolution of the solar wind dynamic pressure; (b) time evolution of the IMF By(blue) and Bz(red)
com-ponents; and (c), (d), (e), omnidirectional O+flux measurements in Log[m−2 s−1 sr−1keV−1] aboard C4, C1 and C3, respectively. The dashed vertical line in Fig. 2a indicates the onset of O+ obser-vations with Cluster.
events. In Sect. 4, we present the results of a statistical study where we cross correlate satellite data for 18 events in the high-latitude cusp/cleft and dayside polar cap. Finally, a summary of conclusions is given in Sect. 5.
2 Cluster configuration and instrumentation
The four identical Cluster satellites have an elliptical orbit (4.0×19.6 RE)with an inclination of 90◦. Between July and
November 2001, the Cluster fleet crossed the mid-altitude dayside cusp and polar cap regions close to their perigee with a large separation distance, as schematically shown in Fig. 1. Here, C4 is the leading satellite and C2, C1 and C3 are lagged with respect to C4 by about 2, 4 and 35 min, respectively.
-7.5
-9.5
-8.5
-5.0
-7.0
-6.0
Fig. 3. Two-dimensional cuts in the V⊥-V//plane of oxygen velocity distributions in Log[cm−3km−3s3] measured by C4 at 11:16:45 UT
(left) and 11:38:45 UT (right) on 23 September 2001.
Three-dimensional (3-D) distributions of upflowing O+ions were measured every spin period (4 s) over the energy range from 20 eV up to 40 keV by the COmposition and DIstribu-tion FuncDIstribu-tion (CODIF) analyser (R`eme et al., 2001) aboard three satellites, C1, C3, and C4. In this study, in-flight con-vection measurements are available from the Electron Drift Instrument (EDI) (Paschmann et al., 2001) with a tempo-ral resolution of 1 s aboard three satellites, C1, C2 and C3. Aboard C4, the convection drift may be inferred from O+ ion distributions measured by CODIF.
3 Examples of events
3.1 23 September 2001 case
Figure 2 shows an overview of solar wind parameters and O+ data on 23 September 2001. IMF and solar wind bulk param-eters are available from the Advanced Composition Explorer (ACE), which is located in an orbit around the libration point L1, upstream of the magnetosphere (∼220 RE). Therefore,
we need to calculate the propagation time tP for the solar
wind to reach the magnetosphere and then to communicate in the ionosphere. Since ACE is located at a close separation distance d⊥∼20RE to L1, using the X distance method is
more convenient. We use the same technique as in the work of Ridley et al. (1998). The maximum error associated with the X distance method is about 0.25 (min/RE)×d⊥ (Collier
et al., 1998), which is equal to 5 min for our case studies. Cluster satellites are travelling in the Northern Hemisphere close to noon at invariant latitudes ranging from 72◦up to
85◦and at radial distances from 4.5 up to 6.5 RE, with a
con-figuration according to the drawing in Fig. 1.
During this event, Cluster/CODIF detected strong O+ fluxes during a period of southward IMF and several solar wind pressure pulses (from 3 up to 12 nPa), mainly related to the solar wind density. For each Cluster satellite crossing, two distinct regions associated with different types of O+ distributions can be distinguished. Figures 3a and b show O+velocity distributions measured by C4 inside these two regions. First, Cluster crosses a transverse heating region, limited by vertical lines in Fig. 2, as evidenced by a sudden increase in ion mean energies. Inside this region, the obser-vation of an elevated conic (Fig. 3a) with a peak flux broadly extended in pitch angle and a significant upgoing bulk veloc-ity indicates that transverse heating occurs over a broad alti-tude range as long as ions convect poleward through the re-gion. Here, the characteristic energies and elevation angle of the conic depend on the strength of the heating averaged over the time of flight (typically a few minutes) of ions between the topside ionosphere and the satellite location. Poleward of the heating region, cold beam-like distributions at lower energies are observed along the satellite track (Fig. 3b). This picture can be explained by transverse heating in a region of finite latitudinal extent, followed by adiabatic convective flow to the satellite orbit (Horwitz, 1986; Dubouloz et al., 1998; Bouhram et al., 2003a,b). The latter stage also con-tributes to a velocity filter effect, as evidenced by the obser-vation of latitude-energy dispersion in ion energy spectra.
Because O+outflow is a permanent phenomenon over the dayside polar region, and in order to suppress satellite time lag effects, it is more convenient to compare satellite data in a spatial coordinate system. Because Cluster satellites have a
2510 M. Bouhram et al.: Analysis of dayside O+outflows with Cluster
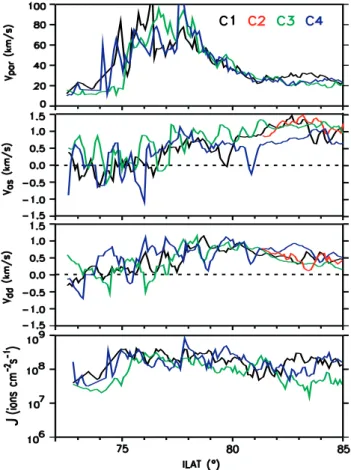
Fig. 4. From top to bottom, plots of the upward mean velocity, the antisunward and the dawn-dusk components of the ionospheric con-vection drift, and the integral upward flux as a function of invariant latitude on 23 September 2001. All quantities are averaged in lati-tudinal bins of 0.1◦. The colours refer to C1 (black), C2 (red), C3 (green) and C4 (blue).
quasi-polar orbit and their separation in magnetic local time (MLT) is not significant (∼0.02 h), we analyzed the data as a function of invariant latitude (ILAT). Figure 4 shows the evolution of different O+ moments and components of the ionospheric convection drift as a function of ILAT. In this kind of representation, identical structures observed by two satellites can be interpreted as stationary on time scales of the order of the satellite time lag. If these structures are different, it suggests that clear temporal changes occur on such time scales. For example, a slight change in the location or the intensity of the upward velocity peak may indicate a motion of the heating region or a change in its strength, respectively. Similarly, a change in the upward velocity dispersion may be interpreted by temporal changes in the global convection field. In the analysis, the Cluster orbit and convection ve-locities are projected in the topside ionosphere at 1000 km altitude using the Tsyganenko 96 magnetic field model (Tsy-ganenko, 1995), which depends on the By and Bz
compo-nents of the IMF, the solar wind pressure and the disturbance storm-time (DST) index. This technique uses the relation
VD=(E×B)/B2between the drift velocity VD and the
elec-tric field E, and assumes that the magnetic field lines are
Table 1. List of rank correlation coefficients of invariant latitude series of upward velocity, convection drift and upward integral flux between C1 and C4, and between C1 and C3, on 23 September 2001. The last row indicates the corresponding flux variability.
Parameter C1/C4 C1/C3
Upward mean velocity 0.85 0.74
Convection drift 0.36 0.67
Upward integral flux 0.47 0.37
Flux variability 2.8 6.0
equipotentials when mapping the electric field in the topside ionosphere. Then, the ionospheric convection drift has been decomposed into two components: an antisunward compo-nent, Vas(i.e. in the XSM–ZSMplane) and a dawn-dusk
com-ponent, Vdd(i.e. in the YSM–ZSMplane). We defined the
in-tegral upward flux by J =n×u//×A, where n and u//are the
ion density and upward mean velocity, and A≈[Bi/B(r)]1/2is
the ratio of the cross-section areas of the magnetic flux tube between the topside ionosphere (i) and the point of observa-tion r. The quantity J may be used as a proxy to investigate temporal changes associated with the ionospheric source of the outflow.
We remind the reader that the time lag τ14 between C1
and C4 is about 4 min, while the time lag τ13 between C1
and C3 is longer, about 35 min. Because the autocorrela-tion funcautocorrela-tion of parameters associated with the outflow pre-sumably falls down with increasing lag, we would expect a larger correlation between C1 and C4 than between C1 and C3. On the other hand, the time needed for each satel-lite to travel across the latitudinal range of interest is rela-tively long (about 90 min). Figure 4 shows that a similar behavior is observed for all quantities. However, because of systematic small differences, we see the direct evidence that the steady-state picture used to describe dayside ion out-flows does not ideally exist. In particular, we can see that upward integral fluxes may differ locally by up to 1 order of magnitude. Table 1 shows the results of rank cross cor-relations of the spatially binned data from C4 and C3 with data from C1. As expected, cross correlation coefficients of data between C1 and C4 are higher than those of data be-tween C1 and C3. We also defined an average local variabil-ity in ion fluxes between two Cluster satellites Cmand Cnby
σ[Log(Jmn)]=<|Log(Jm/Jn)|>, where Jmand Jnare the
in-tegral upward flux profiles as a function of invariant latitude. Hence, we can see that fluxes differ on average by about a factor of 3 between C1 and C4, and 6 between C1 and C3. 3.2 14 August 2001 case
Figure 5 shows an overview of solar wind parameters and O+ data on 14 August 2001. Cluster travels close to noon with the same orbit as for the first event during a period following
2001/08/14
23:30 00:00 00:30 01:00 01:30 02:00 02:30 03:00
00:20:00 00:50:00 01:20:00 01:50:00 02:20:00 02:50:00
Fig. 5. Overview of an upflowing ion event on 14 August 2001. The format is the same as that in Fig. 2.
several turnings of the IMF Bzcomponent, and steady solar
wind bulk parameters (pressure ∼2 nPa). In contrast to the previous event, one counterintuitive feature on the three en-ergy spectra is the observation of multiple sudden increases in the mean energy, each of them followed by latitude-energy dispersions. Plots in the velocity phase space of both O+and
H+distributions indicate that these structures are associated
with multiple transverse ion energization regions and are also accompanied by protons injections from the magnetosheath (not shown). In a rough visual comparison, we can identify four such regions on C1 and C4, labeled R1 through R4 and limited by vertical lines in Fig. 5. Note that later, on C3, only two structures are observed, a first one between 1:00 and 1:30 UT and another one between 2:00 and 2:20 UT.
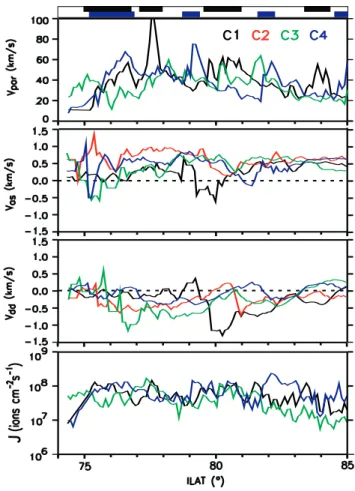
To investigate the consistency of the features observed by the three spacecraft for this event, we have plotted in Fig. 6 different ion moments as a function of ILAT in the same for-mat as in Fig. 4. We also indicated with color bars the
lo-Fig. 6. Plots of particle moments as a function of invariant latitude on 14 August 2001. The format is the same as that in Fig. 4.
Table 2. List of rank correlation coefficients of invariant latitude series of upward velocity, convection drift and upward integral flux between C1 and C4, and between C1 and C3, on 14 August 2001. The last row indicates the corresponding flux variability.
Parameter C1/C4 C1/C3
Upward mean velocity 0.29 0.26 Convection drift −0.18 −0.10 Upward integral flux 0.24 0.31
Flux variability 3.4 4.4
cation in ILAT of the multiple acceleration regions observed on C1 and C4. While C1 and C4 detected the heating re-gion R1 at approximately the same location with similar up-ward velocities and fluxes, the next three other structures are observed at very different locations by both satellites. This result, along with the presence of substantial differences in the upward velocities, make it difficult to definitely state whether structures R2 through R4 observed by C1 are mov-ing, with temporal variations in ion heatmov-ing, and are observed
2512 M. Bouhram et al.: Analysis of dayside O+outflows with Cluster 0.3 1.0 10. 30. C o rr e la ti o n C o e ff ic ie n ts
Fig. 7. Comparison between the C1-C4 (blue) and C1-C3 (green) cross correlation coefficients of the upward mean velocity (filled circles) and the ionospheric convection drift (crosses) as a function of the IMF variability in nT.
at different locations by C4, or all of these structures corre-spond to sporadic (of short duration), small-scale energiza-tion regions. This would require the use of addienergiza-tional in-struments, which is beyond the scope of the paper. On the other hand, we may note from large differences between C1 and C3 that the structures of O+energization and outflow are highly variable on a time scale of 35 minutes. Note that for this event, the variability in ion fluxes is also higher than for the first event. Table 2 shows the corresponding cross corre-lation coefficients computed over the full ILAT range in the same format as those in Table 1. Hence, we can see that cross correlations are very poor, in particular between C1 and C4 (e.g. for short time lags).
4 Statistical analysis
The purpose of this section is to quantify the coherence in outflowing ion features. An analysis similar to the previous two examples was done selecting 18 polar cap events (i.e. 54 satellite passes) in the Northern Hemisphere between 10:00 and 14:00 MLT.
Figure 7 shows the results of cross correlations of data from C4 and C3 with data from C1, as a function of the IMF variability σIMF. Here, let us note that for 70% of events
as-sociated with highly variable (mainly Bz)IMF conditions,
multiple energization regions similar to those of the 14 Au-gust 2001 event were observed. In contrast, other cases, in-cluding the 23 September 2001 event, associated with rela-tively stable IMF conditions, exhibited the classical signature of a single energization region followed by a regular latitude-energy dispersion. Such results are at least consistent with the fact that the IMF Bzcomponent controls the location and
latitudinal motion of the cusp (see, for example, Yeoman et
3´106 3´108 108 107
(a)
30. 0.3 1.0 10. 10. 1.0 0.3(b)
L o ca l fl u x v ar ia b il it y M ea n U p . F lu x (I o n s cm -2 s -1 )Mean SW Pressure (nPa)
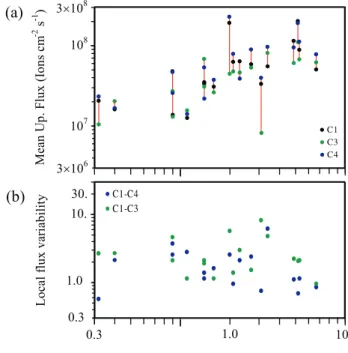
Fig. 8. Scatterplots of (a) the average integral upward fluxes mea-sured on C1 (black), C3 (green) and C4 (blue), and (b) local flux variability between C1 and C4 (blue rounds), and between C1 and C3 (green rounds), as a function of the mean solar wind pressure.
al., 2001). Because the C1/C4 time lag τ14=4 min is
signifi-cantly lower than typical times of flight of ions and the C1/C3 time lag τ13=35 min, the correlation in the upward velocity
is on average better between C1 and C4 than between C1 and C3. This is not the case for the convection drift, where correlation coefficients are comparable in both cases and of-ten close to zero, which indicates that observations are likely uncorrelated. This implies that the correlation time length of the convection field is possibly lower than the minimum satellite time lag τ14, and therefore smaller than the mean
time of flight of ions. However, this is not surprising since it is known that dayside convection patterns respond rapidly to changes in the IMF (Ridley et al., 1998; Khan and Cow-ley, 1999), particularly on time scales comparable to τ14. In
short, it is found that the correlation between satellites, is on average higher for the upward velocity than for the convec-tion drift. Note also in Fig. 7 that correlaconvec-tion coefficients of the upward velocity ILAT series follow the same behav-ior versus σIMFas those for the convection drift ILAT series.
Poleward of the heating region, the latitude-velocity disper-sion usually observed is related to time of flight effects: for each ionospheric flux tube, the corresponding latitudinal mo-tion depends on the convecmo-tion drift averaged over its time history. Therefore, the correlation in the convection drift is partly reflected in the correlation in the upward velocity.
Figure 8 shows results of the integral upward flux, av-eraged in ILAT on C1, C3 and C4, and the average local upward flux variability, as defined in Sect. 3. The results
are plotted as a function of the mean solar wind pressure
<PSW>. Note here that the solar wind pressure is relatively
steady for 70% of the cases, which are associated with a low mean pressure (<3 nPa). According to recent statistical re-sults (Cully et al., 2003), outflow intensities globally increase versus <PSW>. In Fig. 8a, fluxes differ globally by about a
factor of 2 and 5, when comparing C1 and C4 data, and C1 and C3 data, respectively. In Fig. 8b, fluxes differ locally on average by about a factor of 5 and 10, when comparing C1 and C4 data, and C1 and C3 data, respectively. Com-parison between the local and global variability in ion fluxes suggests that small-scale processes are responsible for a non-negligible variability in O+measurements, at least for time scales smaller or of the order of 30 min. Surprisingly, the lo-cal variability in ion fluxes does not depend on <PSW>, or
on the strength of the outflow. This result is at least compat-ible with previous reports based on multiple satellite passes and showing that the outflow response is prompt, and strong fluxes are continuously observed on high spatial and tempo-ral scales under strong solar wind pressure pulses (Moore et al., 1999; Strangeway et al., 2000).
5 Summary and conclusions
Combining the observations of several Cluster satellites en-abled us to assess the spatial and temporal coherence of ion outflow of ionospheric origin from the dayside cusp/cleft. Although non-thermal O+ions are well known to be a per-manent feature in the dayside cusp/cleft and polar cap, our multi-point observations show the first direct evidence of non-stationary processes in their transport. In particular, the main findings may be summarized as follows:
(1) O+ion outflows are surprisingly temporally variable.
Comparison of O+moments at a given location indicates that
ion fluxes may vary significantly on a time scale of a few minutes.
(2) Convection electric fields vary on a time scale that is much faster than the time of flight of ions to reach Cluster perigee altitudes in the dayside polar cap (3.5 to 6.5 RE).
However, upflowing velocities of ions are better correlated between satellites as they depend on the convection field av-eraged over their time of flight.
(3) Although there is a large variability in local fluxes, no dependence on the total strength is found. Indeed, the global outflow rate is much more stable and depends mainly on the dynamic solar wind pressure, which is in agreement with re-cent studies (Cully et al., 2003).
(4) This leads to the point that steady-state conditions are never achieved for processes responsible of dayside ion out-flow on a time scale of about 30 min.
As already mentioned in Sect. 1, there are several pro-cesses which act in the history of the observed flux tubes. Such processes include motion of the ionospheric source re-gion, spatio-temporal variations in the extraction processes in the ionosphere or in the transverse energization in the cusp/cleft, and changes in the convection patterns. Note that
the lack of coherence in this later process may affect not only the horizontal transport, but possibly the ion dynamics along the field lines by means of parallel energization via centrifu-gal acceleration. Unfortunately, due to the long time of flight of ions to reach Cluster from the ionosphere, a higher num-ber of multipoint measurements or alternatively, an extension of the study in two dimensions (ILAT-MLT), along with ion transport modeling studies, would be needed in order to de-convolve the contribution of all the underlying processes to the variability observed by Cluster/CODIF.
The lack of good coherence in fluxes on time scales of a few minutes and small spatial scales may be critical in terms of mass transport modeling through the magnetospheric sys-tem. Indeed, variations in the mass density have the largest geophysical consequences in regions where the magnetic field is relatively weak, e.g. in the plasma sheet and mag-netotail region where the magnetic and kinetic pressure are of the same order of magnitude. Hence, the next step would be to understand and quantify the impact of the mass flux variability on the magnetosphere dynamics.
Acknowledgements. We are grateful to the technical and scientific
personnel at MPE, Garching; CESR, Toulouse, UNH, Durham; IFSI, Frascati; IRF, Kiruna; MPA, Lindau; UCB, Berkeley; and UW, Seattle; who made the development of the CIS instrument possible. The work at MPE in Garching is supported by DLR (Deutsches Zentrum f¨ur Luft und Raumfahrt) under contract 50 OC 0102. We thank the ACE SWEPAM and ACE MAG instrument teams, and the ACE Science Center for providing the ACE data.
Topical Editor T. Pulkkinen thanks C. Cully for his help in evaluating this paper.
References
Bouhram, M., Malingre, M., Jasperse, J. R., and Dubouloz, N.: Modeling transverse heating and outflow of ionospheric ions from the dayside cusp/cleft, 1 A parametric study, Ann. Geo-phys., 21, 1753–1771, 2003a.
Bouhram, M., Malingre, M., Jasperse, J. R., Dubouloz, N., and Sauvaud J.-A.: Modeling transverse heating and outflow of iono-spheric ions from the dayside cusp/cleft, 2 Applications, Ann. Geophys., 21, 1773–1791, 2003b.
Chappell, C. R., Moore, T. E., and Waite Jr., J. H.: The ionosphere as a fully adequate source of plasma for the Earth’s magneto-sphere, J. Geophys. Res., 92, 5896–5910, 1987.
Collier, M. R., Slavin, J. A., Lepping, R. P., Szabo, A., and Ogilvie, K.: Timing accuracy for the simple planar propagation of mag-netic field structures in the solar wind, Geophys. Res. Lett., 25, 4071–4074, 1998.
Cully, C. M., Donovan, E. F., Yau, A. W., and Arkos, G. G.: Akebono/Suprathermal Mass Spectrometer observations of low-energy ion outflow: Dependence on magnetic activity and solar wind conditions, J. Geophys. Res., 108, 1093–1103, doi:10.1029/2002JA009587, 2003.
Dubouloz, N., Delcourt, D., Malingre, M., Berthelier, J.-J., and Chugunin, D.: Remote analysis of cleft ion acceleration us-ing thermal plasma measurements from Interball Auroral Probe, Geophys. Res. Lett., 25, 2925–2928, 1998.
2514 M. Bouhram et al.: Analysis of dayside O+outflows with Cluster
Fuselier, S. A., Collin, H. L., Ghielmetti, A. G., Clafin, E. S., Moore, T. E., Collier, M. R., Frey, H., and Mende, S. B.: Lo-calized ion outflow in response to a solar wind pressure pulse, J. Geophys. Res., 107, doi:10.1029/2001JA000297, 2002. Horwitz, J. L.: Velocity filter mechanism for ion bowl distributions
(bimodal conics), J. Geophys. Res., 91, 4513–4523, 1986. Hultqvist, B., Øieroset, M., Paschmann, G., and Treumann, R.:
Magnetospheric plasma sources and losses, Space Sci. Rev., 88, 7–84, 1999.
Khan, H. and Cowley, S. W. H.: Observations of the response time of high-latitude ionospheric convection to variations in the in-terplanetary magnetic field using EISCAT and IMP-8 data, Ann. Geophys., 17, 1306–1335, 1999.
Liu, C., Horwitz, J. L., and Richards, P. G.: Effects of frictional ion heating and soft-electron precipitation on high-latitude F-region upflows, Geophys. Res. Lett., 22, 2713–2716, 1995.
Lockwood, M., Chandler, M. O., Horwitz, J. L., Waite Jr., J. H., Moore, T. E., and Chappell, C. R.: The cleft ion fountain, J. Geophys. Res., 90, 9736–9748, 1985.
Lund, E. J., M¨obius, E., Carlson, C. W., Ergun R. E., Kistler, L. M., Klecker, B., Klumpar. D. M., McFadden, J. P., Popecki, M. A., Strangeway, R. J., and Tung, Y. K.: Transverse ion acceleration mechanism in the aurora at solar minimum: occurrence distribu-tions, J. Atmos. Terr. Phys., 62, 467–475, 2000.
Moore, T. E., Peterson, W. K., Russell, C. T., Chandler, M. O., Collier, M. R., Collin, H. L., Craven, P. D., Fitzenreiter, R., Giles, B. L., and Pollock, C. J.: Ionospheric mass ejection in response to a coronal mass ejection, Geophys. Res. Lett., 26, 2339–2342, 1999.
Paschmann, G., Quinn, J. M., Torbert, R. B., Vaith, H., et al.: The Electron Drift Instrument on Cluster: overview of first results, Ann. Geophys., 19, 1273–1288, 2001.
Peterson, W. K., Collin, H. L., Yau, A. W., and Lennartsson, O. W.: Polar/Toroidal Imaging Mass-Angle Spectrograph observations of suprathermal ion outflow during solar minimum conditions, J. Geophys. Res., 106, 6059–6066, 2001.
Peterson, W. K., Collin, H. L., Boehm, M., Yau, A. W., Cully, C., and Lu, G.: Investigation into the spatial and temporal coherence of ionospheric outflow on January 9-12, 1997, J. Atmos. Terr. Phys., 64, 1659–1666, 2002.
R`eme, H., Aoustin, C., Bosqued, J.-M., Dandouras, I., et al.: First multispacecraft ion measurements in and near the Earth’s mag-netosphere with the identical Cluster ion spectrometry (CIS) ex-periment, Ann. Geophys., 19, 1303–1354, 2001.
Ridley, A. J., Lu, G., Clauer, C. R., and Papitaschvili, V. O.: A statistical study of the ionospheric convection response to chang-ing interplanetary magnetic field conditions uschang-ing the assimila-tive mapping of ionospheric electrodynamics technique, J. Geo-phys. Res., 103, 4023–4039, 1998.
Ruohoniemi, J. M., and Greenwald, R. A.: Statistical patterns of high-latitude convection obtained from Goose Bay HF radar ob-servations, J. Geophys. Res., 101, 21 743–21 763, 1996. Shelley, E. G., Johnson, R. G., and Sharp, R. D.: Satellite
obser-vations of energetic heavy ions during a geomagnetic storm, J. Geophys. Res., 77, 6104–6110, 1972.
Strangeway, R. J., Russell, C. T., Carlson, C. W., McFadden, J. P., Ergun, R. E., Temerin, M., Klumpar, D. M., Peterson, W. K., and Moore, T. E.: Cusp field-aligned currents and ion outflows, J. Geophys. Res., 105, 21 129–21 142, 2000.
Thelin, B., Aparicio, B., and Lundin, R.: Observations of upflowing ionospheric ions in the mid-altitude cusp/cleft region with the Viking satellite, J. Geophys. Res., 95, 5931–5939, 1990. Tsyganenko, N. A.: Modelling the Earth’s magnetospheric
mag-netic field confined within a realistic magnetopause, J. Geophys. Res., 100, 5599–5612, 1995.
Weimer, D. R.: Models of high-latitude electric potentials derived with a last error fit of spherical harmonic coefficients, J. Geo-phys. Res., 100, 19 595–19 607, 1995.
Yau, A. W., E. G. Shelley, W. K. Peterson, and Lenchyshyn, L.: Energetic auroral and polar ion outflow at DE-1 altitudes : mag-nitude, composition, magnetic activity dependence and long term variations, J. Geophys. Res., 90, 8417–8432, 1985.
Yau, A. W., Peterson, W. K., and Shelley, E. G.: Quantitative parametrization of energetic ionospheric outflow, in modeling magnetospheric plasma, Geophys. Monogr. Ser., vol. 44, edited by Moore, T. E. and Waite Jr., J. H., AGU, Washington DC, 211, 1988.
Yau, A. W. and M. Andr´e: Sources of ion outflow, Space Sci. Rev., 80, 1–25, 1997.
Yeoman, T. K., Hanlon, P. G., and McWilliams, K. A.: A statisti-cal study of the location and motion of the HF radar cusp, Ann. Geophys., 20, 275–280, 2001.
![Fig. 3. Two-dimensional cuts in the V ⊥ -V // plane of oxygen velocity distributions in Log[cm −3 km −3 s 3 ] measured by C4 at 11:16:45 UT](https://thumb-eu.123doks.com/thumbv2/123doknet/2337503.33120/4.892.78.817.93.448/fig-dimensional-cuts-plane-oxygen-velocity-distributions-measured.webp)