HAL Id: hal-00163178
https://hal.archives-ouvertes.fr/hal-00163178
Submitted on 10 Feb 2021
HAL is a multi-disciplinary open access
archive for the deposit and dissemination of sci-entific research documents, whether they are pub-lished or not. The documents may come from teaching and research institutions in France or abroad, or from public or private research centers.
L’archive ouverte pluridisciplinaire HAL, est destinée au dépôt et à la diffusion de documents scientifiques de niveau recherche, publiés ou non, émanant des établissements d’enseignement et de recherche français ou étrangers, des laboratoires publics ou privés.
Time scales of upper ocean temperature variability
inferred from the PIRATA data (1997-2000)
Gabriel Clauzet, Ilana Wainer, Jacques Servain, Jacyra Soares
To cite this version:
Gabriel Clauzet, Ilana Wainer, Jacques Servain, Jacyra Soares. Time scales of upper ocean tempera-ture variability inferred from the PIRATA data (1997-2000). Geophysical Research Letters, American Geophysical Union, 2003, 20 (5), pp.13-1, 13-4. �10.1029/2002GL015147�. �hal-00163178�
Time scales of upper ocean temperature variability inferred from the
PIRATA data (1997–2000)
Ilana Wainer and Gabriel Clauzet
Department of Physical Oceanography, University of Sa˜o Paulo, Sa˜o Paulo, Brazil Jacques Servain
Centre IRD de Bretagne (UR 065), Plouzane´, France Jacyra Soares
Department of Atmospheric Sciences, University of Sa˜o Paulo, Sa˜o Paulo, Brazil Received 15 March 2002; accepted 14 August 2002; published 8 March 2003. [1] Time series from the PIRATA 10-minute measurements
are investigated in order to study the upper-ocean thermal field time-scales of variability using the serial covariance power spectra method and wavelet analysis. This is one of the few studies that analyze in time and space the PIRATA buoy data in the region. Analysis of the depth of the 20°C isotherm show distinct patterns for the northwestern Atlantic at 8N – 38W and the southeastern Atlantic, at 10S – 10W. In the west, warm surface waters are accompanied by a shallower thermocline while in the east warm surface waters are associated with its deepening, consistent with Houghton [1991]. At higher frequencies the dominant signals in sea surface temperature are the diurnal and semi-diurnal cycles. Spectral analysis of the depth of the 20°C isotherm show a predominance of the semi-diurnal period. In the eastern Atlantic there are two additional dominant bands in the spectra: 10 – 14 days, 25 – 27 days and for the depth of the 20°C isotherm there is also a lower frequency band at 20 – 40 days associated with tropical instability waves at the equator. The first band can be associated with atmospherically forced motions and the lower frequency band with barotropic instability waves. INDEX TERMS: 4572 Oceanography: Physical: Upper ocean processes; 4504 Oceanography: Physical: Air/sea interactions (0312); 4594 Oceanography: Physical: Instruments and techniques. Citation: Wainer, I., G. Clauzet, J. Servain, and J. Soares, Time scales of upper ocean temperature variability inferred from the PIRATA data (1997 – 2000), Geophys. Res. Lett., 30(5), 8004, doi:10.1029/2002GL015147, 2003.
1. Introduction
[2] The seasonal cycle is the largest atmosphere-ocean
signal in the tropical Atlantic. However, the interannual and longer-term variations are not negligible and they can be interpreted, at least in part, as modulations to the average annual cycle. Much of the early interest in tropical Atlantic variability was motivated by the enormous social and economic impacts that it has on the local populations in parts of South America and Africa.
[3] Sea surface temperature variability, for example, in
the tropical Atlantic has been known to occur as in Garzoli
and Giulivi [1987] and Colin and Garzoli [1988], primarily within four bands: a diurnal cycle associated with daytime warming and night time cooling, a 20 – 40 day band asso-ciated with tropical instability waves.
[4] Another aspect of the tropical Atlantic is that
super-imposed on the mean seasonal cycle are two modes of coupled atmosphere-ocean interannual variability. The first is characterized by a north-south interhemispheric gradient in SST, with associated changes in trade winds, which exerts considerable influence on the regional climate. These fluctuations display markedly large power on time scales of 8 – 16 years [e.g., Nobre and Shukla 1996]. The second is an equatorial mode of variability similar to ENSO. Although weak relative to the Pacific variability, the Atlantic equatorial SST anomalies affect rainfall in areas such as the Gulf of Guinea and Northeast Brazil. It is important to note that these two modes have been shown by Servain et al. [1999, 2000], to be dynamically connected.
[5] There has been considerable work showing
cross-scale interactions at the lower end of the spectrum, such as the phase locking between the ENSO cycle and the annual cycle and phase locking with tropical instability waves. However, cross-scale interaction with the high end of the spectrum has not been as explored. Understanding how high frequency mixed layer processes are modulated by, and in turn affect lower frequency seasonal and interannual varia-bility is crucial for developing correct parameterizations of these typically subresolution processes.
[6] In order to improve the understanding of these
ocean-atmosphere interaction processes in the tropical Atlantic, a program of moored measurements similar to the Tropical Atmosphere- Ocean (TAO) Array used to study ENSO variability in the equatorial Pacific was developed. The program, called PIRATA (Pilot Research Moored Array in the Tropical Atlantic) provides the time series measure-ments of upper ocean temperature used here. These same measurements are used in a companion paper Servain et al. [submitted] to evaluate the two modes of variability in the tropical Atlantic.
[7] This study uses 3 years of data from the PIRATA
moorings to evaluate the scales of variability in the upper-ocean thermal field. The motivation for this work, albeit with much less data given the short record length, was the study of Kessler et al. [1996] of the scales of variability in Copyright 2003 by the American Geophysical Union.
0094-8276/03/2002GL015147
the equatorial Pacific inferred from the TAO buoy array. This is an initial attempt to validate in the Tropical Atlantic Ocean the temperature data from similar buoy array with respect primarily to the seasonal cycle and higher frequen-cies and assess their importance in the evolution of SST anomalies at lower frequencies.
2. The PIRATA Data and Analysis
[8] The PIRATA program started late 1997 with the full
array in place by the year 2000. It consists of 12 Autono-mous Temperature Line Acquisition System (ATLAS)
moorings with one section along equator and two meri-dional mooring sections, one along 38W between 4N – 15N and the other along 10W between 10S – 2N. A more detailed description of the PIRATA array can be found in Servain et al. [1998].
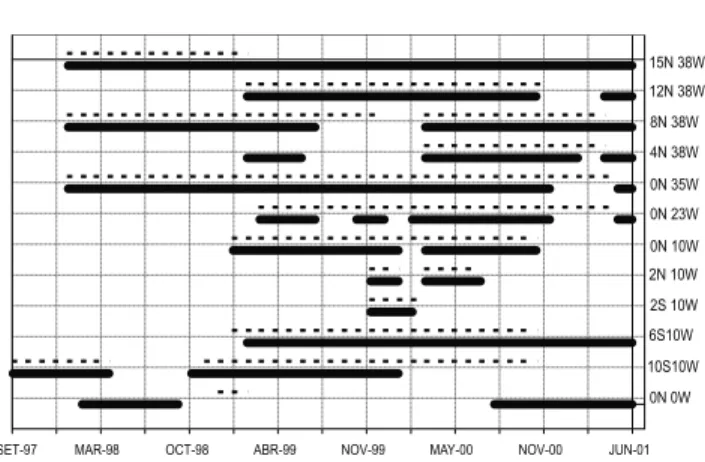
[9] This work uses upper ocean temperature and SST
data, sampled every 10 minutes by the PIRATA buoys. Time lines showing the time periods when temperature observations are available at each buoy (one zonal and two meridional) are given in Figure 1. The continuous lines indicate the availability of daily averaged data and the dashed ones the availability of the 10-minute resolution data. The time series present several data gaps with only 3 buoys having more than 24 months of data, 15N – 38W, 0N – 35W and 10S – 10W.
[10] To determine the time scales of variability in the
section time series of SST, spectral and wavelet analysis are used.
[11] Wavelet analysis is a relatively new technique that is
an important addition to standard signal analysis methods. Unlike Fourier analysis which yields an average amplitude and phase for each harmonic in a data set, the wavelet transform produces an ‘‘instantaneous’’ estimate or local value for the amplitude and phase of each harmonic. This allows detailed study of nonstationary spatial or time-dependent signal characteristics. In other words, the wavelet technique permits one to look at the resulting information in terms of time and frequency modes, decomposing the signals into localized oscillations. Furthermore, it also permits the characterization of the local regularity of sig-nals. A recent description of wavelets, and the specific Figure 1. Ocean temperature data available from the
PIRATA array. The continuous lines indicate the daily values and the dashed lines the 10-min resolution data.
Figure 2. Comparison between PIRATA-derived 10 minute resolution SST data (black line) and 10 minute Z20 (red line) for the available period at (a) 15N – 38W for (b) 12N – 38W, (c) 8N – 38W, (d) 0N – 35W, (e) 0N – 23W, (f ) 0N – 10W.
approach used in this investigation can be found in Torrence and Compo [1998].
3. Results
[12] The relationship between the depth of the 20°C
isotherm (hereafter referred to as Z20) and SST is a fundamental measure to understand how dynamical pro-cesses at the subsurface affect the surface (and vice-versa). In Figure 2 both high resolution measurements (every 10 minutes) of Z20 and SST are plotted for 6 of the the PIRATA buoys. It can be noted that for most of the sampled western Atlantic (at 38W, Figures 2a and 2b) there is a tendency to observe an increase (decrease) in SST accom-panied by the elevation (deepening) of Z20. This pattern changes at 10W (Figure 2f ). At 0N – 23W the behaviour of SST and Z20 is less clear, being out of phase in the first semester and then in phase for the remaining of the year as in Figure 2f (i.e. increase (decrease) of SST while Z20 deepens (elevates)). In this case, the warmer (colder) surface waters are associated with deeper (shallower) thermocline.
This in phase variation is associated with the heat-storage within the ocean surface layers and related convective overturning and is consistent with the works of Houghton [1991] and Weisberg [1987]. Houghton [1991] using SEQ-UAL/FOCAL and VOS XBTs data in the tropical Atlantic Ocean study the relationship between the SST and under-lying thermocline. They show that the in the western tropical Atlantic, SST and Z20 (proxy for thermocline depth) annual cycles are in phase which each other. In terms of the phase convention adopted in this work, this means that warm SST occurs with a shallow thermocline. They also point out that in the eastern Atlantic, the relation-ship of SST and Z20 is distinctly different. The amplitude of the annual harmonic of both SST and Z20 peak near the equator, but now the shallow thermocline lags the warmest SST by 3 – 4 months or equivalently leads the coldest SST by 2 – 3 months. For most of the tropical Atlantic a warm SST corresponds to a shallow thermocline or equivalently to a minimum in heat content. The results presented here also show that outside of the equatorial zone the thermocline proximity to the surface is not a sufficient indicator of its influence on the SST.
[13] Weisberg [1987] looked at the SST versus Z20
relationship at 0° 28°W and noted that the warmest SST occurred when the easterly wind stress was weakest, which corresponds to the interval over which the thermocline is shoaling. Thus SST and thermocline depth generally act in opposition to each other on the equator at 28°W. Vertically integrated temperature which is proportional to heat content, on the other hand, varies with the movement of the isotherms, so at this location vertically integrated heat content, on the other hand, varies with the movement of the isotherms, so at this location vertically integrated heat content is not a good proxy for SST.
[14] Furthermore, a comparison between the sea surface
temperature and the depth of the thermocline, observed on equator at 28°W and at 4°W durind the FOCAL/SEQUAL experiment, was done by Weisberg [1986], in relation with the large-scale features of the wind field observed at Saint Peter and Saint Paul Rocks.
[15] To quantify the time-scales of variability contained in
these time series, a power spectra and wavelet analysis are performed using the 10-minute resolution SST data. Because of the data gaps, common averaging is not available for all buoys. Therefore, the spectral analysis is performed here, for the buoys with the longest data record at three distinct locations: 8N – 38W; 0N – 35W and 0N – 10W.
[16] In all the investigated locations the diurnal (24h) and
semi diurnal (12h) cycles are the most energetic periods in the SST data. Besides the 12 and 24h peaks, there are other significant spectral bands at lower frequencies worth men-tioning. Of particular interest would be the 10 – 14 days band, shown by Parker [1973] to be associated with atmospherically forced motions. Periods around 20 days can be associated, in the ocean, with barotropic instability waves as previously mentioned by Colin and Garzoli [1988]. The complementary wavelet analysis (Figure 3) shows that the mentioned spectral periods tend to be dominant during July through October – November.
[17] For Z20 (not shown) a prominent signal occurs
around 12h (semi-diurnal) while the diurnal period (24h) is not evident in the spectral analysis. For periods greater Figure 3. SST wavelet spectra (frequency in cycles/hour,
as a function of period) at (a) 8N – 38W; (b) 0N – 35W and (c) 0N – 10W. The spectral periods discussed in the text tend to be dominant during July through October – November.
than that, there is a wide range of significant spectral bands. Of particular interest are the bands centered at about 7 days, 16 days and 30 days. The oscillations around days are forced by the atmosphere and can be associated with inertia-gravity waves. The 16 days band observed in the spectra could be atmospherically forced (where they are associated to Rossby waves) and are consistent with the findings of Garzoli and Giulivi [1987]. As in the case with SST, lower frequency bands at the equator is associated with tropical instability waves. Away from the equator, Rossby-Gravity waves are believed to play a more significant role in the variability around 30 days.Higher frequency phenomena such as instability waves and inertia-gravity waves were documented and interpreted in terms of wind-forcing and/or instabilities of the zonal current system (Weisberg [1984]; Garzoli and Giulivi [1987]).
[18] The complementary wavelet analysis (not shown) for
Z20, shows that the occurrence of these spectral bands at 8N – 38W is stronger during the months of July and Febru-ary. Comparison with the SST variability (i.e. Figure 3) shows the out-of-phase relationship with a lag of about 5 – 6 months. This interval was also noted by Vauclair and du Penhoat [2001] for the SST and Z20 relationship using the independent TAOSTA data set. In general, Z20 variability as shown by the wavelet analysis does not reveal any preferred time of the year, being equally distributed in time.
4. Conclusions
[19] In this work, the in situ ocean temperature
meas-urements obtained with the PIRATA system, are described and analyzed. Both spatial and temporal variability are addressed.
[20] Power spectra and wavelet analysis were performed
using the 10 minute resolution SST data. Because of the data gaps, a common averaging period was not available for all buoys so the spectral analysis was done for the buoys with the longest data record at three distinct locations: 8N – 38W; 0N – 35W and 0N – 10W for SST and Z20. Results show that maximum amplitudes are observed primarily for the diurnal and semi-diurnal periods for SST and only for the semi-diurnal period for Z20. It is believed that this effect occurs possibly due to the effect of internal waves of tidal periods, which could be a source of error. This idea is currently being investigated in the light of earlier work by Defant [1950].
[21] Wavelet analysis confirms the power density
spec-trum found and show that they are more prominent during Northern Hemisphere from July to October – November. For
Z20, wavelet analysis showed no preferred time of the year, being the variability equally distributed.
[22] Acknowledgments. This work was supported in part by grants FAPESP-98/13397-4, FAPESP-00/02958-7, 300223/93-5, CNPq-IRD: 910072/00-0 and CNPq-300040/94-6. The authors thank PMEL/ NOAA for making the high frequency PIRATA data readily available. References
Colin, C., and S. Garzoli, High-frequency variability of in situ wind, tem-perature and current measurements in the equatorial atlantic during the focal-sequal experiment, Oceanologica Acta, 11, 139 – 148, 1988. Defant, A., Reality and illusion in oceanographic surveys, J. Marine Res.,
9, 120 – 138, 1950.
Garzoli, S. L., and C. Giulivi, Forced oscillations on the equatorial Atlantic basin during the Seasonal Equatorial Response of the Equatorial Atlantic Program (1983 – 1984), J. Geophys. Res., 92, 5089 – 5100, 1987. Houghton, R. W., The relationship of sst to thermocline depth at annual and
interanual time scales in the tropical atlantic ocean, J. Geophys. Res., 96, 15,173 – 15,185, 1991.
Kessler, W., M. Spillane, M. McPhaden, and D. Harrison, Scales of varia-bility in the equatorial pacific inferred from the tropical atmosphere-ocean (tao) buoy array, J. Clim., 9, 2999 – 3024, 1996.
Nobre, P., and J. Shukla, Variations of sea surface temperature, wind stress and rainfall over the tropical atlantic and south america, J. Clim., 9, 906 – 927, 1996.
Parker, D. E., On the variance spectra and spatial coherences of equatorial winds, Q. J. R. Meteorol. Soc., 99, 48 – 55, 1973.
Servain, J., A. J. Busalacchi, M. J. McPhaden, A. D. Moura, Reverdin, M. Vianna, and S. E. Zebiak, A pilot research moored array in the tropical atlantic (pirata), Bull. Am. Meteorol. Soc., 79, 2019 – 2031, 1998.
Servain, J., I. Wainer, H. Ayina, and H. Roquet, The relationship between the simulated climatic variability modes of tropical atlantic, Geophys. Res. Lett., 485 – 488, 1999.
Servain, J., I. Wainer, A. Dessier, and J. McCreary, Relatioship between el nio-like and dipole-like modes of climatic variability in the tropical atlan-tic, Int. J. Climatol., 20, 939 – 953, 2000.
Servain, J., G. Clauzet, and I. Wainer, Tropical atlantic climate variability modes as observed by pirata, Geophys. Res. Lett., submitted.
Torrence, C., and M. P. Compo, A pratical guide to wavelet analysis, Bull. Am. Meteorol. Soc., 79, 61 – 78, 1998.
Vauclair, F., and Y. du Penhoat, Interannual variability of upper layer of the Tropical Atlantic ocean from in-situ data from 1979 – 1999, Clim. Dyn., 17, 527 – 546, 2001.
Weisberg, R., Sequal focal - 1st year results on the circulation of the equatorial atlantic, Geophys. Res. Lett., 11, 713 – 714, 1984.
Weisberg, R. H., Velocity and temperature obsrvations during sequal at 3-degrees, 28-degrees-w, J. Geophys. Res., 92, 5061 – 5075, 1987. Weisberg, R. H. C. C., Equatorial atlantic ocean temperature and current
variations during 1983 – 1984, Nature, 322, 240 – 243, 1986.
I. Wainer and G. Clauzet, Department of Physical Oceanography, University of Sa˜o Paulo, Prac¸a do Oceanogra´fico 191, Sa˜o Paulo, SP, 05508-900 Brazil. ([email protected])
J. Servain, Centre IRD de Bretagne, BP 70, 29280, Plouzane´, France. ([email protected])
J. Soares, Department of Atmospheric Sciences, University of Sa˜o Paulo, Rua do Mata˜o 1226, Sa˜o Paulo, SP, 05508-900 Brazil. ( [email protected])