HAL Id: hal-00315747
https://hal.archives-ouvertes.fr/hal-00315747
Submitted on 2 Feb 2010HAL is a multi-disciplinary open access
archive for the deposit and dissemination of sci-entific research documents, whether they are pub-lished or not. The documents may come from
L’archive ouverte pluridisciplinaire HAL, est destinée au dépôt et à la diffusion de documents scientifiques de niveau recherche, publiés ou non, émanant des établissements d’enseignement et de
Magnetic Nanorods Confined in a Lamellar Lyotropic
Phase
Keevin Béneut, Doru Constantin, Patrick Davidson, Arnaud
Dessombz, Corinne Chanéac
To cite this version:
Keevin Béneut, Doru Constantin, Patrick Davidson, Arnaud Dessombz, Corinne Chanéac. Magnetic Nanorods Confined in a Lamellar Lyotropic Phase. Langmuir, Ameri-can Chemical Society, 2008, 24 (15), pp.8205-8209. �10.1021/la800387a�. �hal-00315747�
Magnetic nanorods confined in a lamellar
lyotropic phase
Keevin B´eneut, Doru Constantin
∗,
Patrick Davidson and Arnaud Dessombz
Laboratoire de Physique des Solides, Univ. Paris-Sud,
CNRS, UMR 8502, F-91405 Orsay Cedex, France.
Corinne Chan´eac
Laboratoire de Chimie de la Mati`ere Condens´ee, Univ. Paris VI,
CNRS, UMR 7574, F-75252, Paris Cedex 05, France.
May 7, 2008
Abstract
The dilute lamellar phase of the nonionic surfactant C12EO5was doped with goethite (iron oxide) nanorods up to a fraction of 5 vol%. The interaction between the inclusions and the host phase was studied by polarized optical microscopy (with or without an applied magnetic field) and by small-angle x-ray scattering. We find that when the orientation of the nanorods is modified using the magnetic field, the texture of the lamellar phase changes accordingly; one can thus induce a homeotropic–planar reorientation transition. On the other hand, the lamellar phase induces an attractive interaction between the nanorods. In more concentrated lamellar phases (under stronger confinement) the particles form aggregates. This behaviour is not encountered for a similar system doped with spherical particles, emphasizing the role of particle shape in the interaction between doping particles and the host phase.
1
Introduction
In recent years, the field of soft matter physics has witnessed a surge of activ-ity in the area of hybrid organic–inorganic materials.1 This sustained interest
was of course motivated by the manifold applications of these systems,2 and
also by novel fundamental issues related to the interaction between the two components. In many cases, the materials are obtained by dispersing solid nanoparticles in a “soft” continuous matrix, formed by surfactants, polymers, emulsions etc. By a careful choice of the components, one tries to combine the specific properties of the particles (catalytic, optical, magnetic etc.) and the processability of the host phase.
Obviously, such dispersions also represent a new field among soft matter systems; its novelty with respect to the “classical” colloidal solutions resides in the complexity of the matrix. Beyond the theoretical interest of this study there is a very practical one: for what parameter values (particle size and shape, structure and elastic moduli of the matrix etc.) is the dispersion sta-ble? Can the confinement imposed by the host phase lead to ordering of the inclusions? What are the ensuing applications? None of these questions can be answered without a thorough understanding of the interaction between the host phase and the inclusions.
In the case of nanoparticles dispersed in a liquid crystalline matrix, one should naturally consider the effect of the elastic and anisotropic medium on the interparticle potential. For lamellar phases, the effect of smectic elasticity was modeled in detail,3–5 but the experimental studies are still
unsubstan-tial. Conversely, the inclusions can change the interaction potential between membranes, and thus its repeat distance6 and elastic moduli.7 Clearly, in a
composite system one must study:
• The influence of the confinement (due to the host phase) on the inclu-sions.
• The changes induced by the particles in the structure of the matrix. Both these aspects are illustrated in a system that we formulated recently: the host lamellar phase is the C12E5/hexanol/water system, with C12E5 the
nonionic surfactant penta(ethylene glycol) monododecyl ether, and the inclu-sions are iron oxide nanorods (goethite) with complex magnetic properties.8
We demonstrate the attractive interaction between the particles induced by the lamellar matrix and show that, when the confinement becomes too strong
(i.e. the lamellar repeat distance is too small) the particles aggregate, even when their concentration is very low. On the other hand, we show the action of the inclusions on the texture of the lamellar phase: when the nanorods are oriented using an applied magnetic field, the bilayers ‘follow’ and (at high field) they align perpendicular to the field. Perfect planar monodomains can thus be obtained, and the alignment persists after removal of the field. The magnetic field has no effect on the pure lamellar phase (without inclusions). Lamellar lyotropic phases doped with small and spherical magnetic par-ticles have already been formulated9,10 and their structural7,11 and
mag-netic12,13 properties were studied in detail long ago. In contrast, our study
deals with large, anisotropic particles and with their interaction due to the confinement in the lamellar phase. It is also noteworthy that gold nanorods can be confined in lamellar phases of block copolymers, as reported recently.14
This hybrid system appears promising for the preparation of surface lay-ers of magnetic nanoparticles with well-defined spacing and orientation (con-trolled by the host-induced interaction), with applications, for instance, in high-density storage media.15,16 The viscoelastic properties of the lamellar
phase are also interesting in view of fine-tuning the deposition process (e.g., by spin-coating).
2
Experimental
Goethite (α − FeOOH) is an iron oxyhydroxide, widely used as a pigment. The nanorods were synthesized according to well-established protocols.17,18
Their dimensions are of the order of 150 × 25 × 10 nm3 (length × width
× height).19 The surface of the particles is hydroxylated, with a surface
charge of 0.2 C m−2 at pH = 3 and with an isoelectric point corresponding to
pH = 9; see19 for more details. Bulk goethite is antiferromagnetic,20 but the
nanorods bear a permanent magnetic dipole µ ∼ 1200 µB along their long
axis, probably due to uncompensated surface dipoles (µB = 9.274 10−24J/T
is the Bohr magneton). Furthermore, the easy magnetization axis is perpen-dicular to this direction so that, at high applied fields, the induced magnetic moment overtakes the permanent one and the orientation of the rods switches from parallel to perpendicular to the field at a critical value B ∼ 250 mT.
The surfactant, C12EO5, was acquired from Nikko and the hexanol from
Fluka; they were used without further purification. The phase diagram of the C12EO5/H2O mixture was determined more than 20 years ago.21 Ever
since, it was extensively studied due to the presence of several mesophases, and especially of a lamellar phase that can be swollen up to a few percent of membrane fraction. This dilute lamellar phase appears at fairly high temperature, but it was shown that it can be brought down to room tem-perature by the addition of a co-surfactant such as hexanol.22,23 We used a
hexanol/C12EO5ratio of 0.35 by weight, corresponding to a molar ratio of 1.3
(hexanol molecules for each surfactant molecule). The temperature domain of the lamellar phase changes with dilution, but it extended at least between 17 and 32◦C for all our samples. The membrane thickness is δ ≈ 2.9 nm.22
Silica particles with a nominal diameter of 27 nm were obtained from Sigma-Aldrich as concentrated colloidal suspensions (Ludox TMA 34) in deionized water (34 wt.%). We found a pH of 7 for the initial suspension.
Concentrated stock solutions of C12EO5/hexanol/H2O were mixed with
colloidal suspensions (of goethite or silica) and deionized water to yield the desired volume fractions of membranes and doping particles. The samples were contained in flat glass capillaries, 50-100 µm thick (Vitrocom) and aligned in homeotropic anchoring (by thermal annealing).
The magnetic field was applied using a home-made setup based on per-manent magnets with a variable gap. Fields of up to 0.9 T can be achieved. For polarized microscopy observation we used an Olympus BX51 microscope with a rotating stage and long working distance objectives (with a 5× or 10× magnification.)
Small angle x-ray scattering (SAXS) experiments were performed at the ID02 station of the European Synchrotron Radiation Facility synchrotron in Grenoble, France. The incident beam had a wavelength λ = 0.0995 nm, and the sample–detector distance was 5 m. The scattered x-rays were detected with a specially developed CCD camera. A detailed description of the ex-perimental setup can be found in reference.24 The q range over which the
data could be reliably collected was 0.018 < q < 0.6 nm−1. The flat faces of
the capillaries were set perpendicular to the x-ray beam.
3
Results and Discussion
3.1
Phase diagram of the doped system
The first step of the study was determining the phase diagram of the sys-tem, more specifically the range of confinement (controlled by the membrane
volume fraction) for which the particles can be added to the phase without demixing and their maximum concentration. We started by preparing mix-tures with a volume fraction of goethite φg = 0.5, 1, 1.5 and 2 % and a
membrane volume fraction φm = 4.4, 7.2, 10.2 and 14.4 %. φg is defined as
the ratio between the volume of goethite particles and the total volume. φm
is the sum of the hexanol and surfactant volumes divided by the total volume (we assume that mixing volumes are negligible). The particles remained well dispersed in the dilute lamellar phase (φm = 4.4 and 7.2 vol. %) for all values
of φg investigated. In the concentrated phases, on the other hand, particle
aggregation was discernable after a few hours and was very clear after a few days, even at the lowest particle concentration (see Figure 1). We then pre-pared samples with φm = 7.2 vol. % and φg up to 5 vol. %. All these samples
have been stable for months.25
Figure 1: Lamellar phase doped with a goethite concentration φg = 0.5 %, for a membrane concentration φm = 7.2 % (a) and 10.2 % (b), two weeks after prepa-ration. Left: in natural light. Right: between crossed polarizers. Aggregation of the nanorods is observed in the more confined system (b).
We conclude that a significant amount of goethite can be dispersed in the lamellar phase as long as the membrane fraction remains below a threshold in the interval 7.2 < φm < 10.2 vol %, corresponding to a lamellar repeat
phase (towards the sponge phase) exhibits no significant variation as a func-tion of the doping fracfunc-tion φg. The mixing of the nanorods and the lamellar
phase presumably leads to an energy gain owing to the formation of hydro-gen bonds between the hydrated surface of the particles and the surfactant heads.26
At this point, we have no convincing explanation for the threshold value of the repeat distance. The most plausible connection is that, as the lamellar phase becomes more concentrated, its elastic moduli increase and so does the interaction between particles,3 to the point of inducing aggregation.
It should also be noted that the threshold value is of the order of the par-ticle width. An alternative explanation would therefore be that aggregation occurs when rotation about the long axis of the particles is hindered (and the particle loses a degree of freedom). It is however not clear whether this explanation is compatible with a strong interaction between the particles and the surfactant heads.
3.2
Magnetic field effect
Magnetic field measurements were performed on flat glass capillaries, 50 µm thick and 1 mm wide. The field was applied in the plane of the capillary, perpendicular to its long axis.
We started by applying an increasing field (from 0 to about 0.8 T) to a sample oriented in very good homeotropic anchoring (obtained by annealing overnight close to the transition temperature to the sponge phase). The membrane volume fraction was φm = 7.2 % and the goethite volume fraction
φg = 1.5 %. A few very thin oily streaks persisted. The succession of
images is shown in Figure 2. At low field, the transmitted intensity increased with the field up to about 0.15 T (nanorods aligned along the field); it then decreased to 0 at 0.25 T and increased again at higher field, as the rods aligned perpendicular to the field. Starting from the initial homeotropic anchoring, above 0.3 T the existing oily streaks became more pronounced and new ones nucleated; the texture gradually switched to planar anchoring, with the smectic director along the field. This crossover corresponds to the value at which the particle orientation changes from parallel to perpendicular to the field in aqueous solution.8
Consequently, we infer that, as the particles turn, the lamellae follow, presumably due to the strong association between the goethite nanorods and the surfactant heads.
Figure 2: A magnetic field was applied across a capillary of lamellar phase (mem-brane volume fraction 7.2 vol. %) doped with 1.5 vol. % nanorods. The field was increased from 0 to about 0.8 T (the field direction is shown in the first image and its values are given below each image). The images are taken between crossed polarizers parallel to the sides of the image.
Figure 3: Two-domain area in a sample with φm= 4.4 % and φg = 1 %. a) Under strong field (834 mT), in natural light (left) and between crossed polarizers parallel to the sides of the image (right). b) By rotating the sample, total extinction is obtained for each of the domains. c) After field removal, the planar orientation persisted.
3. The field was applied overnight; during this time, the sample was kept at a temperature about 1◦C below the transition temperature to the sponge
phase, in an oven. The temperature was then slowly decreased to its ambient value. Figure 3a shows the sample, in natural light and between crossed polarizers, under high field. It contains two domains separated by a wall. By rotating the sample between the polarizers (which remain parallel to the the sides of the photo) each domain can be extinguished (Fig. 3b). The disorientation between the domains can thus be estimated at 3.6◦.
The field was then progressively decreased (in steps of 0.1 T every 10 minutes). Some focal conic textures developed during the process, but they annealed after a couple of hours. The resulting texture at zero field is shown in Fig. 3c; it was stable for days.
The effect of the magnetic field is similar to that observed in ferrosmectic phases obtained by doping dilute lamellar phases with small ferromagnetic particles.9,12 Indeed, these authors also observe a reorientation transition,
signaled by the appearance of focal conic defects in homeotropic samples un-der the influence of a magnetic field applied along their director axis (normal to the layers). However, in their system the layers tend to align along the field, while in our case they prefer to be perpendicular to it above the critical value.
3.3
Interaction induced by the lamellar phase
We used x-ray scattering to study the interaction between colloidal particles in the lamellar phase and in solution. It is well-known27 that the intensity
scattered by a collection of identical particles can usually be written as the product I(q) = |F (q)|2 × S(q) of a form factor, |F (q)|2, dependent only on
the size and shape of the individual particle, and a structure factor S(q) quantifying the interactions between particles (S(q) = 1 in the absence of interactions).
As form factor we used the intensity scattered by a very dilute dispersion (φg = 0.066%) in the lamellar phase at the same membrane concentration
as for the curves shown in Figure 4, namely φm = 7.2%. After background
subtraction, the scattering curves for (Lα+ goethite) systems presented in
the following were divided by this signal and normalized to one at large q vectors.
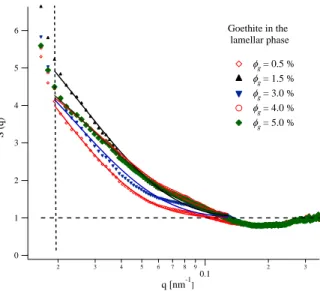
The first observation is that all structure factors shown in Figure 4 exhibit a marked increase at small angles (below 0.1 nm−1), clear sign of a strong
6 5 4 3 2 1 0 S (q) 2 3 4 5 6 7 8 9 0.1 2 3 q [nm-1] Goethite in the lamellar phase fg= 0.5 % fg= 1.5 % fg= 3.0 % fg= 4.0 % fg= 5.0 %
Figure 4: Structure factors for goethite particles dispersed in the lamellar Lα phase. The membrane volume fraction is φm = 7.2% and the volume fraction of goethite φg is indicated for each curve. The vertical dashed line q = 0.018 nm−1 is the limit below which the data exhibits marked uncertainty (due mainly to background subtraction). Solid lines are exponential fits (see text).
attractive interaction. A quick estimate of the interaction range ξ can be obtained by fitting the data to an exponential decrease:
S(q) = 1 + A exp(−qξ) , (1) yielding 30 nm < ξ < 50 nm. The attractive range is similar to both the width of the nanorods and the lamellar repeat distance. A more detailed study for different dilutions of the lamellar phase is needed to assess the nature of the interaction. The most interesting feature of this interaction is that it only appears under confinement (in the lamellar phase), and for anisotropic particles, as discussed below.
As a reference system, we studied water dispersions of goethite particles at similar concentrations, see Figure 5. The form factor used was obtained from a very dilute aqueous solution, φg = 0.066%. At lower particle concentrations
the structure factor is negligible; at φg = 7.3% a typical shape for hard-core
systems, with a well-defined peak and an oscillation at higher q starts to appear, but its amplitude is moderate and the shape very different from that measured in the lamellar phase. We conclude that the effects described above (Fig. 4) are due to the presence of the confining lamellar phase.
The X-ray scattering data for the doped lamellar phases indicate that the lamellar phase induces an attractive interaction between the goethite nanorods. In order to assess the effect of shape we studied the same lamellar phase doped with a comparable concentration of silica beads, a system al-ready described in the literature.28 The membrane fraction was φ
m = 7 vol%
and the volume fraction of beads was φs= 0.5, 1, 2 and 3 vol%. The samples
were stable and homogeneous for months, although in reference,28 the doped
phase was found to be stable only for volume fractions up to φs= 0.8 vol%.
This discrepancy might be related to the difference in the presentation of the silica beads: they used Ludox TM solutions, at pH 9 and with relatively high salt concentrations.
Homeotropic doped samples were studied using the same procedure as for the goethite-containing phases. The resulting structure factors are shown in Figure 6. The scattering intensity I(q) for the dilute sample (φs = 0.5 vol%)
was used as form factor; it is well described by a polydisperse sphere model, with a radius R ∼ 13 nm and polydispersity p = σ/R ∼ 0.1. Similar values are obtained for the aqueous dispersions using an in-house rotating anode setup (data not shown).
The first observation is that for the silica beads dispersed in the lamellar phase the structure factors only exhibits a slight increase at small angles.
1.2 1.0 0.8 0.6 0.4 0.2 0.0 S (q) 2 3 4 5 6 7 8 9 0.1 2 3 q [nm-1]
Aqueous goethite solutions
fg= 2.0 wt %
fg= 4.0 wt %
fg= 7.3 wt %
Figure 5: Structure factors for water dispersions of goethite particles. The volume fraction of goethite φg is indicated for each curve. The vertical dashed line q = 0.018 nm−1 is the limit below which the data exhibits marked uncertainty (due mainly to background subtraction).
1.4 1.2 1.0 0.8 0.6 0.4 S (q) 0.35 0.30 0.25 0.20 0.15 0.10 0.05 q [nm-1] Silica spheres in lamellar phase fs = 1 vol % fs = 2 vol % fs = 3 vol %
Figure 6: Structure factors for silica spheres dispersed in the lamellar phase. The volume fraction of silica particles φs is indicated for each curve. The data for φs = 2 and 3 vol% is fitted with a Percus-Yevick hard sphere model with an interaction radius of 19 nm.
If present, the induced attraction is thus much weaker for spheres than for rods. For wave vectors q > 0.06 nm−1, the structure factors for φ
s = 2 and
3 vol% are well described by a three-dimensional hard sphere interaction (in the Percus-Yevick approximation29,30) with an effective hard-core radius of
19 nm, see Figure 6. In conclusion, the presence of the lamellar phase has no discernible effect on the interaction between silica spheres. Rigorously speaking, for spheres confined between rigid planes a two-dimensional (hard-disk) interaction would be a more adequate description. We performed such an analysis using the analytical form for the structure factor given by Y. Rosenfeld31 and obtain similar results, with a hard disk radius of 17 nm.
More concentrated systems would be needed to discriminate between the 2D and 3D cases.
4
Conclusion
In conclusion, we formulated a nonionic lamellar phase doped with large mag-netic nanorods (in comparison with the interlayer distance). The inclusions experience an attractive interaction under confinement, a feature absent in simple aqueous solutions of similar concentration or in systems of confined silica spheres. Under even higher confinement (membrane concentration), the nanorods aggregate. The interaction between the particles and the host phase is also apparent in the orienting effect of the inclusions on the lamellar phase.
Acknowledgements
P. Panine, E. Belamie and A. Poulos are acknowledged for helping with the synchrotron experiments.
References
1. Sanchez, C.; Soler-Illia, G.; Ribot, F.; Lalot, T.; Mayer, C. R.; Cabuil, V. Chem. Mater. 2001, 13, 3061–3083.
2. MacLachlan, M. J.; Manners, I.; Ozin, G. A. Adv. Mater. 2000, 12, 675–681. 3. Turner, M. S.; Sens, P. Phys. Rev. E 1997, 55, 1275–1278.
4. Sens, P.; Turner, M. S. Eur. Phys. J. E 2001, 4, 115–120.
5. Evans, A. R.; Turner, M. S.; Sens, P. Phys. Rev. E 2003, 67, 041907.
6. Taulier, N.; Nicot, C.; Waks, M.; Hodges, R. S.; Ober, R.; Urbach, W. Biophys. J. 2000, 78, 857–865.
7. Ponsinet, V.; Fabre, P. J. Phys. II (France) 1996, 6, 955–960.
8. Lemaire, B. J.; Davidson, P.; Ferr´e, J.; Jamet, J. P.; Panine, P.; Dozov, I.; Jolivet, J. P. Phys. Rev. Lett. 2002, 88, 125507.
9. Fabre, P.; Casagrande, C.; Veyssi´e, M.; Cabuil, V.; Massart, R. Phys. Rev. Lett. 1990, 64, 539–542.
10. Dabadie, J. C.; Fabre, P.; Veyssi´e, M.; Cabuil, V.; Massart, R. J. Phys. Cond. Matt. 1990, 2, SA291–SA294.
11. Ramos, L.; Fabre, P.; Dubois, E. J. Phys. Chem. 1996, 100, 4533–4537. 12. Ponsinet, V.; Fabre, P.; Veyssi´e, M. Europhys. Lett. 1995, 30, 277–282. 13. Spoliansky, D.; Ponsinet, V.; Ferr´e, J.; Jamet, J.-P. Eur. Phys. J. E 2000, 1,
227–235.
14. Deshmukh, R. D.; Liu, Y.; Composto, R. J. Nano Lett. 2007, 7, 3662–3668. 15. Gider, S.; Shi, J.; Awschalom, D. D.; Hopkins, P. F.; Campman, K. L.;
Gos-sard, A. C.; Kent, A. D.; von Moln´ar, S. Appl. Phys. Lett. 1996, 69, 3269–3271. 16. Sun, S.; Anders, S.; Hamann, H. F.; Thiele, J.-U.; Baglin, J. E. E.; Thom-son, T.; Fullerton, E. E.; Murray, C. B.; Terris, B. D. J. Am. Chem. Soc. 2002, 124, 2884–2885.
17. Atkinson, R. J.; Posner, A. M.; Quirk, J. P. J. Phys. Chem. 1967, 71, 550–558. 18. Jolivet, J.-P.; Chan´eac, C.; Tronc, E. Chem. Commun. 2004, 481–487.
19. Lemaire, B. J.; Davidson, P.; Ferr´e, J.; Jamet, J. P.; Petermann, D.; Panine, P.; Dozov, I.; Jolivet, J. P. Eur. Phys. J. E 2004, 13, 291–308.
20. Coey, J. M. D.; Barry, A.; Brotto, J.; Rakoto, H.; Brennan, S.; Mussel, W. N.; Collomb, A.; Fruchart, D. J. Phys. Cond. Matt. 1995, 7, 759–768.
21. Mitchell, D. J.; Tiddy, G. J.; Waring, L.; Bostock, T.; McDonald, M. P. J. Chem. Soc. Faraday Trans. I 1983, 79, 975–1000.
22. Freyssingeas, E.; Nallet, F.; Roux, D. Langmuir 1996, 12, 6028–6035. 23. Freyssingeas, E.; Roux, D.; Nallet, F. J. Phys. II (France) 1997, 7, 913–929. 24. Narayanan, T.; Diat, O.; Bosecke, P. Nucl. Instrum. Methods Phys. Res. A
2001, 467, 1005–1009.
25. No change is visible in horizontally stored sealed capillaries. In vertically stored vials and capillaries, on the other hand, a concentration gradient appears, with a higher goethite concentration at the bottom. After briefly vortexing the vials, the solutions are again homogeneous, with no sign of aggregation.
26. Frost, R.; Zhu, H. Y.; Wu, P.; Bostrom, T. Materials Letters 2005, 59, 2238– 2241.
27. Chaikin, P. M.; Lubensky, T. C. Principles of Condensed Matter Physics; Cambridge University Press, 1995.
28. Salamat, G.; Kaler, E. W. Langmuir 1999, 15, 5415–5421. 29. Wertheim, M. S. Phys. Rev. Lett. 1963, 10, 321–323. 30. Thiele, E. J. Chem. Phys. 1963, 39, 474–479.
For Table of Contents Use Only
Magnetic nanorods confined in a lamellar lyotropic phase, by Keevin B´eneut, Doru Constantin, Patrick Davidson, Arnaud Dessombz, and