HAL Id: hal-00585093
https://hal.archives-ouvertes.fr/hal-00585093
Submitted on 11 Apr 2011HAL is a multi-disciplinary open access archive for the deposit and dissemination of sci-entific research documents, whether they are pub-lished or not. The documents may come from teaching and research institutions in France or abroad, or from public or private research centers.
L’archive ouverte pluridisciplinaire HAL, est destinée au dépôt et à la diffusion de documents scientifiques de niveau recherche, publiés ou non, émanant des établissements d’enseignement et de recherche français ou étrangers, des laboratoires publics ou privés.
FOR CHOOSING A COMIC
Ines Jomaa, Catherine da Cunha, Emilie Poirson, Jean-François Petiot
To cite this version:
Ines Jomaa, Catherine da Cunha, Emilie Poirson, Jean-François Petiot. PREFERENCE BASED SYSTEM: AN ASSISTANCE FOR CHOOSING A COMIC. AipPrimeca, Mar 2011, Mont Dore, France. pp.9. �hal-00585093�
PREFERENCE BASED SYSTEM:
AN ASSISTANCE FOR CHOOSING A COMIC
Inès Jomaa, Catherine Da Cunha, Emilie Poirson, Jean-François Petiot Institut de Recherche en Communications et Cybernétique de Nantes, Ecole Centrale Nantes
Abstract:
This paper presents a contribution to design an online preference based system. The objective of the system is to assist a customer in the products selection process. The product considered here to describe the application is the comic. Current e-commerce recommendation systems assist customers in this process. Nevertheless, quality of the recommendations produced remains a real challenge. There are products that are not recommended to customers though they would appreciate them and others recommended to them though they do not appreciate them. Quality and relevance of recommendations is addressed in this paper. The customer’s choice is not only based on product characteristics but also on his/her perceptive expectations. Therefore, products
recommendations are considered relevant since they meet customer’s expectations and particularly perceptive ones. The suggested algorithm aims to recommend spontaneously comics to an active customer. It is mainly based on collaborative filtering and neighbourhood formation. Cluster of neighbours is formed. Neighbours share common perceptive preferences with the active customer. Favourite comics of the neighbours may interest the latter. Selection of the appropriate comics is based on the product characteristics expected by the active customer. The algorithm produces relevant comics which meet the active customer’s expectations and particularly perceptive ones.
Keywords: Recommender Systems, Collaborative Filtering, Emotions, Semantics, Preference
1 Introduction
Appeared in the mid 1990s, recommender systems are used by electronic commerce websites. These websites offer a huge number of products and services for sale, therefore choosing the right product is not an easy task for a website visitor. Recommender systems have emerged in order to help people to choose products or services that best meet their needs and preferences. These systems are based on a variety of filtering techniques such as collaborative [1], [2], content-based [3],[4], demographic filtering [5], [6] and other techniques [7], [8].
To recommend products to an active customer, most of recommendation algorithms focus on finding similar customers from similar products they purchased or rated. In fact, collaborative filtering [9], [10] is one of the earliest and most promising recommender technique, it makes recommendations by matching people with the same interest. It predicts products a customer would like, based on the opinions (evaluations or ratings) of other people for these products. In order to identify people who share the same interests, similarity between customers could be calculated by determining the proximity between them. The predicted score attributed by the active customer to unseen products is determined using the evaluation scores of his/her neighborhood.
Collaborative filtering offers to customer the possibility to discover other various domains. In fact, diversity and novelty characterize the recommendations produced. Collaborative filtering also works
several limitations such as the “Sparsity problem” [11], [8], the “Gray sheep” [11] and the “quality of recommendations for the users” [12]. Indeed, sparsity problem occurs when there are not enough common products rated by customers. For example, if the number of customers is small relative to the large number of products, the matrices containing the customers’ ratings of products could be sparse, thus it is hard to find correlations between customers and consequently to find neighborhoods. “Gray sheep” problem occurs in a small community of customers, when there are customers having no close neighbors and whose ratings don't match any group. Consequently, they get poor recommendations.
Collaborative filtering challenge addressed in this paper is the quality of recommendations. In fact, there are products that are not recommended to one customer though he/she would appreciate them and others recommended to him/her though he/she does not appreciate them [12]. Thus, recommendations produced are not always relevant. For example, let’s imagine that Paul and Edouard like detective stories; but their choice of liking cookery books are different as Paul like them but Edouard don’t. Collaborative filtering could recommend cookery books to Edouard, even though these recommendations are not relevant for him.
The problem of relevance of recommendations produced by collaborative filtering algorithm is particularly addressed in this paper. In fact, the aim is to propose one possible extension of collaborative filtering based on emotional, sensory and semantic product characteristics. Our suggested algorithm includes an improvement of understanding perceptive customer needs and can improve the finding products of potential interest. The product chosen within the framework of our project is the comic. In fact, the comic market is growing and attendances various festivals devoted to comics are very important.
The paper is organized as follows. In Section 2, we present the process of determination of the comic’s characteristics named comic’s attributes. Section 3 describes the system framework. Finally, in Section 4, we present the algorithm that will be implemented.
2 Determination process of the product attributes
Two categories of product attributes are considered here: objective and perceptive attributes. Characteristics of the product that are independent of the user and that will be used to define the product sheet are called Objective attributes (e.g. number of pages, author, …). Perceptive attributes are divided into two categories: emotional category and sensory and semantic category. We name
emotional attributes those related to the affective state of the user, pleasure and displeasure. Sensory
and semantic attributes are all subjective attributes that don’t belong to the emotional category. 2.1 Determination of objective attributes
Objective attributes will be used to define the comic’s sheet. They will also be used by the customer in his/her search of comics. In order to determine them, two comics’ experts (a bookseller and comic association journalist, a comic bookseller) were questioned about relevant comic objective attributes. A comic website was also referred. A list of objective attributes was obtained. The comic price is considered important in the definition of a comic since it represents generally a criterion for buying a product for customer. Thus, we keep the most relevant objective attributes which are:
Title of series (or Title of album if there is only one album); volume number – title of volume; screenwriter(s); cartoonist; colorist; publisher; collection; number of pages; edition release date ; summary (either one for the series or one for the volume, but often, there is one summary per volume), price
2.2 Determination of emotional attributes
A summary list of emotions described in the literature was presented to ten comics’ fans. They were asked to identify the main representative emotions provoked by reading a comic.
The most frequently cited emotions were the following: joy, surprise, pleasure, curiosity,
fascination, relaxation, boredom, satisfaction, awaiting, and calm. This list of terms was retained for
future use.
2.3 Determination of sensory and semantic attributes
Terms related to sensory and semantic comics’ characteristics were collected by two different ways: from readers’ comments from two comics’ websites, by questioning comics’ fans. We also refer to McCloud [13].
The most occurring terms were considered. Among the identified terms, the term “emotional” was got. This term was considered encompassing all emotions identified in the previous section; therefore it was omitted from the final list of sensory and semantic attributes. The term “calm” was also omitted since it was considered as an emotional term. Finally, the following list of ten comic’s sensory and semantic attributes was kept:
Gripping, nice, classic, clear, imaginary, original, artistic, funny, dynamic, of quality.
3 Preference based system framework
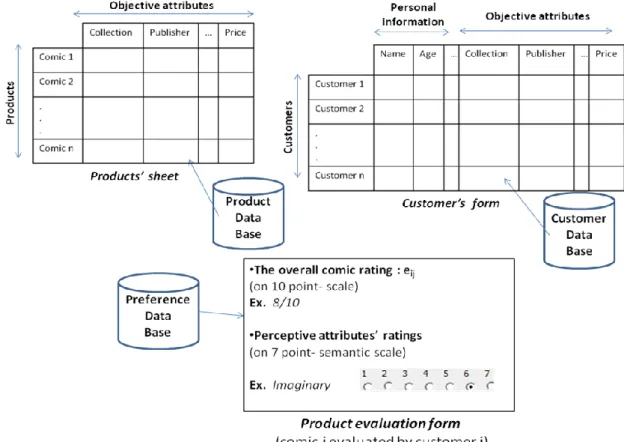
The purpose of our system is to assist customers (users of the system) in their choice of an appropriate comic; this comic is assumed to meet their expectations. The system uses three data bases (figure 1), namely:
- Customers’ data base: stores personal information of each customer. The customer’s expectations (that is to say the expected objective attributes of the comic) will also be stored. In order to be registered, each customer has to fill this information in a form. Data in customer’s form (figure1) represents the values of his/her personal information (name, age…) and the expected objective attributes (collection, publisher…). An attribute can have multiple values (ex. One customer likes more than one comics’ publisher).
- Products’ data base: stores the value of the objective attributes for each comic (comics’ sheets, figure1). This data base is updated once a new comic appears in the market.
- Preferences data base: stores the ratings of each comic by the customer. To that end, a product evaluation form is provided (figure1). Global rating eij represents the overall evaluation of a comic i by
a customer j. It reflects customer’s objective and perceptive preferences regarding the comic that he/she had read and it is valued on 10 point-scale. Perceptive comic’s attributes are evaluated on Semantic Differential Scale [14]. Here, we consider a 7 point-scale (Product evaluation form, figure1).
Figure 1. Illustration of the data bases’ structure
4 Basic stages of the proposed filtering algorithm
The system use case considered is: “The system spontaneously recommends products to registered customer”. Recommendations are based on customers’ comics’ evaluations. The algorithm proposed helps to solve this use case. Figure 2 illustrates by an example the different stages of the algorithm. In this example, we aim to recommend comics to an active customer called Paul.
In order to recommend comics to Paul, the algorithm searches groups of customers with similar evaluations of comics. This stage represents the first filtering based on the overall comics’ ratings. These ratings exist in each product evaluation form of the preferences data base (figure 1). Thus Paul’s neighbours are identified. They have similar preferences to him and they form cluster1. This cluster is based on the overall comics’ ratings. The second stage, called here selection is a filtering on perceptual attributes evaluations of comics. It provides among cluster1’s customers who share Paul’s perceptual point of view; they are neighbours who evaluate the comics in the style of Paul and for the same perceptive reasons. They constitute Clusterselection. The highly rated comics by the customers of
Clusterselection represent the favourite comics. They are obtained after applying Fileringcomic (figure2).
Favourite comics not yet rated by Paul may interest him. The system checks whether these comics’ objective attributes meet the Paul’s expectations. These expectations are expressed in Paul’s form represented in the customer database (figure 1). Comics obtained are recommended to Paul.
The different stages of the algorithm are described as follows: 4.1 FilteringEval
This stage consists in applying a filtering on all customers of the system
on the basis of
the ratings (or the overall evaluation) assigned to each comic. The rating of the comic i given by the customer j is assigned by eij.Let n be the number of comics in the system and c the number of customers. We consider the matrix that comprises the n comics in rows and the c customers in columns (figure 3). Each entry (ei, j)
of the matrix fluctuates between 1 and 10 (see “Product evaluation form”, figure 1).
Figure 3. Illustration of the overall ratings of comics by customers
The objective of this stage is to determine customers who have similar preferences regarding the comics. A measurement of the proximity between two customers is required. This measurement can be achieved by the method of the cosine measure [15].
In fact, each customer A of the matrix (figure 3) can be represented as a vector
A
.Cosine method calculates the cosine of the angle between two given customers A and B that represents the similarity between them. A similarity matrix (c X c) of all customers is obtained. The next stage is the neighborhood formation; different methods can be used, such as "Center-based". This method consists in forming a neighborhood for a particular customer by selecting his k nearest neighbors; k represents the maximum number of neighbors or threshold that has to be set. Sarwar [12] also presented an algorithm named "Aggregate Neighborhood" to determine the neighborhood of a customer.In our case study, comics’ recommendations will be addressed to Paul. Considering the approach outlined above, we get Paul’s neighborhood called cluster1 (figure 2). This cluster is based on
comics’ ratings. In order to form Paul’s neighborhood, the measurement of the proximity between Paul and the customers of the system is required. Customers who are compared with Paul must have assessed at least two comics in common with him. The proximity considered here between Paul and one customer x is the similarity coefficient simPaul,x, computed from the matrix of the overall ratings of
comics (figure 3). It is determined as follows [1]:
sim
.
.
2 2 x Paul,x
Paul
x
Paul
=
(1)x represents the vector of the customer x. This vector components are (eix) (figure 3) that represent
the evaluation of the comic i (i=1…n) by the customer x. If one comic is not evaluated by the customer x, it is not taken into account in the formula.
2
x
represents the euclidian norm of xA threshold that reflects the maximum number of Paul’s neighbors has to be set later. Paul’s nearest neighbors will be selected. Each one has a similarity coefficient above the threshold. Cluster1 includes ten neighbors who have preferences similar to Paul.
4.2 Selection (thresholdselection, indexsimilarity)
This stage aims to form clusterSelection (figure 2) by selecting among cluster1 the customers who
share common perceptive ratings with Paul. These customers must have similar preferences than Paul regarding comics and they must have similar perceptive ratings. In order to form clusterSelection, let p be
the number of comics evaluated by Paul. For each comic evaluated by Paul, a perceptive proximity between Paul and one customer x is determined (customer x belongs to cluster1). This proximity is the similarity between Paul and the customer based on the perceptive evaluations of the considered comic. Sim (Paul, Customer x)comic i, Paul represents the proximity considered between Paul and customer x
based on perceptive evaluations of comici,Paul (figure 4);
comic
i,Paul
comic ,...,
1
comicn
; i is theindex of the comic evaluated by Paul.
Figure 4. Illustration of similarity between Paul and cluster1’s customers based on perceptive evaluations of p comics
Sim (Paul, customer x)comic,i, Paul is determined as follows: for each comic evaluated by Paul, a matrix is
of this matrix (eattribute, customer)is the evaluation of a comic perceptive attributes by a given customer.
The evaluation of each attribute is rated on 7 point-semantic scale (see “Product evaluation form”, figure 1). Each customer of the matrix can be represented as a vector. Vector components of customer
x are (eattribute, customerx). If comic i was evaluated by the customer x,(Paul, customer x)comici, Paul would be
determined by calculating the cosine coefficient between Paul and customer x.
Let p’ be the number of comics evaluated by Paul and customer x at the same time (p’< p). From the matrix presented in figure 4, it is possible to determine the overall similarity coefficient between Paul and Customer x. The overall similarity coefficient is given by the following formula:
comiciCustomerx p i
Customerx
Paul
Sim
p
=
, ' 1 similarity(
,
)
1
index
(2)comici, Customerx represents the i th
comic evaluated by Paul and Customer x at the same time. indexsimilarity
is determined for each Paul’s neighbor. It represents the similarity between Paul and Customer x depending on the perceptive evaluation of comics. In order to identify the relevant neighbors, a selection depending on indexsimilarity is realized (figure 2). This selection consists in setting a threshold
called thresholdSelection that represents the size of Paul’s perceptive neighborhood. The choice of
neighbors depends on indexsimilarity. Neighbors having the higher indexsimilarity will be selected. This
selection lead to Clusterselection; it includes neighbors who share Paul’s perception of emotional, sensory
and semantic attributes.
Figure 5. Illustration of the matrix showing the comic perceptive attributes rated by cluster1’s customers (this comic was rated by Paul)
4.3 Favorite comics
In this step, we determine the favorite comics of each customer who belongs to clusterselection.
Favorite comics that have an average evaluation above 7/10 are chosen. 4.4 Comics recommended to Paul
The filtering Filteringcomic used here restricts favorite comics to those not evaluated by Paul.
Moreover, these comics should meet Paul’s relevant objective attributes (i.e. his ideal comic given in the customer’s form).The used method is based on a threshold coefobj. This threshold defining the
maximum distance between Paul’s relevant objective attributes and comic’s objective attributes. In order to compute this distance, a dummy coding (binary matrix) is used (figure 6).
Figure 6. Dummy coding of the objective attributes- Matrix showing the absence or presence of Paul’s relevant objective attributes in the favorite comics
If one favorite comic meets one of the Paul’s relevant objective attributes (or expectations), “1” is inserted in the corresponding row. Otherwise, “0” is placed. For each comic (column), the number of “1” is counted and divided by the number of objective attributes. The result represents the distance dj
between Paul’s ideal comic and a favorite comic j (j=1…c):
nbObj
b
=
nbObj i ij
1 jd
(3)bij =1 if the favorite comic j meets Paul’s objective attribute i, otherwise bij =0; nbObj represents the
number of objective attributes. Here, nbObj=11
dj is compared with a threshold coefobj. coefobj has to be set. The remaining comics are the more
relevant: they take into account Paul’s objective and perceptive expectations. They are recommended to him.
5 Conclusion and perspectives
The purpose of this project is to design a preference based system that helps customers in their purchase decision. Different use cases are considered. In this paper, the use case that consists in making spontaneous recommendations to the customers of the system is chosen. To that end, an algorithm recommends a set of products (in our case comics) is suggested. This algorithm is based on the traditional collaborative filtering, selection techniques and clusters constitution based on the similarity between the customers. Clusters gather the customers who share similar preferences toward products. The algorithm takes into account the products’ evaluations, and a refining of perceptive (emotional, sensory and semantic) data; here is our contribution. In fact, refining improves the relevance of recommendations. Recommended products answer customer objective and perceptive expectations. However, “Sparsity” and “Gray sheep” problems which represent limitations in collaborative filtering persist in the suggested algorithm. Moreover, threshold parameters remain to be set.
As perspectives of this work, different types of perceptive data can be separated to distinguish different evaluation methods and to obtain different corresponding customers’ clusters. The test and the validation of the proposed algorithm remain to be done. This will validate our work and allows the determination of the various parameters that have to be set.
Furthermore, other use cases of the system remain to be released. These use cases represent other possible interactions between the customers and the system, namely: a customer enters his/her personal information, and his/her expectations in the system; a customer searches comics depending on different criteria. Another use case in relation to the storing and the update of the products in the product data base has to be realized.
References
[1] P. Resnick, N. Iacovou, M. Suchak, P. Bergstrom, and J. Riedl. GroupLens:An Open Architecture for Collaborative Filtering of Netnews. In Proceesings of CSCW ’94, Chapel Hill, NC, 1994.
[2] W. Hill, L. Stead, M. Rosenstein, and G. Furnas. Recommending and Evaluating Choices in a Virtual Community of Use. In Proceedings of CHI’95.
[3] H. Lieberman. Letizia: An Agent that Assists Web Browsing. In Proceedings of the IJCAI’95, 924–929.
[4] M. Pazzani, J. Muramatsu and D. Billsus. Syskill & Webert: Identifying Interesting
Web Sites. In Proceedings of the Thirteenth National Conference on Artificial Intelligence, 1996, 54–61.
[5] B. Krulwich. LifeStyle Finder: Intelligent User Profiling Using Large-Scale Demographic Data. AI Magazine 18(2): 1997, 37–45.
[6] M. Pazzani. A Framework for Collaborative, Content-Based and Demographic Filtering. Department of Information and Computer Science. University of California, Irvine. Irvine, CA 92697, 1999.
[7] R. Burke. Hybrid Recommender Systems: Survey and Experiments. User Modeling and User-Adapted Interaction, 12(4), 2002, 331-370.
[8] M. Montaner, B. López, J-L. De La Rosa. A Taxonomy of Recommender Agents on the Internet, Artificial Intelligence Review, vol. 19, Kluwer Publishers, 2003, p. 285-330. [9] U. Shardanand, and P. Maes. Social information filtering: algorithms for automating "Word
of Mouth''. Proceedings of the SIGCHI conference on Human factors in computing systems. Denver, Colorado, United States: ACM Press/Addison-Wesley Publishing Co, 1995
[10] J. Konstan, B. Miller, D. Maltz, J. Herlocker, L. Gordon, and J. Riedl.GroupLens: Applying Collaborative Filtering to Usenet News. Communications of the ACM, 40(3), 1997, pp. 77-87
[11] M. Claypool, A. Gokhale, T. Miranda, P. Murnikov, D. Netes, and M. Sartin. Combining Content-based and collaborative filters in an online newspaper. June 22, 1999
[12] B. Sarwar, G. Karypis, J. Konstan and J. Riedl. Analysis of Recommendation Algorithms for E-Commerce. 2nd ACM Conference on Electronic Commerce, 2000, pp. 158-167
[13] S. McCloud. Making Comics. Harper, 2006
[14] C.E. Osgood, C.J. Suci, P.H. Tannenbaum. The Measurement of Meaning. University of Illinois Press, Urbana, pp. 76}124, 1957.
[15] J. S. Breese, D. Heckerman and C. Kadie. Empirical Analysis of Predictive Algorithms for Collaborative Filtering. Technical Report MSR-TR-98-12, 1998