HAL Id: hal-01951413
https://hal.inria.fr/hal-01951413
Submitted on 11 Dec 2018
HAL is a multi-disciplinary open access
archive for the deposit and dissemination of
sci-entific research documents, whether they are
pub-lished or not. The documents may come from
teaching and research institutions in France or
abroad, or from public or private research centers.
L’archive ouverte pluridisciplinaire HAL, est
destinée au dépôt et à la diffusion de documents
scientifiques de niveau recherche, publiés ou non,
émanant des établissements d’enseignement et de
recherche français ou étrangers, des laboratoires
publics ou privés.
Kévin Bannier, Eakta Jain, Olivier Le Meur
To cite this version:
Kévin Bannier, Eakta Jain, Olivier Le Meur. DeepComics: saliency estimation for comics. ETRA
2018 - ACM Symposium on Eye Tracking Research & Applications, Jun 2018, Warsaw, Poland. pp.1-5,
�10.1145/3204493.3204560�. �hal-01951413�
saliency models is large training eye tracking datasets. Despite the fact that the accessibility of eye tracking technology has greatly increased, collecting eye tracking data on a large scale for very specific content types is cumbersome, such as comic images, which are different from natural images such as photographs because text and pictorial content is integrated. In this paper, we show that a deep network trained on visual categories where the gaze deployment is similar to comics outperforms existing models and models trained with visual categories for which the gaze deployment is dramatically different from comics. Further, we find that it is better to use a computationally generated dataset on visual category close to comics one than real eye tracking data of a visual category that has different gaze deployment. These findings hold implications for the transference of deep networks to different domains.
I. Introduction
Comics are a compelling medium for visual storytelling that are experiencing a resurgence as a result of the digital revolution [1]. New forms of comic art, such as mobile comics and web comics, reach a wider audience and creates new consumption methods. Powered by digital tools and open publishing platforms, comics as a form of expression has become accessible to individual content creators beyond established publishing houses.
The common characteristic across all the diverse ap-plications of comics [2], [3], [4], [5], [6], [7], [8], [9], [10] is that with a smart mixture of text or/and other visual information, artists communicate the content by drawing the viewer attention to specific areas.
Estimating where an observer looks within a comic is useful to drive a variety of application such as crop-ping [11], recomposing, or augmenting traditional comics with digital effects such as animations, stereoscopy, moves-on-stills [12], [13]. For these applications, the prerequi-site is to get prior knowledge of the visual route used by the viewer, or intended by the artist. Rather than performing time-consuming and cumbersome eye tracking experiments, we propose a deep neural network to address this problem.
The technical challenge here is that there are very few eye tracking dataset on comics; to the best of our knowledge, the dataset proposed in [12] is the sole publicly available dataset at this time. However, this dataset is too small to perform an end to end training for a deep network. To overcome this problem, we propose to train the deep network on publicly available eye tracking datasets that
K. Bannier is with Univ Rennes CNRS IRISA, France. E. Jain is with University of Florida, US.
O. Le Meur is with Univ Rennes CNRS IRISA, France.
of gaze behavior. With this transfer learning [14], we show that the learned features are relevant enough to predict saliency on comics. Our contributions can be summarized as follows: (i) we propose the first saliency model dedicated towards predicting the saliency maps on comics; (ii) we show that the proposed model trained on visual categories that have similar gaze deployment as comics performs much better than traditional saliency models and than models trained on natural scenes; (iii) we evaluate the benefit to use fake dataset, i.e. data that has been computationally generated, for training the proposed model.
This paper is organized as follows. Section II investigates the gaze deployment on comics. Section III presents the deep network used for predicting the salience on comics. Section IV presents the performance of the proposed model and compare it to state-of-the-art methods. We conclude this paper in the last section.
II. Gaze deployment on comics
We investigate the gaze deployment of observers while watching comics using [12]’s dataset, which is composed of 23 images taken from public domain legacy comics. Five viewers participated in the experiment. More details are available in [12].
The joint probability distribution p(d, φ), estimated as described in [17] represents the probability that a fixation featured by a distance d and an angle φ occurs:
p(d, φ) = 1 n n X i=1 Kh(d − di, φ − φi) (1)
where, di and φi represents the distance (expressed in
visual angle) and the angle (expressed in degree) between each pair of successive fixations respectively. n is the total number of samples and Khis a two-dimensional Gaussian
kernel.
The distribution p(d, φ) obtained on the comics dataset is illustrated on Figure 1 (Top-left). The polar plot indi-cates the probability of saccade targeting when the current fixation point is located at the center of the plot. Radial position indicates saccadic amplitudes expressed in degree of visual angle. Three main observations can be done: first, the rightward saccades are much more numerous than other saccades (see arrow numbered 1). The amplitudes of those saccades are rather small, between 1.5 and 2 degrees of visual angle. This indicates that observers move their eye with small jumps from the left-hand side to the right-hand side of the comics images. Second observation concerns the re-positioning saccades (see arrow numbered
Fig. 1. Distribution of saccade amplitudes and orientations for Comics (top-left), Cartoon, Art and Sketch from the CAT2000 eye tracking dataset [15], and webpages from [16]. Bottom: Representative stimuli images of the visual categories.
2). These leftward saccades are used to re-position eyes on the left-hand side of the stimulus. The third observation (see arrow numbered 3) concerns the downward saccades, indicating that observers look the images in a top-down manner.
We evaluate the degree of similarity between the comic distribution and four other distributions, computing on Art, Cartoon, Sketch and Webpages images; some rep-resentative stimuli images of these visual categories are illustrated on Figure 1 (Bottom row). Distributions for Art, Cartoon and Sketch are computed by using the eye tracking dataset CAT2000 [15] whereas the eye tracking dataset of [16] is used to estimate the distribution of saccade amplitudes and orientations on webpages. Figure 1 plots these joint distributions of saccade amplitudes and orientations. Table I provides the similarity values between the comics distribution and Art, Cartoon, Sketch and Webpages distributions. The similarity is assessed by the Kullback-Leibler divergence, the linear correlation and intersection of histograms [18]. As shown by Table I, the comics joint distribution turns out to be similar to the gaze deployment observed on webpages and on sketches. Web-pages and Comics share several properties. As mentioned earlier, the gaze deployment on comics is close to those observed on webpages. Observers explore the webpages starting from the upper left corner and progressively move the gaze in a top-down manner. Regarding the sketch category, the similarity with comics gaze deployment is primarily related to the amplitude and orientations of saccades. As for comics, saccade amplitudes are rather small and mostly along the horizontal direction. The lowest similarity is observed for the category Art.
The similarity in content is also evaluated by computing the KL-divergence between the average amplitude Fourier spectrums of Comics and the aforementioned categories. Table I indicates that Cartoon is the most similar category whereas Sketch is the most dissimilar. Interestingly, the similarity in content (based on the average Fourier spec-trum) is correlated negatively to the similarity in gaze deployment.
Our motivation is to evaluate the benefit to train a deep convolutional network with eye tracking data collected on visual categories similar either in terms of gaze behavior or similar in terms of visual content.
TABLE I
Similarity between Comics and Art, Cartoon, Sketch, Webpages categories in terms of gaze deployment (top) and Fourier spectrum (bottom). ↑ indicates the higher the better, whereas ↓ indicates the
lower the better.
Dist. similarity Art Cartoon Sketch Webpages KL-divergence ↓ 0.376 0.400 0.267 0.2417 Correlation ↑ 0.773 0.796 0.813 0.854 Similarity ↑ 0.706 0.707 0.739 0.758 Content similarity
KL-divergence ↓ 0.172 0.157 0.69 0.238
Fig. 2. Deep network for predicting saliency on comics images. 1280 deep feature maps are extracted by using the VGG-16 network. A smaller network (bottom-right) is trained by using eye tracking data.
III. Predicting saliency A. Deep saliency network
For predicting the salience of comics, the architecture of network, illustrated in Figure 2, is based on the deep gaze network of [19] and on the multi-level deep network of [20]. The pre-trained VGG-16 network [21] is used for extracting deep features of an input image (800×450) from layers conv3 pool, conv4 pool, conv5 conv3. Feature maps of layers conv4 pool and conv5 conv3 are rescaled to get feature maps with a similar spatial resolution.
Similarly to [20], a smaller network, composed of two convolutional layers, is built. The first layer has a kernel size 3 × 3 and 64 feature maps. The second is a simple convolution layer, with a kernel 1 × 1, used to reduce the data dimensionality. Both these two layers have a Relu activation. The last layer outputs a reduced predicted
instructed to free-view the webpages. We also use the 100 images from the Sketch visual category from the CAT2000 eye tracking dataset [15]. Observers were instructed to look around the image.
(ii) Training with dataset that has a similar content: we use the Art and Cartoon categories of the CAT2000 dataset. Each category is composed of 100 images.
(iii) Generating fake training data for webpages content: we generate computationally a new dataset of saliency maps for webpages in order to increase the training corpus. This fake dataset could is used to (pre)train the proposed method. We collected 316 new screenshots of webpages. The predicted saliency maps are computed by adapting iSEEL model [22]. The modification just consists in adding a webprior computed from [16]. Once the proposed deep network is (pre)trained, it could be fine-tuned with the eye tracking dataset [16].
Concerning the implementation, input images are first resized to a resolution of 800 × 450 pixels. The loss function is L(w) = N1 PN
i=1g(yi)kpi− yik
2 with g(x) =
1 + β1
1+exp(−β2(x−γ)). N represents the number of images
per batch (N = 20), pi and yi represent the vectorized
ith predicted saliency map and ground truth map in
the current batch, respectively. We assume that both predicted and ground truth maps are normalized in the range [0, 1]. The function g() is chosen in order to give more importance to errors occurring on high ground truth salience. This is a positive-definite increasing function. By default, we use β1= β2= 9 and γ = 0.6.
The network was trained using stochastic gradient descent. To prevent over-fitting, a dropout layer is added before the 3x3 convolutional layer. The rate of dropout is set to 0.5. During training, the network was validated against the validation set after every iterations to monitor convergence and over-fitting. The learning rate is set to 0.001. To test the model, we added a convolution with Gaussian filter after the last layer, to smooth the generated saliency map. This map is first resized to 800 × 450 and is then filtered by the proposed Gaussian filter.
IV. Performance
To carry out the evaluation, we use seven quality metrics used in the MIT benchmark [18], [32]: CC (correlation coefficient, CC ∈ [−1, 1]), SIM (similarity, intersection between histograms of saliency, SIM ∈ [0, 1]), AUC (Area Under Curve, AU C ∈ [0, 1]), NSS (Normalized Scanpath Saliency, N SS ∈ ]−∞, +∞[), EMD (Earth Mover Distance, EM D ∈ [0, +∞[) and KL (Kullback Leibler divergence, KL ∈ [0, +∞[).
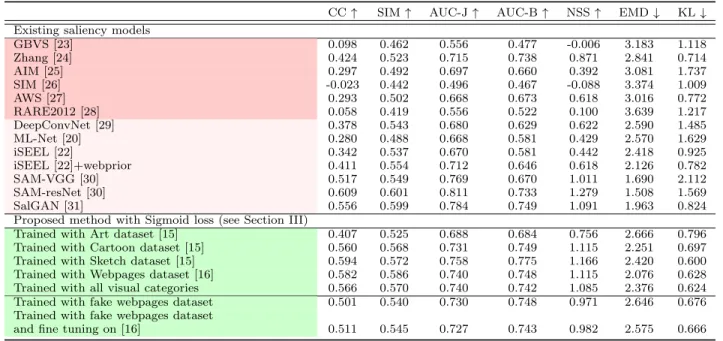
Except SAM-VGG, SAM-resNet [30]and SalGAN [31], all the tested models perform quite poorly to predict salience on comics. The best unsupervised model is Zhang’s model [24]. The supervised models do not present a significant advantage over unsupervised ones. These observations, consistent with a previous analysis [34], were expected. Indeed, all these models have been designed for predicting saliency on natural scenes. Most of them embed implicitly or explicitly a center bias accounting for observers’ viewing tendency to look at the center of screen. However, this viewing tendency is not systematic [35] and depends on the visual content display onscreen. For both webpages and comics, a top-left bias is observed. Con-sidering this point, a straightforward approach consisting in weighting predicted saliency maps by a webpage prior (learned on eye tracking dataset [16]) may significantly increase the performance. For instance, the performance of iSEEL model significantly increases when a prior web is used. Although the gain in CC is about 0.07, the performances are still limited.
B. Performance of proposed models
Compared to existing methods, the proposed methods (see light green cells in Table II) outperform in a signif-icant manner both unsupervised (see dark pink cells in Table II) and most of supervised models (see link pink cells in Table II). The training with eye tracking dataset on Sketches provides the best performance (i.e. with a correlation coefficient of 0.594). The proposed deep model trained on Webpages ranks second (i.e. with a correlation coefficient of 0.582). Performances, when Art and Cartoon are considered for the training, are poorer (i.e. with a correlation coefficient of 0.407 and 0.560, respectively). This ranking is in accordance with the similarity between joint distributions, as shown by Table I. Finally, when we consider all visual categories for the training (more than 400 images), the performances (e.g. CC = 0.566) are not as good as the model trained with Sketch (e.g. CC = 0.594) (only 100 images). All these observations suggest that it is possible to train efficiently a deep network on visual categories for which the gaze behavior is close to the targeted category. This transfer learning is especially interesting when datasets are small.
To go further, we train the proposed model with a dataset composed of predicted saliency maps computed on webpages; we call it fake dataset in Table II. Performances are rather good compared to unsupervised and supervised models. The fine-tuning of the pre-trained model with a real webpage dataset [16] does not allow to improve
TABLE II
Performance of existing and proposed saliency models over comics dataset. Best performances are in bold. (AUC-B=AUC-Borji; AUC-J=AUC-Judd)
CC ↑ SIM ↑ AUC-J ↑ AUC-B ↑ NSS ↑ EMD ↓ KL ↓ Existing saliency models
GBVS [23] 0.098 0.462 0.556 0.477 -0.006 3.183 1.118 Zhang [24] 0.424 0.523 0.715 0.738 0.871 2.841 0.714 AIM [25] 0.297 0.492 0.697 0.660 0.392 3.081 1.737 SIM [26] -0.023 0.442 0.496 0.467 -0.088 3.374 1.009 AWS [27] 0.293 0.502 0.668 0.673 0.618 3.016 0.772 RARE2012 [28] 0.058 0.419 0.556 0.522 0.100 3.639 1.217 DeepConvNet [29] 0.378 0.543 0.680 0.629 0.622 2.590 1.485 ML-Net [20] 0.280 0.488 0.668 0.581 0.429 2.570 1.629 iSEEL [22] 0.342 0.537 0.670 0.581 0.442 2.418 0.925 iSEEL [22]+webprior 0.411 0.554 0.712 0.646 0.618 2.126 0.782 SAM-VGG [30] 0.517 0.549 0.769 0.670 1.011 1.690 2.112 SAM-resNet [30] 0.609 0.601 0.811 0.733 1.279 1.508 1.569 SalGAN [31] 0.556 0.599 0.784 0.749 1.091 1.963 0.824
Proposed method with Sigmoid loss (see Section III)
Trained with Art dataset [15] 0.407 0.525 0.688 0.684 0.756 2.666 0.796 Trained with Cartoon dataset [15] 0.560 0.568 0.731 0.749 1.115 2.251 0.697 Trained with Sketch dataset [15] 0.594 0.572 0.758 0.775 1.166 2.420 0.600 Trained with Webpages dataset [16] 0.582 0.586 0.740 0.748 1.115 2.076 0.628 Trained with all visual categories 0.566 0.570 0.740 0.742 1.085 2.376 0.624 Trained with fake webpages dataset 0.501 0.540 0.730 0.748 0.971 2.646 0.676 Trained with fake webpages dataset
and fine tuning on [16] 0.511 0.545 0.727 0.743 0.982 2.575 0.666
in a significant manner the performance. Moreover, this training strategy does not allow to outperform models tat are directly trained with real eye tracking data. This model performs at 0.501 whereas the best model trained with eye tracking data performs at 0.594.
V. Conclusion
In this paper, we train a deep network for predicting the salience on comics. Since existing eye tracking datasets for comics are extremely limited, we rely on transfer learning. We show that training the proposed deep network with visual categories showing similar gaze deployment to comic content provides the best performance. To be more specific, the use of eye tracking data collected on Sketches and on Webpages allows us to outperform in a significant manner the same deep network trained with eye tracking collected on Art and Cartoon. We also observe that it is even better to train the network with computationally generated data computed on Webpages than using real eye tracking data collected on visual categories, e.g. Art, for which the gaze deployment is dramatically different from the one observed on comics.
References
[1] S. Fenty, T. Houp, and L. Taylor, “Webcomics: The influence and continuation of the comix revolution,” ImageTexT: Inter-disciplinary Comics Studies, vol. 1, no. 2, 2004.
[2] M. J. Green and K. R. Myers, “Graphic medicine: use of comics in medical education and patient care,” BMJ: British Medical Journal (Online), vol. 340, 2010.
[3] A. Farthing and E. Priego, “graphic medicineas a mental health information resource: Insights from comics producers,” The Comics Grid: Journal of Comics Scholarship, vol. 6, 2016. [4] M. Tatalovic, “Science comics as tools for science education and
communication: a brief, exploratory study,” Jcom, vol. 8, no. 4, 2009.
[5] L. Kruger and P. W. Shariff, “shoothis book makes me to think! education, entertainment, and life-skills comics in south africa,” Poetics Today, vol. 22, no. 2, pp. 475–513, 2001.
[6] G. E. Schwarz, “Graphic novels for multiple literacies,” Journal of Adolescent & Adult Literacy, vol. 46, no. 3, pp. 262–265, 2002.
[7] L. Gonick, The Cartoon History of the Universe: Volumes 1-7: From the Big Bang to Alexander the Great. Crown/Archetype, 2014, vol. 1.
[8] N. Cohn, The Visual Language of Comics: Introduction to the Structure and Cognition of Sequential Images. A&C Black, 2013.
[9] A. Farthing, “Illustrating cognition–a review of the visual language of comics,” The Comics Grid: Journal of Comics Scholarship, vol. 4, no. 1, 2014.
[10] A. Farthing and E. Priego, “Data from graphic medicineas a mental health information resource: Insights from comics producers,” Open Health Data, vol. 4, no. 1, 2016.
[11] A. Santella, M. Agrawala, D. DeCarlo, D. Salesin, and M. Co-hen, “Gaze-based interaction for semi-automatic photo crop-ping,” in Proceedings of the SIGCHI conference on Human Factors in computing systems. ACM, 2006, pp. 771–780. [12] I. Thirunarayanan, K. Khetarpal, S. Koppal, O. Le Meur,
J. Shea, and E. Jain, “Creating segments and effects on comics by clustering gaze data,” ACM Transactions on Multime-dia Computing, Communications, and Applications (TOMM), 2017.
[13] E. Jain, Y. Sheikh, and J. Hodgins, “Predicting moves-on-stills for comic art using viewer gaze data,” IEEE CGA Special Issue on Quality Assessment and Perception in Computer Graphics, 2016.
[14] S. J. Pan and Q. Yang, “A survey on transfer learning,” IEEE Transactions on knowledge and data engineering, vol. 22, no. 10, pp. 1345–1359, 2010.
[15] A. Borji and L. Itti, “Cat2000: A large scale fixation dataset for boosting saliency research,” arXiv preprint arXiv:1505.03581, 2015.
[16] C. Shen and Q. Zhao, “Webpage saliency,” in ECCV. IEEE, 2014.
[17] O. Le Meur and Z. Liu, “Saccadic model of eye movements for free-viewing condition,” Vision research, vol. 116, pp. 152–164, 2015.
[18] Z. Bylinskii, T. Judd, A. Borji, L. Itti, F. Durand, A. Oliva, and A. Torralba, “Mit saliency benchmark,” 2015.
fixation prediction using deep features,” Neurocomputing, vol. 244, pp. 10–18, 2017.
[23] J. Harel, C. Koch, and P. Perona, “Graph-based visual saliency,” in Advances in neural information processing systems, 2007, pp. 545–552.
[24] L. Zhang, M. H. Tong, T. K. Marks, H. Shan, and G. W. Cottrell, “Sun: A bayesian framework for saliency using natural statistics,” Journal of vision, vol. 8, no. 7, pp. 32–32, 2008. [25] N. D. Bruce and J. K. Tsotsos, “Saliency, attention, and visual
search: An information theoretic approach,” Journal of vision, vol. 9, no. 3, pp. 5–5, 2009.
[26] N. Murray, M. Vanrell, X. Otazu, and C. A. Parraga, “Saliency estimation using a non-parametric low-level vision model,” in Computer vision and pattern recognition (cvpr), 2011 IEEE conference on. IEEE, 2011, pp. 433–440.
[27] A. Garcia-Diaz, X. R. Fdez-Vidal, X. M. Pardo, and R. Dosil, “Saliency from hierarchical adaptation through decorrelation and variance normalization,” Image and Vision Computing, vol. 30, no. 1, pp. 51–64, 2012.
[28] N. Riche, M. Mancas, M. Duvinage, M. Mibulumukini, B. Gos-selin, and T. Dutoit, “Rare2012: A multi-scale rarity-based saliency detection with its comparative statistical analysis,” Signal Processing: Image Communication, vol. 28, no. 6, pp. 642–658, 2013.
[29] J. Pan, E. Sayrol, X. Giro-i Nieto, K. McGuinness, and N. E. O’Connor, “Shallow and deep convolutional networks for saliency prediction,” in Proceedings of the IEEE Conference on Computer Vision and Pattern Recognition, 2016, pp. 598–606. [30] M. Cornia, L. Baraldi, G. Serra, and R. Cucchiara, “Predict-ing human eye fixations via an lstm-based saliency attentive model,” arXiv preprint arXiv:1611.09571, 2016.
[31] J. Pan, C. Canton, K. McGuinness, N. E. O’Connor, J. Torres, E. Sayrol, and X. Giro-i Nieto, “Salgan: Visual saliency pre-diction with generative adversarial networks,” arXiv preprint arXiv:1701.01081, 2017.
[32] O. Le Meur and T. Baccino, “Methods for comparing scan-paths and saliency maps: strengths and weaknesses,” Behavior Research Method, vol. 45, no. 1, pp. 251–266, 2013.
[33] W. Shan, G. Sun, X. Zhou, and Z. Liu, “Two-stage trans-fer learning of end-to-end convolutional neural networks for webpage saliency prediction,” in International Conference on Intelligent Science and Big Data Engineering. Springer, 2017, pp. 316–324.
[34] K. Khetarpal and E. Jain, “A preliminary benchmark of four saliency algorithms on comic art,” in Multimedia & Expo Workshops (ICMEW), 2016 IEEE International Conference on. IEEE, 2016, pp. 1–6.
[35] O. Le Meur and A. Coutrot, “Introducing context-dependent and spatially-variant viewing biases in saccadic models,” Vision research, vol. 121, pp. 72–84, 2016.