HAL Id: hal-00515055
https://hal.archives-ouvertes.fr/hal-00515055
Submitted on 4 Sep 2010
HAL is a multi-disciplinary open access
archive for the deposit and dissemination of sci-entific research documents, whether they are pub-lished or not. The documents may come from teaching and research institutions in France or abroad, or from public or private research centers.
L’archive ouverte pluridisciplinaire HAL, est destinée au dépôt et à la diffusion de documents scientifiques de niveau recherche, publiés ou non, émanant des établissements d’enseignement et de recherche français ou étrangers, des laboratoires publics ou privés.
To cite this version:
Alain H. Fuchs, Fabien Cailliez, Boutin Anne, Isabelle Demachy. Thermodynamic study of water confinement in hydrophobic zeolites by Monte Carlo simulations. Molecular Simulation, Taylor & Francis, 2009, 35 (01-02), pp.24-30. �10.1080/08927020802398900�. �hal-00515055�
For Peer Review Only
Thermodynamic study of water confinement in hydrophobic zeolites by Monte Carlo simulations
Journal: Molecular Simulation/Journal of Experimental Nanoscience Manuscript ID: GMOS-2008-0109.R1
Journal: Molecular Simulation Date Submitted by the
Author: 03-Aug-2008
Complete List of Authors: Fuchs, Alain; Ecole Nationale Supérieure de Chimie de Paris, Chemistry
Cailliez, Fabien; Ecole nationale Superieure de Chimie de Paris Anne, Boutin; Universite Paris-Sud
Demachy, Isabelle; Universite Paris-Sud
Keywords: Water, confinement, hydrophobicity, monte carlo simulations
For Peer Review Only
Thermodynamic study of water confinement in hydrophobic
zeolites by Monte Carlo simulations
Fabien Caillieza, Anne Boutinb, Isabelle Demachyb and Alain H. Fuchsa*
aEcole Nationale Supérieure de Chimie de Paris (Chimie ParisTech), 11 rue Pierre et Marie
Curie, 75005 Paris, France
bLaboratoire de Chimie Physique, CNRS and Université Paris-Sud, 91405 Orsay, France
* alain.fuchs@enscp.fr
We report a Grand Canonical Monte Carlo simulation study of water condensation in 4 different hydrophobic, all-silica, zeolites. In all cases, water condensation takes place above the saturation vapour pressure through a first-order like phase transition, with a hysteresis loop. This is at odds with the common belief that conventional phase transitions cannot take place in microporous solids such as zeolites. Forced fluid intrusion experiments, have long been interpreted in terms of irreversibilities. What we show here is that the most important features of this process can be understood in terms of equilibrium thermodynamics considerations. Finally, a strong depletion of confined water is predicted in these nanoporous solids.
INTRODUCTION
The concept of hydrophobicity was first used in aqueous solution thermodynamics in order to explain the solubility of small non polar species in water [1]. Such species can be accommodated in small quantities in liquid water without much perturbation of its hydrogen-bonded (HB) network. As the species gets larger, it becomes impossible to maintain the integrity of the HB network. For a large enough solute, it has been suggested that this could lead to the formation of a very thin layer of vapour separating the non polar surface from the liquid (an effect called “surface dewetting”) [2]. Lum et al [3] have argued that this qualitative change in behaviour from a “small” to a “large” solute could be characterized by a crossover length of the order of 1 nm. A comprehensive review on this subject, and its link with the role of water in biology, was provided by P. Ball very recently [4].
The term hydrophobic is somewhat misleading since it literally means “water repelling”. Indeed, in several theoretical studies, hydrophobic species were simply modeled as
5 6 7 8 9 10 11 12 13 14 15 16 17 18 19 20 21 22 23 24 25 26 27 28 29 30 31 32 33 34 35 36 37 38 39 40 41 42 43 44 45 46 47 48 49 50 51 52 53 54 55 56 57 58 59 60
For Peer Review Only
purely repulsive [3]. In real life, the water-hydrophobe interaction is attractive but less than the mutual water-water attraction. We shall use here this very simple and straightforward definition of a hydrophobic species, based on the comparison between the hydrophobe-water and the water-water interaction potential energy.
More recently, the notion of surface hydrophobicity was used [5,6]. It should be understood as a simple extension of the concept of hydrophobicity for large solutes described above. When a water molecule approaches a purely graphitic carbon surface, for instance, it experiences a weaker potential interaction energy than in the bulk liquid state, which is due to the lack of HB between water and carbon atoms. A similar situation is encountered when water is interacting with a protein surface made of nonpolar residues.
The behaviour of water confined to spaces of nanoscopic dimensions is an important issue in many areas of science and technology. The special situations in which the confining surfaces are hydrophobic have attracted a lot of interest in the past decade. Understanding the changes in water properties due to interactions with a hydrophobic substrate is relevant to such problems as selective adsorption using activated carbons or all-silica zeolites [7] (waste water treatment for instance). Similar questions arise when considering the issue of confined water in biological channelsand protein cavities [4]. We shall use for the rest of this article the term hydrophobic solid to depict a porous solid, the internal surface of which is hydrophobic.
Porous carbon materials are archetypical hydrophobic solids. They have been extensively studied for fundamental as well as practical reasons [8]. Still, a more detailed understanding is hampered by the intrinsic disorder of the amorphous porous carbons as well as by the difficulty in obtaining samples free of active surface defects. All-silica zeolites have also proven recently to behave like hydrophobic solids. In contrast to porous carbons and mesoporous silica, zeolites are well-characterized crystalline materials. The primary building unit of such solids is a tetrahedron with a silicon atom in the center and four oxygen atoms at its apexes. The zeolite framework consists of a 3-dimensional network of SiO4 tetrahedra connected to each other by shared oxygen atoms. This enables to build up a variety of purely siliceous open framework materials containing cages and channels of 0.4 to 2 nm width, with essentially no internal surface defects. In the all-silica frameworks such as silicalite-1 or β zeolite, water uptake in the gas phase at ambient conditions was found to be extremely small [6]. For this reason, these nanoporous materials were termed hydrophobic. In an
5 6 7 8 9 10 11 12 13 14 15 16 17 18 19 20 21 22 23 24 25 26 27 28 29 30 31 32 33 34 35 36 37 38 39 40 41 42 43 44 45 46 47 48 49 50 51 52 53 54 55 56 57 58 59 60
For Peer Review Only
experiment similar in nature to mercury porosimetry, Patarin and coworkers [9,10] observed water intrusion taking place in silicalite-1 at a hydraulic pressure of about 100 MPa at room temperature. A spontaneous extrusion (capillary evaporation, or drying) took place upon release of the pressure. All-silica zeolites were thus proven to be highly hydrophobic as well as non wetting nanoporous materials.
Recently, the water intrusion-extrusion transition in silicalite-1 was reproduced for the first time by equilibrium molecular simulations [11,12]. This phenomenon was tentatively interpreted in terms of an equilibrium first-order vapour-liquid condensation, following Porcheron et al [13], who pointed out the similarity between capillary condensation of a wetting fluid and forced intrusion of a non wetting fluid.
In what follows, we report a water intrusion/extrusion study of faujasite, LTA and β zeolites. These results are compared with the previously published silicalite-1 data. The nature of the intrusion/extrusion transitions is investigated using a thermodynamic potential computation. We find that the equilibrium vapour-liquid transition state is shifted to high pressure as confinement is increased. We conclude that the main features of the experimental intrusion/extrusion experiments can be understood in terms of equilibrium thermodynamics considerations.
SIMULATION MODELS AND METHODS
Zeolite models and forcefields
Atomic coordinates of the orthorhombic (Pnma) structure determined by van Koningsveld and coworkers [14] have been used for silicalite-1. The unit cell parameters are a=20.022Å, b=19.899Å, and c=13.383Å. Zeolite β structure has been determined by Newsam et al [15]. This crystal structure is composed of the intergrowth of two polytypes. Polytype A has a quadratic (P4122) symmetry, whereas polytype B exhibits a monoclinic (C2/c) symmetry. We
have studied the polytype A only, unit cell parameters of which are a=12.6614Å, b=12.6614Å, and c=26.4061Å. For LTA (Linde Type A) zeolite, atomic coordinates have been taken from the Atlas of Zeolite Framework Types [16]. The unit cell is cubic with a cell parameter of a=11.9189Å, which corresponds to the all-silica form of A zeolite. All-silica faujasite has never been synthesized so far. Indeed, crystalline faujasites are always found with a significant amount of aluminium atoms. The highest Si/Al ratio that can be obtained is
5 6 7 8 9 10 11 12 13 14 15 16 17 18 19 20 21 22 23 24 25 26 27 28 29 30 31 32 33 34 35 36 37 38 39 40 41 42 43 44 45 46 47 48 49 50 51 52 53 54 55 56 57 58 59 60
For Peer Review Only
around 44, and these faujasites exhibit an important amount of crystalline defects. Our all-silica faujasite is thus a speculative model, based on atomic coordinates that correspond to crystallographic data obtained by Fitch et al. for a faujasite with a Si/Al ratio of 2.43 [17]. We used a rigid zeolite framework in each case, and we simulated a box of eight to twelve unit cells with periodic boundary conditions. Molecular simulations were performed in the classical limit (no bond breaking taking place, for instance). This is justified by the fact that no structural or chemical changes seem to occur in these systems upon water condensation, even after several intrusion-extrusion cycles [6]. The forcefield used here was described in details earlier [6,12,18]. It has been used in previous water adsorption studies in either cationic [18] or all-silica frameworks [6,12]. The framework-fluid potential consists of standard coulombic + Lennard-Jones terms that act between the zeolite and the water centres of forces. The TIP4P model was used for water. All the potential parameters used in this work are identical to those reported in Ref 6. Finally, Ewald sums were used to calculate the coulombic terms of the interaction potential energy.
Simulation methods
Adsorption isotherms were computed using bias Grand Canonical Monte Carlo (GCMC) simulations [19,20] to compute the average number of adsorbed water molecules for several values of the chemical potential of the (fictitious) vapour reservoir at a given temperature. In the gas phase adsorption simulations, the water chemical potential was related to the vapour pressure by using the ideal gas law. Liquid phase adsorption data were obtained using the µ(P) relation, in a way previously described [12]. Other details such as the statistical bias moves, used to accelerate the convergence of the Monte Carlo runs, were also described in previous articles [6,18]. Each GCMC run lasted for some 10 million steps in order to equilibrate the system, followed by at least 40 million steps for the data acquisition.
Grand Potential computation
The question of the nature of the transition in adsorption/desorption experiments is often subject to debate. Is this transition a real phase transition, between a gas-like and a liquid-like fluid? Likewise, when hysteresis occurs, its origin also raises several questions. Is it due to a bad sampling of the system or can it be related to the existence of multiple metastable states?
5 6 7 8 9 10 11 12 13 14 15 16 17 18 19 20 21 22 23 24 25 26 27 28 29 30 31 32 33 34 35 36 37 38 39 40 41 42 43 44 45 46 47 48 49 50 51 52 53 54 55 56 57 58 59 60
For Peer Review Only
In order to provide an answer to these issues, knowledge of the thermodynamic potential of the system is necessary. Such a quantity is not straightforward to obtain and requires the use of sophisticated techniques. Recently, Wang and Landau developed such a technique based on the computation of the density of states (DOS) on-the-fly, using Monte Carlo simulations with non-Boltzmann sampling [21,22] (Once the DOS is known, the calculation of the thermodynamic potential is straightforward). This method has been revisited in the context of expanded ensembles [23-26]. In expanded ensembles, substates of the system are defined by the introduction of a new variable often called the reaction coordinate. We shall use here the number of water molecule, N, as the reaction coordinate. The aim of those EXEDOS (Expanded Ensemble Density Of States) simulations is not to determine the density of states as a function of the energy, as in the original Wang-Landau algorithm, but as a function of the reaction coordinate, in order to compute variations of thermodynamic quantities with N. When dealing with adsorption, the thermodynamic potential is the Grand Potential Ω, since simulations are conducted in the Grand Canonical ensemble. We have applied the EXEDOS methodology to compute Ω as a function of the number of adsorbed water molecules in the zeolite framework. To this end, we have computed the density of states of the system as a function of N, noted Q(N).
The probability to generate randomly a configuration with N water molecules is proportional to Q(N). A flat distribution is thus obtained if each state is visited with probability proportional to 1/Q(N). The acceptance probabilities of insertion and destruction moves have been modified accordingly (rotations, translations, and jump moves are still accepted according to the conventional Metropolis criteria):
p(N → N + 1) = min 1, V (N +1)Λ3 Q(N) Q(N + 1)e −β∆E ……. (1) p(N → N −1) = min 1,NΛ 3 V Q(N) Q(N −1)e −β∆E ………..(2)
where Λ is the de Broglie wavelength and ∆E is the energy change between the new and the old configuration. Q(N) is determined iteratively during the simulation. Initially, Q is uniformly set to 1 for the entire range of values accepted for N. Q is then updated at each insertion or destruction trial move between two configurations containing respectively N1 and
5 6 7 8 9 10 11 12 13 14 15 16 17 18 19 20 21 22 23 24 25 26 27 28 29 30 31 32 33 34 35 36 37 38 39 40 41 42 43 44 45 46 47 48 49 50 51 52 53 54 55 56 57 58 59 60
For Peer Review Only
N2 water molecules. If the move is accepted, Q(N2) is multiplied by a factor f (with f > 1) ; if the move is rejected, Q(N1) is multiplied by f. At the same time, a N-histogram H(N) is accumulated. The simulation is stopped when each bin has been visited at least 100 / ln f times, following Zhou and Batt [26]. At this time, the multiplicative factor is decreased, so that f → f . The histogram is reset to zero and a new cycle is started, until the histogram is flat again. This process is repeated until f reaches a small enough value. f is set to e1 for the initial cycle, and 20 cycles are made, so that the last value of f is approximately equal to exp(10-6). For small values of f (typically f < exp(10-4)), the “minimum visit per bin” criterion may be too restrictive and the simulation is stopped if the total number of MC moves is superior to 200000 / ln f .
Once Q(N) has been determined, one is able to compute Ω for the system, using:
Ω µ,V,T
(
)
= −kBT ln Q N( )
eβµN N∑
……… (3)For a given value of the chemical potential µ, the Landau free energy ΩL between two states containing respectively N1 and N2 molecules is:
ΩL
(
µ,N2)
− ΩL(
µ,N1)
= −kBT ln Q N( )
2 Q N( )
1 e βµ N( 2−N1) ………… (4)This allows to determine ΩL to within an additive constant. In our particular case it turns out that ΩL(µ,0) = 0 kJ.mol-1, since N = 0 corresponds to only one configuration for any value of µ. In what follows, we will be using the known µ(P) relationship for bulk water [6], in order to compute Ω (or ΩL) as a function of the external pressure of the reservoir.
RESULTS AND DISCUSSION
Equilibrium Monte Carlo simulations
In Figure 1, we report the results of the GCMC simulations for faujasite, LTA and β zeolites. For comparison sake, we also report the previously published data obtained in the case of silicalite-1 [6]. In all cases, a hysteresis loop is observed. The intrusion-extrusion
5 6 7 8 9 10 11 12 13 14 15 16 17 18 19 20 21 22 23 24 25 26 27 28 29 30 31 32 33 34 35 36 37 38 39 40 41 42 43 44 45 46 47 48 49 50 51 52 53 54 55 56 57 58 59 60
For Peer Review Only
phenomenon in the silicalite-1 has been studied earlier in some details [6,12], and the simulation results were found to agree well with the available experiments. Experimental work is still in progress for the other zeolites. As seen in Figure 1, water intrusion is shifted to higher pressure, in going from faujasite to LTA, β and then silicalite-1. This can be understood in terms of an increased water confinement. In what follows we examine in more details the nature of the condensation transitions, in order to better understand the underlying physics that causes intrusion to be such an abrupt process.
Thermodynamic analysis of the intrusion transition
We report in Figure 2 the free energy ΩL as a function of the number of intruded water molecules for various pressure, at 300 K. All systems are characterized by the existence of a double potential well. At low pressure, the most stable state corresponds to the empty zeolite, and the filled state is metastable. Above a certain pressure, the filled state becomes the most stable one. The existence of two stable states is characteristic of a first-order transition between gas-like and liquid-like phases. The conversion between those two states is possible on a wide range of pressure as seen in Figure 3, but the system has to overcome a macroscopic energy barrier. Monte Carlo simulations proceed via microscopic moves. In a finite time Monte Carlo run, the most stable state may not be reached, and this is why hysteresis loops are observed.
It might appear surprising that a bulk fluid phase diagram can be extended in such a way, down to the nanoscale range. Indeed, it is common wisdom, in the adsorption community, that the usual bulk phase transitions do not exist anymore in micropores [27], and especially so in zeolites.This view is presumably valid for the adsorption of fluids that have a strong affinity with the adsorbent walls. It is typically the case in aluminosilicate zeolites which are archetypical hydrophilic solids18. In this latter case adsorption is characterized by a Langmuir Type I isotherm and not real phase transition takes place because the whole process is dominated by the water-surface interaction. The situation in which the fluid does not fully wet the pore surface is different. In this case, we believe that a first-order like condensation of the fluid can be observed, provided that the interconnected pore structure is 3-dimensional. In our first study of water condensation in silicalite-1, we observed that the transition occurred
everywhere in the porous solid, at the same pressure. Even though each channel portion of the presently studied zeolites forms a pseudo 1D confined system, in which a first-order transition
5 6 7 8 9 10 11 12 13 14 15 16 17 18 19 20 21 22 23 24 25 26 27 28 29 30 31 32 33 34 35 36 37 38 39 40 41 42 43 44 45 46 47 48 49 50 51 52 53 54 55 56 57 58 59 60
For Peer Review Only
is theoretically forbidden, the interconnected nature of the porous structure and the correlation between adjacent pores [28] ensures a 3D-like behaviour of confined water. The occurrence of such a first order-like transition has actually been predicted by Bichara and Pellenq [29,30] in the case of selenium adsorption in silicalite-1 zeolite.
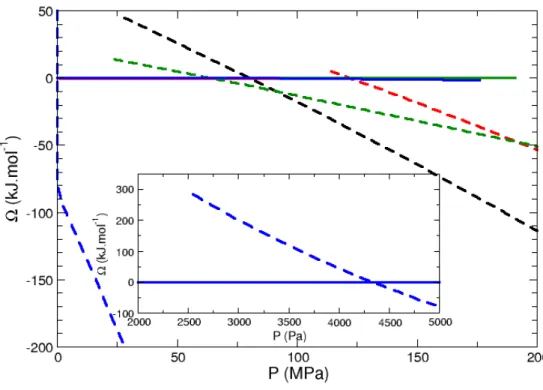
As seen in Figure 3, the equilibrium vapour-liquid state at 300K increases from faujasite to LTA, β and silicalite-1. This can be accounted for in the following way. In sufficiently wide pores the intrusion process can be described by the so-called Washburn equation [31]:
P = −2γLVcosθ
rP …….. (5)
where P is the hydraulic pressure that must be applied to the nonwetting liquid to penetrate a cylindrical pore of radius rP. γLV is the fluid-wall interfacial tension and θ the contact angle. One does not a priori expect that such a macroscopic equation be valid for pore radius in the nanometer scale. The qualitative trend however should be valid: the intrusion pressure should increase with the fluid confinement, i.e. with a decreasing pore radius. The porous volume in zeolites is irregular (channels and cages of different diameters). Given that we are dealing here with an equilibrium condensation transition that takes place above the bulk vapour pressure, we characterise the fluid confinement by computing the largest available spherical void in a given zeolitic framework. For the “cage” zeolites, the corresponding pore radius is rp =5.5 Å for faujasite, and rp =5.2 Å for LTA. For the “channel” zeolite, rp =3.0 Å for β and rp =2.5 Å for silicalite-1. The decreasing rp values, in going from faujasite to silicalite-1, are thus consistent with the increasing computed equilibrium transition pressures (faujasite: 4300 Pa; LTA: 64 MPa; β: 82 MPa; Silicalite-1: 122 MPa).
Confined water density
The density of confined water at full loading can be computed, using the equilibrium adsorption data and the knowledge of the available pore volume. The latter quantity can be computed using an approach similar to that of the calculation of Connolly surfaces [12,32]. Briefly, the simulation cell is mapped with a grid, and every single point of this grid is tested to see whether a test particle of radius RP can be inserted, without bumping into the pore walls 5 6 7 8 9 10 11 12 13 14 15 16 17 18 19 20 21 22 23 24 25 26 27 28 29 30 31 32 33 34 35 36 37 38 39 40 41 42 43 44 45 46 47 48 49 50 51 52 53 54 55 56 57 58 59 60
For Peer Review Only
(represented by the oxygen atoms, with a radius RO). If so, this point is counted as part of the
pore volume, as well as all the points of the grid located within RP of the tested point. The
values of RO and RP are chosen to be half of the Lennard-Jones diameter, i.e.: RO=1.5Å for the
framework oxygen and RP=1.577Å for water. The density of the liquid-like phase of confined
water within the different zeolites studied here is displayed in Table 1. Note that in the case of faujasite and LTA, only supercages are taken into account to compute the pore volume, since no water molecule was found in the sodalite cages in our simulations.
In all cases here, water density is less than that of bulk water for the same conditions of temperature and pressure. This is due to the fact that confinement prevents a regular 3-D ordering of water molecules. The most strongly depleted liquid-like fluid is observed in silicalite-1, which corresponds to the higher level of confinement, while the fluid density approaches the bulk value in the large cage faujasite zeolite. Intermediate values of the order of 0.85 are observed in the case of LTA and β zeolites. Water depletion near a hydrophobic wall is a feature that was theoretically predicted some time ago [33] but it is the first time, to our knowledge, that such a depletion of water in ultra-confined zeolite spaces is reported. This finding awaits direct experimental confirmation. However, the water density obtained using the computed adsorption data and the experimental porous volume extracted from nitrogen gas adsorption yields the same value of ~0.7 g.cm-3 for confined water in silicalite-1 [11].
5. Summary and conclusions
The behaviour of water in nanoporous hydrophobic solids was mostly studied up to now in the special (and important) case of porous carbon materials. The all-silica zeolites that solid-state chemists have been able to synthesize (faujasite for instance still awaits to be synthesized in its pure silica form) are well characterized solids, and can be prepared with almost no internal surface defects [6]. A combination of experiments [6,11] and molecular simulations, using such materials, enables to shed some new light on the water condensation process that takes place in hydrophobic solids.
The main conclusion of this study is that water condensation takes place through a genuine first-order phase transition, provided that the interconnected pores structure is 3-dimensional. We believe that this finding is very general for hydrophobic solids, i.e. for both nonwetting as well as wetting water-solid interface systems (the condensation transition being
5 6 7 8 9 10 11 12 13 14 15 16 17 18 19 20 21 22 23 24 25 26 27 28 29 30 31 32 33 34 35 36 37 38 39 40 41 42 43 44 45 46 47 48 49 50 51 52 53 54 55 56 57 58 59 60
For Peer Review Only
an intrusion transition in the first case and a classical capillary condensation in the second one). In the intrusion experiments, a rather high hydraulic pressure must be applied until the sudden fluid penetration takes place. This has lead to several interpretations of this phenomenon in terms of irreversibilities [9,10,34], especially since hysteresis was often observed in standard experiments such as mercury intrusion. Only recently has this process been examined in the light of equilibrium statistical thermodynamics. The similarity between capillary condensation of a wetting fluid and forced intrusion of a non wetting fluid was, for a long time, overlooked [13].
What we have shown here is that the most important features of the intrusion/extrusion process can be understood in terms of equilibrium thermodynamics considerations. Water intrusion is a first order vapour-liquid transition that takes place above the saturation vapour pressure because the water-solid interface in non-wetting. Finally, a strong depletion of confined water was predicted.
Acknowledgment. This work was supported by the French “Agence Nationale de la
Recherche”, under Contract BLAN06-3_144027. Fruitful discussions with Joël Patarin, Michel Soulard and Michael Trzpit are acknowledged.
References
[1] F.H. Stillinger, Structure in Aqueous Solutions of Nonpolar Solutes from the Standpoint of
Scaled-Particle Theory, J. Solution Chem. 2 (1973), pp. 141-158.
[2] Y. Cheng and P. Rossky, Surface topography dependence of biomolecular hydrophobic
hydration, Nature 392 (1998), pp. 696-699.
[3] K. Lum, D. Chandler and J.D. Weeks, Hydrophobicity at small and large length scales, J.
Phys. Chem. B 103 (1999), pp. 4570-4577.
[4] P. Ball, Water as an active constituent in cell biology, Chem. Rev. 108 (2008), pp. 74-108 [5] N. Giovambattista, P.G. Debenedetti and P.J. Rossky, Hydration behavior under
confinement by nanoscale surfaces with patterned hydrophobicity and hydrophilicity, J. Phys. Chem. C 111 (2007), pp. 1323-1332.
[6] M. Trzpit, M. Soulard, J. Patarin, N. Desbiens, F. Cailliez, A. Boutin, I. Demachy, and A.H. Fuchs, The effect of local defects on water adsorption in silicalite-1 zeolite: A joint
experimental and molecular simulation study, Langmuir 23 (2007), pp. 10131-10139.
5 6 7 8 9 10 11 12 13 14 15 16 17 18 19 20 21 22 23 24 25 26 27 28 29 30 31 32 33 34 35 36 37 38 39 40 41 42 43 44 45 46 47 48 49 50 51 52 53 54 55 56 57 58 59 60
For Peer Review Only
[7] J. Stelzer, M. Paulus, M. Hunger and J. Weitkamp, Hydrophobic properties of all-silica
zeolite beta, Micropor. Mesopor. Mater. 22 (1998), pp. 1-8.
[8] J.K. Brennan, T.J. Bandosz, K.T. Thompson and K.E. Gubbins, Colloids and Surf. A, 2001, 187-188, 539
[9] V. Eroshenko, R.-C. Regis, M. Soulard and J. Patarin, Energetics: A new field of
applications for hydrophobic zeolites, J. Am. Chem. Soc. 123 (2001), pp. 8129-8130.
[10] V. Eroshenko, R.-C. Regis, M. Soulard and J. Patarin, The heterogeneous systems
'water-hydrophobic zeolites': new molecular springs, J.C.R. Physique 3 (2002), pp. 111-119.
[11] N. Desbiens, I. Demachy, A.H. Fuchs, H. Kirsch-Rodeschini, M. Soulard and J. Patarin,
Water condensation in hydrophobic nanopores, Angew. Chem. Intl. Ed. 44 (2005), pp. 5310-5313.
[12] N. Desbiens, A. Boutin and I. Demachy, Water condensation in hydrophobic silicalite-1
zeolite: A molecular simulation study, J. Phys. Chem. B 109 (2005), pp. 24071-24076.
[13] F. Porcheron, P.A. Monson and M. Thommes, Modeling mercury porosimetry using
statistical mechanics, Langmuir 20 (2004), pp. 6482-6489.
[14] H. van Koningsveld, H. van Bekkum and J.C. Jansen, On the location and disorder of the
tetrapropylammonium (tpa) ion in zeolite ZSM-5 with improved framework accuracy, Acta Cryst. B 43 (1987), pp. 127-32.
[15] J.M. Newsam, M.M.J. Treacy, W.T. Koetsier and C.B. Degruyter, Structural
characterization of zeolite-beta, Proc. Roy. Soc. 420 (1988), pp. 375-405.
[16] C. Baerlocher, W.M. Meier and D.H. Olson, Atlas of Zeolite Structure, 5th rev. ed., Elsevier, Amsterdam, 2001. http://www.iza-structure.org
[17] A.N. Fitch, H. Jobic, and A. Renouprez, Localization of benzene in sodium-Y zeolite by
powder neutron-diffraction, J. Phys. Chem. 90 (1986), pp. 1311-1318.
[18] A. Di Lella, N. Desbiens, A. Boutin, I. Demachy, P. Ungerer, J.-P. Bellat and A.H. Fuchs, Molecular simulation studies of water physisorption in zeolites, Phys. Chem. Chem. Phys. 8 (2006), pp. 5396-5406.
[19] D. Nicholson and N.Parsonage, Computer Simulation and the Statistical Mechanics of
Adsorption, Academic Press: New-York, 1982.
[20] D. Frenkel, and B. Smit, Understanding Molecular Simulations. From Algorithms to
Applications, 2nd ed., Academic Press: London, 2002.
5 6 7 8 9 10 11 12 13 14 15 16 17 18 19 20 21 22 23 24 25 26 27 28 29 30 31 32 33 34 35 36 37 38 39 40 41 42 43 44 45 46 47 48 49 50 51 52 53 54 55 56 57 58 59 60
For Peer Review Only
[21]F. Wang and D. Landau, Determining the density of states for classical statistical models:
A random walk algorithm to produce a flat histogram, Phys. Rev. E 64 (2001), 056101. [22] F. Wang and D. Landau, Efficient, multiple-range random walk algorithm to calculate
the density of states, Phys. Rev. Lett. 86 (2001), pp. 2050-2053.
[23] E. Kim, R. Faller, Q. Yan, N. Abbott, and J. de Pablo, Potential of mean force between a
spherical particle suspended in a nematic liquid crystal and a substrate, J. Chem. Phys. 117 (2002), pp. 7781-7787.
[24] N. Rathore, Q. Yan, and J. de Pablo, Molecular simulation of the reversible mechanical
unfolding of proteins, J. Chem. Phys. 120 (2004), pp. 5781-5788.
[25] M. Chopra, M. Muller, and J. de Pablo, Order-parameter-based Monte Carlo simulation
of crystallization, J. Chem. Phys. 124 (2006), 134102.
[26] C. Zhou and R. Bhatt, Understanding and improving the Wang-Landau algorithm, Phys. Rev. E 72 (2005), 025701.
[27] F. Rouquerol, J. Rouquerol and K. Sing, Adsorption by powders and porous solids, Academic Press, 1999.
[28] R. Radhakrishnan and K.E. Gubbins, Quasi-one-dimensional phase transitions in
nanopores: Pore-pore correlation effects, Phys. Rev. Lett. 79 (1997), pp. 2847-2850.
[29] C. Bichara, J.Y. Raty and R.J.M. Pellenq, Adsorption of selenium wires in silicalite-1
zeolite: a first order transition in a microporous system, Phys. Rev. Lett. 89 (2002), 016101-1-4.
[30] C. Bichara, J.Y. Raty and R.J.M. Pellenq, A thermodynamic investigation of selenium
confined in silicalite zeolite, Mol. Simul. 30 (2004), pp. 601-606.
[31] E.W. Washburn, The dynamics of capillary flow, Phys. Rev. 17 (1921), pp. 273-283. [32] V.P. Sokhan, D. Nicholson and N. Quirke, Transport properties of nitrogen in single
walled carbon nanotubes, J. Chem. Phys. 120 (2004), pp. 3855-3863.
[33] D. Chandler, Hydrophobicity: Two faces of water, Nature 417 (2002), p. 491.
[34] L. Coiffard, V.A. Eroshenko and J.-P. Grolier, Thermomechanics of the variation of
interfaces in heterogeneous lyophobic systems, AIChE Journal 51 (2005), pp. 1246-1257.
5 6 7 8 9 10 11 12 13 14 15 16 17 18 19 20 21 22 23 24 25 26 27 28 29 30 31 32 33 34 35 36 37 38 39 40 41 42 43 44 45 46 47 48 49 50 51 52 53 54 55 56 57 58 59 60
For Peer Review Only
Figure 1. Water intrusion-extrusion isotherms computed through GCMC simulations at 300 K. Filled symbols refer to intrusion and open symbols to extrusion. Blue triangle curves: faujasite; green diamonds: LTA; black circles: β zeolite; red squares: silicalite-1.
For sake of clarity, the adsorbed quantities N in the case of faujasite is shown on the right axis. 5 6 7 8 9 10 11 12 13 14 15 16 17 18 19 20 21 22 23 24 25 26 27 28 29 30 31 32 33 34 35 36 37 38 39 40 41 42 43 44 45 46 47 48 49 50 51 52 53 54 55 56 57 58 59 60
For Peer Review Only
Figure 2. Computed free energy ΩL of the water-zeolite system for various pressure at 300K, as a function of the amount of intruded water;
a) β zeolite. The free energy profiles correspond to 20 MPa (upper curve), 50, 60, 80, 100, 110, and 150 MPa (lower curve)
b) Silicalite -1: the free energy profiles correspond to 100 MPa (upper curve), 110, 125, 130, 135, 140 and 150 MPa (lower curve)
c) Faujasite: the free energy profiles correspond to 1000 Pa (upper curve), 3450, 4050, 4800Pa, 10MPa, 50 and 100MPa (lower curve)
d) LTA: the free energy profiles correspond to 10 MPa (upper curve), 40, 60, 80, 100, 150 and 200 MPa (lower curve)
5 6 7 8 9 10 11 12 13 14 15 16 17 18 19 20 21 22 23 24 25 26 27 28 29 30 31 32 33 34 35 36 37 38 39 40 41 42 43 44 45 46 47 48 49 50 51 52 53 54 55 56 57 58 59 60
For Peer Review Only
Figure 3: Free energy minima of the water-zeolite systems as a function of pressure at 300K. Full lines: empty states, dashed lines: filled states.
Blue: faujasite; green: LTA; black: β; red: silicalite-1.
5 6 7 8 9 10 11 12 13 14 15 16 17 18 19 20 21 22 23 24 25 26 27 28 29 30 31 32 33 34 35 36 37 38 39 40 41 42 43 44 45 46 47 48 49 50 51 52 53 54 55 56 57 58 59 60
For Peer Review Only
Table 1: Number of adsorbed water molecules per unit cell at full loading, computed pore
volume with RP=1.577Å, and computed density of the confined water.
Zeolite <N>/uc VP (Å3.uc-1) ρconf (g.cm-3)
Silicalite-1 41 1796 0.68 Zeolite β 56 1885 0.89 LTA * 21 754 0.83 Faujasite * 235 7256 0.97
* Only supercages are taken into account to compute the pore volume
5 6 7 8 9 10 11 12 13 14 15 16 17 18 19 20 21 22 23 24 25 26 27 28 29 30 31 32 33 34 35 36 37 38 39 40 41 42 43 44 45 46 47 48 49 50 51 52 53 54 55 56 57 58 59 60