Pour l'obtention du grade de
DOCTEUR DE L'UNIVERSITÉ DE POITIERS UFR de médecine et de pharmacie
Laboratoire pharmacologie des anti-infectieux (Poitiers) (Diplôme National - Arrêté du 7 août 2006)
École doctorale : Biologie-santé - Bio-santé (Limoges) Secteur de recherche : Pharmacie
Présentée par :
Matthieu Jacobs
Développement de modèles pharmacocinétiques et
pharmacodynamiques pour l optimisation du traitement
des infections à bactéries à gram négatif multi-résistantes
Directeur(s) de Thèse : William Couet, Nicolas Grégoire
Soutenue le 09 novembre 2015 devant le jury
Jury :
Président Katy Jeannot Maître de conférences, Université de Franche-Comté Rapporteur Xavier Declèves Professeur des Universités, Université Paris Descartes Rapporteur Alain Bousquet-Mélou Professeur, École nationale vétérinaire de Toulouse Membre William Couet Professeur des Universités, Université de Poitiers Membre Nicolas Grégoire Maître de conférences, Université de Poitiers Membre Anne Geneteau Chef de projet pharmacocinétique, CEVA, Libourne
Pour citer cette thèse :
Matthieu Jacobs. Développement de modèles pharmacocinétiques et pharmacodynamiques pour l optimisation du traitement des infections à bactéries à gram négatif multi-résistantes [En ligne]. Thèse Pharmacie. Poitiers : Université de Poitiers, 2015. Disponible sur Internet <http://theses.univ-poitiers.fr>
THESE
Pour l’obtention du Grade de
DOCTEUR DE L’UNIVERSITE DE POITIERS
(Faculté Médecine et Pharmacie)
(Diplôme National - Arrêté du 7 août 2006)
Ecole Doctorale :
n°524 Bio-santé du PRES Limousin-Poitou-CharentesSecteur de Recherche : Pharmacie
Présentée par :
Matthieu JACOBS
Développement de modèles pharmacocinétiques et
pharmacodynamiques pour l’optimisation du traitement des
infections à bactéries à Gram négatif multi-résistantes
Directeurs de Thèse :
Professeur William COUET
Docteur Nicolas GREGOIRE
Soutenue le 09 Novembre 2015
Devant la Commission d’Examen
JURY
Professeur Alain BOUSQUET MELOU
Rapporteur
Professeur William COUET
Examinateur
Professeur Xavier DECLEVES
Rapporteur
Madame Anne GENETEAU
Examinateur
Docteur Nicolas GREGOIRE
Examinateur
2
U
UN
NIIVVEERRSSIITTEEDDEEP
PO
OIITTIIEERRSSFaculté de Médecine et de Pharmacie
Année universitaire 2015-2016
PHARMACIE
Professeurs
CARATO Pascal, Chimie Thérapeutique COUET William, Pharmacie Clinique FAUCONNEAU Bernard, Toxicologie GUILLARD Jérôme, Pharmaco chimie IMBERT Christine, Parasitologie
MARCHAND Sandrine, Pharmacocinétique OLIVIER Jean Christophe, Galénique PAGE Guylène, Biologie Cellulaire
RABOUAN Sylvie, Chimie Physique, Chimie Analytique SARROUILHE Denis, Physiologie
SEGUIN François, Biophysique, Biomathématiques
Maîtres de Conférences
BARRA Anne, Immunologie-Hématologie BARRIER Laurence, Biochimie
BODET Charles, Bactériologie BON Delphine, Biophysique BRILLAULT Julien, Pharmacologie CHARVET Caroline, Physiologie
DEBORDE Marie, Sciences Physico-Chimiques DEJEAN Catherine, Pharmacologie
DELAGE Jacques, Biomathématiques, Biophysique DUPUIS Antoine, Pharmacie Clinique
FAVOT Laure, Biologie Cellulaire et Moléculaire GIRARDOT Marion, pharmacognosie, botanique,
biodiversité végétale
GREGOIRE Nicolas, Pharmacologie GRIGNON Claire, PH
HUSSAIN Didja, Pharmacie Galénique INGRAND Sabrina, Toxicologie
MARIVINGT-MOUNIR Cécile Pharmaco chimie
PAIN Stéphanie, Toxicologie RAGOT Stéphanie, Santé Publique RIOUX BILAN Agnès, Biochimie
TEWES Frédéric, Chimie et Pharmaco chimie THEVENOT Sarah, Hygiène et Santé publique THOREAU Vincent, Biologie Cellulaire
WAHL Anne, Pharmaco chimie, Produits naturels
PAST - Maître de Conférences Associé
DELOFFRE Clément, Pharmacien HOUNKANLIN Lydwin, Pharmacien
Professeur 2nd degré
DEBAIL Didier
Maître de Langue - Anglais
JORDAN Steven
Poste d’ATER
COSTA Damien
Poste de Moniteur
3
Remerciements
Ce projet de thèse a été un projet de 3 ans, pendant lequel j ai e o t u e e eilleuse uipe poite i e, ui a paul e et a pe is de me construire en tant que scientifique. Ce projet est avant tout un travail d uipe e a e des pe so es formidables, qu elles soient assurées de mon profond respect et de toute ma gratitude.
Professeur Alain Bousquet Mélou ous a ez o u a a t mes débuts en pharmacocinétique sur les bancs
de l ole t i ai e et vous avez été le premier à me faire découvrir cette discipline, je suis très honoré que vous ayez accepté de rapporter cette thèse.
Professeur Xavier Declèves, je vous remercie d a oi a ept de rapporter ce travail et pou l i t t ue
vous y porterez, soyez assuré de toute ma reconnaissance.
Docteur Katy Jeannot, u e pa tie de e t a ail de th se a t possi le ue g â e à os t a au e
microbiologie, je vous remercie de e fai e l ho eu de pa ti ipe à e ju .
Madame Anne Geneteau, est u plaisi ue ous a ez a ept de pa ti ipe à e ju , so ez assu e de
toute ma reconnaissance.
Je remercie le Professeur William Couet, o di e teu de th se, pou a oi a epté au sein de son unité. Pe da t es a es, ous a ez paul et o seill , ous a ez app is à p e d e du e ul fa e à es uatio s et voir une étude dans sa globalité. Je vous remercie pour tous vos conseils, soyez assuré de mon profond respect.
Je remercie Nicolas Grégoire, mon co-di e teu , pou sa patie e, sa dispo i ilit , pou a oi o seill et soute u. J ai app is o e t à tes ôt s, sois assuré de mon profond respect.
Je remercie Sandrine Marchand, a e ui j ai eu le plaisi de t a ailler sur les études in-vivo. Je te remercie pour ton aide, pour ta rigueur et tes conseils. Tu as toute ma gratitude.
Je remercie Isabelle Lamarche pour son aide précieuse. Ton calme, ta patience, ta disponibilité ont été indispensables lors de nos études. J ai p is eau oup de plaisi à travailler à tes cotés.
Je e e ie toute l uipe de l U 7 pou leu aide, leu s conseils et pour la bonne ambiance : Patrice, Christophe, Jean-Christophe, Julien, Frédérique, Julian. Un merci spécial à Agnès et Murielle, pour leur amitié.
Je remercie tous mes amis doctorants de Poitiers : Alexia, Alexis, Sophie, Pamela, Guillaume, Anne-laure, Ale ,… ai si ue es a is d Uppsala, “ali et A e-Gaëlle pour toutes nos discussions scientifiques et pour les agréables moments que nous avons partagés.
5
Contents
I. Introduction ... 6
A. Bacterial resistance development ... 7
1. Mechanism of resistance... 7
2. Acquisition and transfer of resistance ... 8
3. Fitness cost ... 10
B. PK/PD methods used in optimizing dosing ... 11
1. Minimum inhibitory concentration (MIC) ... 11
2. In-vitro time-kill studies ... 12
a) The different settings ... 12
b) Quantification of bacterial count ... 14
3. PK/PD indices... 15
4. PK/PD modelling ... 16
C. Colistin the last line of defense ... 20
1. PK of colistin ... 21
a) PK in animals ... 21
b) PK in critically ill patients ... 22
2. PD of colistin ... 23 a) Mechanism of action ... 23 b) PD parameters values ... 24 3. Resistance to colistin ... 25 II. Aims ... 26 III. Studies ... 27
A. Colistin and aerosol delivery ... 28
B. Colistin and Hemodialysis ... 47
C. In-silico evaluation of resistance models ... 62
D. PK/PD of colistin and bacterial resistance ... 86
IV. Discussion ... 107
V. Conclusion ... 117
6
I.
Introduction
For more than 70 years, antibacterial drugs have been regarded as the best human-made products to cure infections. Discovered in 1928 by Alexander Fleming, penicillin was the first antibacterial drug and a fabulous advance in medicine that saved millions of lives1,2. Due to their efficacy towards infections, antibiotics are largely
consumed, in 2012, 3000 tons of antibacterial drugs were sold in EU for human medicine, and 8000 tons for veterinary medicine3. Unfortunately the use of antibiotics is also a major factor increasing the development of
bacterial resistance. During his Nobel Prize speech in 19454, Alexander Fleming, warned that bacteria could
become resistant to these remarkable drugs. Indeed the development of each new antibacterial drug has been followed by the detection of resistance to it. The development of resistance is a normal evolutionary process for microorganisms, but it is accelerated by the selective pressure exerted by the use of antibacterial drugs. Until 1980s the development of resistance was counteracted by discoveries of new classes of antibiotics active towards these resistant bacteria. However the last new classes of antibacterial drugs were discovered during the 1980s, and during the last 30 years bacterial resistance continued to develop without new barrier to slow this process down. The development of bacterial resistance has actually lead to bacteria resistant toward all known antibiotics, called pan resistant bacteria, that constitute a serious threat towards human health.
In 2014, the World Health Organization (WHO) published the first global report on antibiotic resistance with data from 114 countries5. Almost one year later, in February 2015, the European Centre for Disease Prevention and
Control (ECDC), the European Food Safety Authority (EFSA) and the European Medicines Agency (EMA) published the first joint ECDC–EFSA-EMA report on consumption of antimicrobials and antimicrobial resistance in animals, food and humans3. The major point of these reports is that resistance of bacteria is a serious threat that is now
observed in every region of the world and possesses the potential to affect anyone. Moreover these resistances concern common bacteria as Escherichia coli, Klebsiella pneumoniae and Staphylococcus aureus, usually encountered with health-care associated and community-acquired infections. The major cause of antimicrobial resistance in humans remains the inappropriate use of antibiotics. Therefore one of the major areas for management, control and prevention of antimicrobial resistance is the prudent use of antimicrobials5.
7 This thesis focuses on the development of pharmacokinetics and pharmacodynamics models for antibiotics in order to improve the treatment of infections in critically ill patients. Pharmacometrics is a quantitative science using mathematical and statistical methods to characterize, understand, and predict drugs pharmacokinetics (PK) and pharmacodynamics (PD). PK describes the relationship between dose and concentration with time, which takes into account drugs absorption, distribution and elimination. PD describes the relationship between concentration and effect, including therapeutic but also adverse effects. PK and PD models are linked together and resulting PK-PD models are powerful tools to describe and predict the time course of drug effect under various circumstances. These models are increasingly used to fit experimental and clinical data and some of these analyses are mandatory to the development of new drugs.
A.
Bacterial resistance development
1. Mechanism of resistance
Antimicrobial resistance is the resistance of a microorganism to an antimicrobial drug that was originally effective for treatment of infections caused by it5. The mechanism of resistance, describing modifications occurring in sensitive bacteria to become resistant, depends mostly of the strain and of the antibiotics. At the moment numerous mechanisms have been described, that can be categorized into 4 patterns: inactivation of the antibiotic by bacterial enzyme, limitation of membrane passage by decrease of its permeability or by drug efflux pump, or modification of the drug target6.
The first mechanism of resistance described was the inactivation of the drug before it can reach its site of action. It was encountered since 19457,8 with β-lactams, that were hydrolyzed a te ial e z es alled β-lactamases. These antibiotics englobe penicillins, cephalosporins, cephamycins, carbapenems and monobactams, they are the antibiotics the most used in the world. In 2012, in UE, 2110 tons of β-lactams drugs were sold (e.g. 63 % of the antibiotics). Therefore resistance toward this class of antibiotics has a great impact on human health. In order to counteract this resistance, two strategies have been used: the development of new β-lactams with the ability to
8 escape β-lactamases or an association between a known β-lactam and a β-lactamase inhibitor, such as clavulanic acid, a naturally p odu ed β-lactamase inhibitor discovered in 19769. Unfortunately bacteria have endlessly
produced new enzymes over time. Nowadays hu d eds of β-lactamases have been discovered and classified using schemes based on function (the system of Bush-Jacoby-Medeiros10,11) or structure (Ambler classification12). One of the last enzyme discovered is a metallo-β-lactamases named 'New Delhi' which is coded by the NMD-1 gene carried on a plasmid, that provides resistance to all β-lactams13 excepted to monobactam. This resistance presents
a threat toward human health and its expansion is under surveillance by health agencies.
Another strategy employed by bacteria is to limit the passage of antibiotics through the membrane and so to limit access to their site of action. This can be obtained by modification of entry channels such as porins14 (e.g. OmpF
porin and quinolone resistance in E. coli15-17 or OprD and carbapenem resistance in P. aeruginosa18,19) or by
reduction of their number. Bacteria can also enhance the efflux of drug by pumping them out of the intracellular environment, via efflux systems such as MexEF-Oprn20,21 or AcrAB–Tolc22-24, that both contribute to multi-drug
resistant in some bacterial strains. To overcome this resistance, it would be necessary to increase the dose, in order to achieve efficient concentration at the action site.
Last, bacteria can also modify the drug target (e.g. mutation in the ribosomal protein RpsL that confers resistance to streptomycin25). Just by itself a modification of the target can lead to low resistance but when cumulated with
other mechanisms, high resistance can appear26, that will render the drug inefficient. As an example
fluo o ui olo e esista e a e att i uted to utatio s ithi the d ug s ta gets, DNA g ase a d topoisomerase IV27,28.
2. Acquisition and transfer of resistance
Despite the variety of mechanism described, resistances can be intrinsic or acquired as a result of mutation in DNA or by ho izo tal t a sfe of ge eti ate ial aked DNA, plas ids, a te iophage …6,29.
9 A mutation is a spontaneous change in the DNA sequence that can change the natural expression of the gene coded by the sequence. A mutation on a gene coding for a protein can for example alter its structure and therefore provide resistance towards antibiotic targeting this protein. A mutation in the quinolone-resistance-determining-region coding for the DNA gyrase would provide a resistance toward quinolone, by modifying the structure of its action site30,31. A mutation can be partially characterized by the mutation rate of the bacteria which is an
estimation of the rate per generation of mutation in the genome (or in specific area for a specific mutation). Derived from this definition, the frequency of mutation is the ratio of mutant in a given population at a given time32. The mutation rate depends on multiple factor such as the bacterial strain, the antibiotics used33 or the environment of the bacteria32,34.
Another way for bacteria to acquire resistance is by swapping genetic material with neighboring bacteria, this process is called horizontal gene transfer. Depending on the nature of the transfer, it is called transformation, transduction or conjugation. Transformation involves direct uptake and incorporation of short fragments of naked DNA35. Transduction involves transfer of DNA from one bacterium into another via bacteriophages. The size of the
DNA fragment is limited by the phage head size36,37. Conjugation involves transfer of DNA mediated by conjugal
plasmids or conjugal transposons, it requires cell to cell contact and can transfer long fragment of DNA38. Thus, the size of DNA fragment that can be transferred depends on the process involved and several genes providing resistance against various drugs or against one drug by different mechanisms is possible. For instance a mutation modifies only one gene already present in the bacteria and change its expression whereas extended-spectrum beta-lactamases (ESBLs) are plasmid-associated enzymes found in Enterobacteriaceae that provides resistance against multiple drugs39
.
Both mutation and horizontal gene transfer provoke a modification of the bacterial genome in order to provide a drug resistance. However, a resistance can also be native and the acquisition of this resistance will appear by the modulation of the expression of native genes, such as the over-expression (up regulation) of genes coding for the MexXY/OprM efflux pump that provide resistance against aminoglycosides and fluoroquinolones in Pseudomonas
10 aeruginosa21,40, or the over-expression of pmrA gene that provide resistance against polymycins in Pseudomonas aeruginosa41. This kind of resistance is called adaptive resistance, since the resistance will be induced in the presence or drug and will reverse upon the removal of the antibiotics.
Mutation or horizontal gene transfer and adaptive resistance should not be opposed. A resistance native or obtained through mutation or horizontal transfer, reflects the mode of transmission of the resistance, whereas an adaptive resistance is a kind of resistance that mainly reflects the reversibility of the resistance. Thus resistances can be gathered in two types of antibiotic resistance, namely, heteroresistance and adaptive resistance14,42-45. A heteroresistance is considered stable and irreversible in a given bacteria. This resistance leads to a resistant subpopulation of bacteria which can be mixed with a sensitive subpopulation. The resistant subpopulation is usually in minority and would need higher drug concentration to be killed. An adaptive resistance describes a process evolving over time that is induced by the presence of antibiotic and that reverses upon its removal. The reversibility of a resistance in a whole population will be discussed in the next chapter (I.A.3 Fitness cost).
Moreover an adaptive resistance can be acquired by horizontal gene transfer, such as the transmission of plasmid with gene coding for efflux pump46,47. A mutation can also occur on gene coding for an adaptive resistance and therefore modify its comportment (e.g. Mutation in the PmrB in Pseudomonas aeruginosa and colistin resistance48). In this case the mutation may split the population into 2 sub-populations, mutants and not mutants,
and each one can produce an adaptive resistance. Therefore heteroresistance and adaptive resistances may be concomitant.
3. Fitness cost
The presence of an antibiotic resistance gene clearly benefits to bacteria when the corresponding antibiotic is present. However the acquisition of antibiotic resistance may also be associated with a physiological cost for the bacteria, called fitness cost49-51. This cost could be due to the energetic burden caused by the synthesis of new proteins, the over expression of genes or to the production of impaired proteins necessary to the bacteria
11 physiology. It is usually measured by a diminution of the growth rate52-54, but it can also induce other deleterious effect as an impaired mobility55.
A major impact of fitness cost would be the possible reversibility of the resistance in a population when a reduction of the pressure of selection occurs. This means that without pressure of selection (e.g. without antibiotic), a sensitive population would better fit in the new environment than a resistant population. Therefore the sensitive population would grow faster and would result in a drop in the frequency of resistant bacteria measured in isolates56. However this reversibility is variable, in particular because
the fitness cost, which varies with the bacteria and the type of resistance. It may be high57 or very low and even inexistent58. But bacteria can
also adapt to the fitness cost with compensatory mutation occurring to prevent the fitness cost without loss of resistance56,59,60. Although compensatory mutations are limited61, the reversibility of resistance due to fitness
cost remains difficult to estimate.
B.
PK/PD methods used in optimizing dosing
There are both experimental and clinical evidence to support that dosing schedule may influence resistance development and that dosing regimen may be optimized by proper use of PK/PD62-64. In this chapter, some PD and PK/PD methods and parameters will be presented. Those include minimum inhibitory concentration, PK/PD indices and description of the full time course of concentration and effect using PK/PD modeling.
1. Minimum inhibitory concentration (MIC)
The MIC is defined as the lowest static concentration (constant concentration with time) of antibiotics that inhibits the visible growth of bacteria after overnight incubation. The method consists in the preparation of a range of antibiotic concentrations, usually two-fold serial concentration dilutions, followed by the addition of an inoculum corresponding to approximately 5x10⁵ colony-forming units (CFU)/mL. The tubes are then incubated depending on
the strain for 18 to 24 hours. Then the MIC is defined as the lowest concentration of antibiotic at which there is no turbidity (no visible growth) of the microorganism, which usually happens at approximately 107 CFU/mL65.
12 During several decades MIC was predominantly used to predict antibiotic efficacy and dosage regimen were adjusted to obtain minimal plasma concentrations equal or higher than MIC. It is still consider as a gold sta da d by microbiologists to determine bacterial susceptibility to antimicrobials65. Despite its popularity MIC presents
several disadvantages as a PD parameter. It is a threshold value estimated by visual inspection observation of a two-fold serial concentration dilution which is poorly accurate. Furthermore MIC is determined at only one time point and therefore it neither provides information on the time-course of bacterial killing66-68 nor on the
emergence of resistance69,70. Another limitation is that MIC is determined at a single and relatively low initial
bacterial inoculum (i.e. usually in the absence of resistant populations)65, and do not provide information on a potential inoculum effect (e.g. the possible change of MIC with high inoculum71).
However the MIC remains a parameter easy to estimate and provides a quick comparison of the sensitivity of a particular strain toward various antibiotics. It can also be used in association with the mutant prevention concentration (MPC)72, the minimal concentration that allows no mutant recovery when more than 1010cells are
applied to drug-containing agar73. The MIC
99 and the MPC can be used to define a mutant selection window,
corresponding to a range of concentrations that would kill drug sensitive bacteria but not the resistant one and therefore potentially induce selection pressure64.
To overcome some of the MICs limitations, antimicrobial agents PD can be better studied by observing changes in CFU over time in the presence of a range of drug concentrations70,74-77.
2. In-vitro time-kill studies a) The different settings
Time-kill studies are performed in-vitro to assess the change of CFU with time after an initial bacterial inoculum has been exposed to various antibiotic concentrations. These experiments are easier to perform than in-vivo experiments, and allow a greater flexibility in the study design. Depending on the aim of the study, the design can be drove to assess the effect of one or several antibiotics in combination78,79, to evaluate the influence of the
13 inoculum size on the drug effect74,80, or the effect of changing broth composition to assess the mechanism of resistance of a bacteria81 …. . A wide variety of experimental setups have been described and thanks to a
controlled environment, results are not affected by as many factors of variability as during in-vivo experiments (immune system or drug disposition, lo al i fe tio … . However extrapolation of in-vitro results to the in-vivo setting should be done with caution.
Noticeably in-vitro infection experiments 82 may use static70,74-77 or changing antibiotic concentrations to simulate
the dynamic time-course of concentrations observed in patients 69,83-85. It is also possible to mix these approaches.86-88 These experimental settings provide information on the time-course of antibiotic effects and the development of resistance and are well suited to develop PK/PD models that will be presented later 89. The latter
mathematical models can characterize bacterial killing and resistance 67 and optimize antibiotic dosage regimens.
Static concentration time-kill studies 82 are efficient and cost-effective and allow studying a large range of antibiotic concentrations. Yet they present several potential drawbacks. Antibiotics such as β-lactam antibiotics are not very stable and may be degraded with time, which needs to be considered and possibly corrected for, seriously complicating the approach. Another potential problem comes from the fact that growth medium nutrients may get depleted or/and toxic bacterial metabolites may accumulate over time, which may have an effect on bacterial growth or death. Therefore performing static concentration time-kill studies over more than 24 h may require to change the growth medium regularly (e.g. every 24 h), increasing the amount of work.
Dynamic in-vitro infection settings such as the one-compartment and hollow-fiber systems can mimic human PK 67, by changing drug concentrations thanks to the introduction of fresh broth medium using various
pumps. The control of these flow rates permits to simulate different half-lives of drugs and also allows the elimination of toxic bacterial metabolites. Therefore, these dynamic experiments are often run over several days or even weeks 90, 91 and typically use multiple dosing 92. However the simplest systems use filters leading to clotting problems which depending on the bacteria may be almost impossible to solve. The advantage of hollow-fiber systems is that they do not present this limitation. However their disadvantage is their elevated cost. Therefore
14 these dynamic in-vitro settings may complement and validate results of initial experiments conducted with static concentration time-kill conditions before translation to animal studies and ultimately to patients.
b) Quantification of bacterial count
Time-kill studies are based on the quantification of bacterial counts over time.For bacterial quantification, various dilutions are prepared for each sample and spread onto agar plates either manually or automatically with a spiral platter. After 18 to 24 h of incubation at a given temperature (usually 37°C), the number of colony is counted manually or with an automated colony counter93,94. An image analysis of a plate photography may also be done. The lower limit of quantification is usually in the range of 10–400 CFU/ml70,75,95. However the antibiotic present in
the broth may be plated on agar along with bacteria, especially after bacteria have been exposed to high concentrations, , inhibits bacteria growth and therefore bias the bacteria count. This phenomenon is known as the carryover effect96. To minimize this effect the sample may be centrifuged and then reconstituted with sterile saline to the original volume. The characterization of heteroresistance, also called population analysis profile (PAP), can be performed by counting irreversible resistant subpopulations of bacteria, onto agar plates supplemented with the corresponding antibiotic at different concentrations 74,97.
Bacterial count on agar plates is the gold standard method to determine the bacterial load. Alternative methods of quantification exist, such as the real time PCR98 or flow cytometry99,100, but they require specific equipment. These methods require an extraction of the bacteria from the environment (broth for vitro studies and tissues for in-vivo studies) and the sample may be altered during this analytic process. The bioluminescence technique is a non-destructive, real-time reporter of bacterial metabolism that can be used to monitor the effect of antimicrobials and to quantify the bacteria101,102. This technique uses microorganisms expressing the lux operon which emit light, as a result of the activity of bacterial luciferase in metabolically active bacteria103,104. The advantages of this
15 each time of measure. However an imaging device is needed and the insertion of the lux operon may modify the sensibility of the bacteria to the antibiotic. Yet these bioluminescent strains may be used for academic research.
3. PK/PD indices
In the 1940s and 1950s, Eagle et al.112-114 investigated the dose-activity relationship between bactericidal
antibiotics and bacteria, and identified different patterns of bactericidal activity. The first pattern was observed with penicillin that showed no improvement of bactericidal activity despite increasing the dosage above a certain level. This pattern corresponds to time-dependent antibiotics such as i β-lactams and macrolides. The saturation of the killing rate occurs at relatively low concentrations, usually four or five times the MIC. The second pattern was observed with aminoglycoside, for which an increase of the antibiotic concentration led to a more rapid killing of the bacteria. This corresponds to concentration-dependent antibiotics, including aminoglycosides and fluoroquinolones. The investigations made by Eagle et al. were the first demonstration that MIC is not enough to describe bacterial activity and that the pharmacokinetics of the antibiotics need to be taken into account to have a better understanding of the antibiotics activity and to define precise targets. Vogelman et al115 and Craig66
investigated the PK/PD relationship of antibiotics and defined three PK/PD indices based on a measure of the drug exposure and the MIC of the bacteria. The terminology of these PK/PD indices have been standardized116 into fAUC/MIC, fCmax/MIC and fT>MIC. The fAUC/MIC is the area under the unbound concentration–time curve over
24h divided by the MIC; fCmax/MIC is the unbound peak concentration divided by the MIC and fT>MIC is the
cumulative percentage of time over 24h when the unbound drug concentration is above the MIC.
The determination of the best PK/PD index describing the effect of an antibiotic on a bacteria is obtained by plotting bacterial counts (e.g. log10 CFU/mL) measured at one specified time (e.g. 24h) versus the value of each the three PK/PD indices. The lassifi atio of the a ti ioti as ti e depe de t o o e t atio depe de t
16 depends on the index that better fits the pharmacodynamic endpoint when assuming the following sigmoidal EMAX model:
Equation 1
Where E is the summary PD endpoint (e.g. log10 CFU/mL), E0 is the effect representing the value of the PD
endpoint without drug treatment, X is one of the PK/PD indices, PDmax is the maximum effect obtained when
increasing exposure results in no further killing, EX50 is the magnitude of X that is needed to achieve 50% of PDmax
and γ is the sig oïdicity factor.
Numerous studies have been conducted mostly in mice in order to identify the best PK/PD indices for antibiotics on pathogens using different conditions of experimentation. These studies showed that the a ti it of β-lactams was dependent on fT>MIC115,117,118, that of aminoglycosides and fluoroquinolones dependent on either fCmax/MIC
or fAUC/MIC 115,119,120 and that of glycopeptides and macrolides was considered as dependent on fT>MIC66 although more recent studies suggest that they rather depend on fAUC/MIC121 .
At the moment PK-PD indices are considered as the gold standard to evaluate the PK-PD of antibiotics and their evaluation is recommended by the regulatory agencies (EMA, FDA)122 for new antibiotics. Once the PK/PD index of an antibiotic for a bacteria is determined, a target is defined in order to achieve the desired bactericidal effect (e.g.: fCmax/MIC > 6 or (fT >MIC)>80%). Then simulations of the antibiotic concentrations versus time profiles can be performed, using previously estimated PK parameters, in order to select a dosing regimen that permits to attain the defined target. These simulations can also take into account the variability in PK and in PD (MIC distribution) through Monte-Carlo methods.
4. PK/PD modelling
The PK/PD indices are summary endpoints based on the MIC, which do not provide any information on the time course of antimicrobial activity. Therefore a lot of information is lost in the process of generating these endpoints,
17 such as the regrowth of bacteria that can be observed after an initial decay although the antibiotic concentration is kept constant, and suggesting a changing effect with time. These complexities can be analyzed by a modeling approach that allows description of the full time course of antimicrobial activity.
The simplest PK/PD model was originally proposed by Zhi et al123. It is composed of a compartment representing a single bacterial population (S) with and exponential growth characterized by a growth rate constant (kgrowth) and a
natural death rate constant (kdeath), as presented in Equation 2:
k
S
dt
dS
growth
k
death Equation 2Where S is the bacteria concentration.
However there are usually insufficient data to separately estimate the growth and the natural death rate constants, therefore the apparent growth rate constant (kg = kgrowth – kdeath) is commonly reported in PK/PD
studies86,120. In the absence of antibiotics bacteria grow until a stationary bacterial level (Popmax) is reached. This self-limiting growth can be modeled by a logistic function89,124, as presented in Equation 3.
S
Popmax
S
1
k
dt
dS
g
Equation 3The antibacterial effect is generally modeled by a sigmoïdal Emax model, that could either inhibit the bacterial growth125,126 (Equation 4) or increase the bacterial killing127,128, as presented in Equation 5.
S
Popmax
S
1
C
IC
C
Imax
1
.
k
dt
dS
50 g
Equation 4
where Imax is the maximal rate constant of growth inhibition and IC50 the antibiotic concentration yielding 50% of kmax.
S
C
KC
C
kmax
Popmax
S
1
k
dt
dS
50 g
Equation 5
18 where kmax is the maximal rate constant of bacterial killing and KC50 the antibiotic concentration yielding 50% of kmax.
The emergence of resistance can be described by two different approaches. The most frequent approach is to assume that the total bacterial population is composed of several distinct subpopulations which differ in drug susceptibility83,129,130. The most part of the bacterial population is considered to be sensitive. A bacterial regrowth would be observed when the drug concentration is sufficient to kill the sensitive bacteria but not the resistant ones. An initial decay, attributed to the killing of the sensitive subpopulation, would be observed until the growing resistant population becomes predominant and induces a regrowth. The resistant subpopulation can be considered as present in the starting inoculum, when high inoculum is used83 (Equations 6 and 7).
S
C
KC
C
kmax
Popmax
R
S
1
k
dt
dS
50 g
With Initial S = Inoc*(1-PropR) Equation 6R
C
KC
C
kmaxR
Popmax
R
S
1
k
dt
dR
50 gR
With Initial R = Inoc * PropREquation 7
Where KgR is the apparent growth rate constant of the resistant population; kmaxR, the maximal rate constant of
bacterial killing in the resistant population; Inoc, the size of the inoculums and PropR, the proportion of resistant in the inoculum.
An alternative approach consists in considering a pure inoculum with only one bacterial population and to describe the mutation of these bacteria with a first order mutation rate83.
MutF.S
-S
C
KC
C
kmax
Popmax
R
S
1
k
dt
dS
50 g
With Initial S = Inoc Equation 8
MutF.S
R
C
KC
C
kmaxR
Popmax
R
S
1
k
dt
dR
50 gR
19 Where MutF is the mutation rate of the sensitive bacteria. Some models also used a first rate constant describing the transfer back from R to S. However most of these models estimated this constant negligible compared to mutF and set its value to zero75,83.
Mostly both approaches describe the bacterial resistance as an irreversible phenomenon. Resistant subpopulation is modelled as being less sensitive toward the antibiotic than the sensitive (wild) subpopulation. The resistance of the bacteria can be modelled through a lower kmax131 , a greater KC
50125or both83.
An adaptive resistance model has been proposed previously by Tam et al.90 and also by Nielsen et al132. In this case, all bacteria are initially considered sensitive. Decay is observed, when bacteria are put in presence of antibiotics. Concomitantly a gradual development of resistance occurs over time in function of the antibiotic concentration. The resistance gradually decreases the efficiency of the antibiotics towards bacteria until it becomes inferior to the natural growth rate and consequently a regrowth is observed. When treatment is interrupted the resistance phenomenon can be reversed. Nielsen et al.132,133 described this adaptive process with
two compartments, one describing the hypothetical amount associated to the absence of adaptation, ARoff, initially fixed to 1 and one describing the amount associated to the adaptation, Aron, initially fixed to 0. Upon colistin exposure transfers occurred between these two amounts, which affects the fraction of amounts in the two compartments. The transfers between ARoff and ARon for adaptive resistance are described in Equations 11 and 12. Kon and koff describe the rate of development and reversal of adaptive resistance, respectively.
Equation 10
Where Konslope is the resistance rate constant in the presence of colistin.
With initial ARoff = 1 Equation 11
20 In case of adaptive resistance the antibiotic effect is reduced by a function of the proportion of resistance development (Aron) powered by a parameter β (Equation 13).
KC
C
C
kmax
50
Equation 13
The antimicrobial effect can also be modelled in a more mechanistic way, as performed by Bulitta et al74, in a
model that describes the competitive binding between colistin, Mg2+ and Ca2+ to the outer bacterial membrane.
Another example is the modeling of the inoculum effect, defined as the reduced antibacterial drug effect observed against high bacterial population134. Nielsen et al.75,132 described the inoculum effect with a model that assumed
that growing bacteria can become resting (non-growing) as a function of the total density, whereas Bulitta et al.74,131 used a model describing cell-to-cell communication associated with quorum sensing.
C.
Colistin the last line of defense
Colistin, also known as polymycin E, is a cationic antimicrobial peptide, produced by some strains of bacteria, e.g.
Bacillius polymyxa. It is composed of at least 30 different compounds, mainly colistin A and colistin B135,136 and it is
administered as colistin methanesulfonate (colistimethate), its inactive prodrug. Having entered clinical use in 1959, colistin has been on the market for more than fifty years, but due to concern about nephrotoxicity and neurotoxicity137,138, it was replaced by antibiotics safer to use in the 1970s. However in the last decade colistin has
regained interest toward the medicine community for two reasons. Firstly bacterial resistance towards commonly used antibiotics have largely increased in all regions of the world during the last years in common bacteria. However due to its replacement in the 1970s, colistin did not exercised a pressure of selection during the last 30 years and still exhibits rapid and concentration dependent bacterial activity against Gram negative bacteria notably Pseudomonas aeruginosa. Secondly there is a limited number of alternatives due to the dry antimicrobial drug development pipeline leading to limited options against multidrug resistant bacteria. Nowadays colistin is used in the treatment against multidrug-resistant Gram-negative bacteria (MDR-GNB), including Acinetobacter baumannii,
21 Pseudomonas aeruginosa and Klebsiella pneumonia 135,137,139. However having entered clinical use in 1959, CMS/colistin was not developed with the same procedures that are now mandated by international drug regulatory agencies. As a result PK and PD information required to underpin prescribing recommendations in the product information is lacking. Colistin is prescribed in special populations such as critically ill patients whom specific illness can alter the pharmacokinetics of the drug and therefore its efficiency. Colistin and CMS can been removed from plasma in patients undergoing hemodialysis. CMS can also be aerosolized in patients with cystic fibrosis that suffer of pulmonary infection.
1. PK of colistin
The reliability and the accuracy of PK study depend on the quality of the data collected and especially on the analytical methods used to measure drug concentrations. CMS is unstable in plasma and common matrices and can spontaneously convert into colistin140. Therefore analytical assays should give both precise and specific
measures of colistin, i.e. distinguish colistin from its prodrug, CMS. Indeed CMS and colistin are undistinguishable by microbiological assay141 that was originally used142 . The recent development of chromatographic procedures such as HPLC with fluorimetric detection143 or liquid chromatography–tandem mass spectrometry
(LC-MS/MS)144,145 has permitted more accurate PK studies. However confusions were made due to the multiple ways
the CMS doses were reported in publications. In Europe and Asia, doses are expressed in number of internal units (UI) or/and in number of milliGrams of the chemical CMS (i.e. CMS sulfate). In the remaining global regions (USA, Aust alia … doses are expressed in number of milliGrams of colistin base activity (CBA), based on microbiological standardization146,147. One milliGram of CBA is not equivalent to one milliGram of CMS sulfate, thus doses
expressed in milliGrams can be misunderstood depending on the region of interest. Recommendations to authors have been made during the First International Conference on Polymyxins (Prato, Italy): to cease reporting doses in terms of milliGrams of CMS and to provide equivalence of the dose in the others units, such as one million of international units (MIU), are equivalent to 30 mg of colistin-based activity (CBA) or 80 mg of CMS sulfate147.
22 The first accurate assessments of colistin and CMS PK were obtained in rats after intravenous administration of colistin in 2003 148, and after intravenous administration of CMS in 2004149. The protein binding of the colistin was
determined by equilibrium dialysis and the unbound fraction of colistin estimated at 43-45%. A difference of binding between colistin A and B was noted with respectively a free fraction at 36% and 52%. The colistin elimination half-life in rats was 74.6 ± 13.2 min with less than 1 % of colistin being excreted unchanged in urine after colistin administration. However after CMS administration relatively large amounts of colistin were recovered in urine. Therefore the authors concluded that most of the colistin measured in urine was the result of post-excretion CMS hydrolysis. It was estimated that only 6.8% of the CMS dose was converted systemically into colistin. Finally CMS elimination half-life was estimated at 23.6 ± 3.9 min that was significantly shorter than that of colistin. These results were confirmed by other groups150, with some discrepancies about the exact fraction of
CMS converted into colistin, estimated at 15.5 % by Marchand et al150, confirming however that only a limited fraction of the CMS dose is actually converted into colistin. Marchand et al151 have also investigated the influence of the route of administration in rats, and estimated that after nebulization of CMS , two thirds of the CMS dose were directly absorbed in the systemic circulation, and one third was converted into colistin pre-systemically.
b) PK in critically ill patients
The first pharmacokinetic study performed in patients using HPLC to measure colistin concentrations was performed in 2003 by Li et al152 followed by Markou in 2008153. These two studies were performed in critically ill
patients, however one study simply described CMS and colistin PK at steady state and the other measured only colistin. A more complete PK study of colistin and CMS in critically ill patient was performed in 2009 by Plachouras et al154. In this study, colistin and CMS concentrations were measured in 18 patients after administration of CMS at
3 MUI every 8h. The model used to describe the concentrations was composed of 2 compartments for CMS and 1 compartment for colistin. The key findings of this study were a colistin half-life longer than that of CMS (14.4 h and 2.3 h respectively), a colistin plasma peak concentration achieved several hours (7h on average) post CMS administration, and a slow increase of colistin concentration after CMS administration. Therefore to attain a
23 threshold concentration at 2 mg/L, the authors have suggested the use of a 9 MUI loading dose (equivalent to 720 mg of CMS sulfate or 270 mg of CBA) . These results were confirmed in 2011 by Garonzik at al.155 in a PK study
conducted in 105 critically ill patients. In addition to the large number of patients included, Garonzik was able to identify some covariates explaining the inter-individual variability of some PK parameters such as the creatinine clearance on the clearances of CMS and colistin or the body weight on the volume of distribution of CMS. Although this study was conducted at steady-state and did not include concentrations measurements after the first CMS administration, the authors suggested a dosage regimen with a loading dose based on the weight and a maintaining dose based on the creatinine clearance. In 2011, Couet et al.156 performed the first PK study in healthy volunteers, with measures of colistin and CMS concentrations, in plasma and urine. The fraction of CMS excreted unchanged in urine was estimated for the first time in human, i.e. 70 %. Moreover in this study the authors described a relatively early colistin peak since time to peak was close to 2h post CMS administration. This observation was also made in 2014 by the same group in a study included 73 critically ill patients139. In this study, the authors estimated that the apparent volume of distribution of colistin was approximately 7-folds lower than previously published by Plachouras et al154, resulting in a shorter estimation of the colistin half-life (3.2 h vs 14.4h). This short half-life suggests that colistin steady state should be reached in few hours, which from a PK standpoint do not support the use of a loading dose (LD). However the use of a LD could be justified from a pharmacodynamics point of view since it should lead to high peak concentrations of colistin and therefore improve its efficiency, which constitutes the rational for such front-loading strategies157.
2. PD of colistin
a) Mechanism of action
Colistin, as a member of the polymycin family, is active against Gram negative bacteria. It presents a bactericidal effect with rapid killing rate138,158. Polymycins interact with the Lipopolysaccharides (LPS) of the outer membrane
of the Gram negative bacteria74,138,159 and displace Mg2+ and Ca2+ ions cross-bridging between adjacent negatively
24 molecules including the drug itself, as described by Hancock, in a self-promoting uptake model160. The polymycins
also interact with the phospholipid bilayer of the cytoplasmic membrane160-162 forming channels. The modification
of the cytoplasmic membrane permeability leads to leakage of cytoplasmic molecules and to bacteria death.
b) PD parameters values
As for other polymyxins, colistin exhibits a concentration dependent antibacterial effect138. It exhibits a median
MIC at 0.5 µg/mL for Acinetobacter baumannii and Klebsiella pneumonia (with a MIC90 at 1 µg/mL) strains and presents a median MIC at 1 µg/mL for Pseudomonas aeruginosa strains (with a MIC90 at 2µg/mL)163
. The effect of colistin on Pseudomonas aeruginosa has been correlated to fAUC/MIC in both in-vitro95 and in-vivo studies164. The target breakpoint has been estimated in-vitro between 22.6 and 30.4 depending on the strain 95. In-vivo, fAUC/MIC
targets required to achieve a 2-log kill were estimated between 27.6 and 36.1, in a thigh infection model, while the corresponding values were 36.9 to 45.9 in a lung infection model164. For example, a fAUC/MIC of 27.6 is equivalent to an average total concentration at steady state of 4.6 µg/mL, considering a MIC of 2 µg/mL and a free fraction of 50 %.
Although these estimations can help to determine effective dosage regimens, they do not provide any information about the emergence of resistance over time. Some PK/PD modeling studies have been performed in order to describe the full time course of the colistin efficacy. Bulitta et al74, have built a model that describes the
competitive binding between colistin, Mg2+ and Ca2+ to the outer membrane of Pseudomonas aeruginosa. In their mechanistic model they also described the resistance to colistin with the presence of three subpopulations in the inoculum. By contrast Mohamed et al.133 described the development of resistance as an adaptive process that is
developing over time and that can reverse. This later model was used to perform PK/PD simulations leading to recommend the use of a fixed loading dose followed by an 8 or 12 hourly maintenance dose.
25
3. Resistance to colistin
In 1966, Brown et al. demonstrated that low concentrations of Mg2+ decrease the activity of polymycin on
Pseumonas Aeruginosa81, therefore they described the first resistance to polymycin mediated by the growth condition of the bacteria. Seven years later, Gilleland et al. reported the first polymyxin adaptive resistance phenotype on Pseudomonas aeruginosa165. They described the acquisition of resistance to polymycins in bacteria
growing in non-Mg2+-limited medium containing polymycins. The resistance was correlated with architectural change in the outer membrane that decreases its permeability and therefore protects the cytoplasmic membrane toward polymyxins and antimicrobial peptides. They also described the loss of the resistance when the resistant bacteria grew in a medium without polymycins, and described the reversible phenotype of the resistance.
Since then, many studies have focused on the mechanism of the adaptive resistance. Two systems have been identified to play a major role in the resistance to polymycin: the PhoP/PhoQ system166 or the PmrA/PmrB
system41,167-170. Both systems are able to stimulate the transcription of PmrA-activated genes, conducting to a
modification of the LPS by addition of 4-amino-4-deoxy-L-arabinose (L-Ara4N) on the lipid A 167 . This modification decreases the negative charge of LPS (initial site of action of colistin) and causes polymycin resistance. Resistance to colistin and to polymycin have been identified and characterized in several Gram negative pathogens such as: Escherichia coli 171,172, Salmonella enterica173, Pseudomonas aeruginosa and Acinetobacter baumannii.
______________________________________________________________________________________________
26
II.
Aims
The general aim of this thesis was to describe the pharmacokinetic (PK) and the pharmacodynamics (PD) of colistin using a PK/PD modeling approach in order to provide better a understanding of PK and PD process to guide optimization of dosing regimens in some specific populations and different routes of administration.
The specific aims were:
- to describe the pharmacokinetics of colistin after CMS aerosol delivery for treating pulmonary infections in critically ill patients
- to assess colistin pharmacokinetics (PK) in intensive care unit patients requiring intermittent HD (ICU-HD)
- to compare the ability of static and dynamic in-vitro infection models to identify the t ue PK/PD model and to estimate model parameters accurately and precisely, using simulations
- To develop a semi-mechanistic PD model to characterize the reversible and/or non-reversible resistance of Pseudomonas aeruginosa occurring in the presence of colistin, using bioluminescence imaging.
______________________________________________________________________________________________
27
III.
Studies
This thesis is based on the following papers:
- Matthieu Boisson, Matthieu Jacobs, Nicolas Grégoire, Patrice Gobin, Sandrine Marchand, William Couet, Olivier Mimoz. 2014. Comparison of Intrapulmonary and Systemic Pharmacokinetics of Colistin Methanesulfonate (CMS) and Colistin after Aerosol Delivery and Intravenous Administration of CMS in Critically Ill Patients. Antimicrob Agents Chemother 58:7331-7339.
- M. Jacobs, N. Grégoire, B. Mégarbane, P. Gobin, D. Balayn, S Marchand, O. Mimoz , W. Couet.
Population pharmacokinetics of colistin methanesulphonate (CMS) and colistin in critically ill patients with acute renal failure requiring intermittent haemodialysis. (In review in AAC)
- M. Jacobs, N. Grégoire, W. Couet, J. B. Bulitta. Distinguishing Antimicrobial Models with Different Resistance Mechanisms via Population Pharmacodynamic Modeling. (In review in PLOS
computational biology)
- Jacobs M., Grégoire N., Chauzy A., Jeannot K., Nielsen E.I., Marchand S., Friberg L.E., Plésiat P., Couet W. Pharmacokinetic – Pharmacodynamics modelling of the quickly occurring and partially
reversible adaptive resistance of Pseudomonas aeruginosa to colistin using a bioluminescent strain in-vitro. (In manuscript)
28
A.
Colistin and aerosol delivery
Comparison of Intrapulmonary and Systemic Pharmacokinetics of Colistin Methanesulfonate (CMS) and Colistin after Aerosol Delivery and Intravenous Administration of CMS in Critically Ill Patients
Matthieu Boisson,a,b Matthieu Jacobs,b,c Nicolas Grégoire,b,c Patrice Gobin,a,b Sandrine Marchand,a,b,c William Couet,a,b,c Olivier Mimoza,b,c
CHU Poitiers, Poitiers, Francea; INSERM U1070, Poitiers, Franceb; Université de Poitiers, Poitiers, Francec
Abstract
Colistin is an old antibiotic that has recently gained a considerable renewal of interest for the treatment of pulmonary infections due to multidrug-resistant Gram-negative bacteria. Nebulization seems to be a promising form of administration, but colistin is administered as an inactive prodrug, colistin methanesulfonate (CMS); however, differences between the intrapulmonary concentrations of the active moiety as a function of the route of administration in critically ill patients have not been precisely documented. In this study, CMS and colistin concentrations were measured on two separate occasions within the plasma and epithelial lining fluid (ELF) of critically ill patients (n = 12) who had received 2 million international units (MIU) of CMS by aerosol delivery and then intravenous administration. The pharmacokinetic analysis was conducted using a population approach and completed by pharmacokinetic-pharmacodynamic (PK-PD) modeling and simulations. The ELF colistin concentrations varied considerably (9.53 to 1,137 mg/liter), but they were much higher than those in plasma (0.15 to 0.73 mg/liter) after aerosol delivery but not after intravenous administration of CMS. Following CMS aerosol delivery, typically, 9% of the CMS dose reached the ELF, and only 1.4% was presystemically converted into colistin. PK-PD analysis concluded that there was much higher antimicrobial efficacy after CMS aerosol delivery than after intravenous administration. These new data seem to support the use of aerosol delivery of CMS for the treatment of pulmonary infections in critical care patients.
Introduction
Aerosol delivery of antibiotics for the treatment of pulmonary infections has recently gained considerable attention, and approval has been obtained for this administration route worldwide for several compounds, including tobramycin (1, 2), aztreonam (3), and colistin (4, 5). Dry-powder formulas have been optimized, and at the same time, a new generation of pocket nebulizers was developed to favor aerosol delivery of antibiotics in ambulatory patients, such as a cystic fibrosis patient, in order to improve their quality
29 of life. However, aerosol delivery of antibiotics for the treatment of nosocomial pulmonary infections is also quite popular. And yet, there is no general consensus regarding the administration method, and in practice, it is quite difficult to provide clinical evidence demonstrating the superiority of the aerosol delivery of antibiotics over that of other routes of administration in critically ill patients. Therefore, a comparison of antibiotic concentrations at the site of infection after intravenous administration and aerosol delivery, followed by predictions of the resulting antimicrobial activity using modern pharmacokinetic-pharmacodynamic (PK-PD) modeling approaches, may provide valuable information. Numerous physicochemical parameters, including particle size, aerodynamic diameter, density, and charge, which are in part determined by the type of aerosol generator, determine how much of the drug may reach the alveolar space after aerosol delivery. However, patient physiopathology, such as impaired expiratory airflow or atelectasis, may also have a major impact on antibiotic distribution within the lung after aerosol delivery. Overall, only a limited fraction of the inhaled dose is likely to reach the target, and antibiotic characteristics, such as solubility, permeability, and affinity for efflux transport system present at the blood alveolar barrier, will also determine the intrapulmonary concentration-versus-time profile. Eventually, PK-PD characteristics that vary by antibiotic must also be considered for the optimization of aerosol treatment. Even with this relative complexity, promising results have been obtained with colistin after nebulization in rats by several groups, including Marchand et al. (6) and Yapa et al. (7), and the objective of this study was to describe the pharmacokinetics of colistin after CMS aerosol delivery for treating pulmonary infections in critically ill patients.
MATERIALS AND METHODS
Study population. The study was performed in 12 adult patients hospitalized in the intensive care unit (ICU) of
the University Hospital of Poitiers, France, who developed ventilator-associated pneumonia during their stay between October 2011 and August 2012. Patients were eligible if they were between 18 and 85 years of age, were intubated, and had a pneumonia caused by Gram-negative bacteria sensitive to colistin. Patients were not eligible if they had received colistin within 7 days prior to the study, had creatinine clearance of <30 ml/min, or had a personal or family history of myasthenia. At the study onset, the following data were collected: age, sex, weight, diagnosis on admission, serum urea, serum creatinine, simplified acute physiology score (SAPS II), and sequential organ failure assessment (SOFA) score. Creatinine clearance was calculated according to the Cockroft-Gault formula (8). The study protocol was approved by the local ethics committee (CPP Ouest III, approval no. 2009009578-28). In all patients, informed consent was obtained from their nearest relatives prior to the initiation of the study. A total of 6 women and 6 men were enrolled. Their demographic, clinical, and biological data are shown in Table 1.
30
TABLE 1 Patient demographic and clinical characteristics
Patients Age (years) Gender Weight (Kg) Diagnosis at admission SOFA scoreα SAPS II scoreα Creatinine clearanceβ (mL/min) 1 44 F 53 Respiratory decompensation 2 19 156
2 66 F 88 Tracheo-œsophageal fistula 3 47 125
3 18 M 59 Craniocerebral trauma 10 40 170 4 59 M 65 Cardiopulmonary arrest 4 33 120 5 72 F 65 Pneumonia 9 43 85 6 68 F 77 Peritonitis 11 42 66 7 64 M 115 Peritonitis 1 38 104 8 36 M 90 Multiple trauma 2 17 250 9 43 F 70 Multiple trauma 11 47 133 10 74 M 88 Cardiopulmonary arrest 9 67 88
11 74 F 86 Tracheo-œsophageal fistula 3 36 111
12 33 M 92 Thoracic injury 3 22 205
Mean ± SD 54 ± 19 79 ±17 6 ± 4 38 ±14 134 ± 53
αAt study onset
βAccording to Cockroft and Gault formula
CMS administration. The patients were treated with CMS (Colimycine; Sanofi-Aventis, Paris, France). Treatment
was initiated with a 2-million international unit (MIU) dose of CMS, corresponding to 160 mg of CMS sulfate or 60 mg of colistin-based activity (CBA) (9), dissolved in 10 ml of saline and nebulized over 30 min via a vibrating mesh nebulizer (Aeroneb Pro; Aerogen, Galway, France). Thus, 8 h later, the same dose of CMS was dissolved in 50 ml of saline and infused intravenously (i.v.) over 60 min. Intravenous administrations were
31 then repeated every 8 h until the end of treatment or therapeutic deescalation. The CMS solutions were prepared extemporaneously.
Sampling procedures. (i) Blood samples. Blood samples were collected immediately before and at 0.33, 0.66, 1,
1.5, 2, 2.5, 3, 4, 5, 6, 7, and 8 h after the beginning of aerosol delivery and after starting the first intravenous infusion via a distinct line. Two extra blood samples were collected at steady state at the same time as the bronchoalveolar lavage (BAL) fluid. The blood samples were immediately centrifuged (3,000 X g for 10 min) at 4°C, and the plasma was stored at -80°C until analysis.
(ii) BAL fluid samples. Mini-bronchoalveolar lavage (mini-BAL) was performed as previously described (10). Mini-BAL was performed with a 16-French (Fr) double sterile catheter (Mini-BAL, KimVent; Kimberly-Clark, Roswell, GA) inserted through the endotracheal tube. Two 20-ml aliquots of saline solution were instilled and then immediately aspirated with a syringe; these two BAL fluid samples were pooled and rapidly centrifuged (at 3,000 X g for 10 min), and the supernatants were stored at -80°C until analysis. For patients 1 to 6, mini-BAL was performed at 1 h and 3 h after initiating the aerosol delivery and then at steady state, 2 to 3 days later, and 1 h and 3 h after starting the nth intravenous infusion (7 < n < 12). For patients 7 to 12, mini-BAL was performed at 5 h and 8 h after initiating aerosol delivery and then at steady state, 2 to 3 days later, and 5 h and 8 h after starting the nth intravenous infusion (7 < n < 12). Urine samples were collected in 6 patients over 8 h at various times.
Colistin and CMS assay in plasma, urine, and BAL fluid. The samples were rapidly centrifuged, as previously described.
Plasma was separated and kept frozen before analysis, as previously described (11–13). A previously described liquid chromatography-tandem mass spectrometry (LC-MS/MS) assay was used for CMS and colistin concentration measurements in plasma and urine (12) and BAL fluid (6) samples. The limit of quantification of the assay was 0.04 µg/ml.
Urea analysis in plasma and BAL fluid. The urea concentrations were determined in BAL fluid by LC-MS/MS, and
the analysis was adapted from a previously described method (14). Eight-point calibration standards were made in 0.9% NaCl between 100 and 1.25 µg · ml-1. The limit of quantification (LOQ) for urea determination in BAL fluid was estimated at 1.25 µg · ml-1. The intra- and interday variabilities were characterized at these four concentrations, with precision and accuracy of <15% for 75, 25, and 2.5 µg · ml-1 concentrations and <20% for the LOQ. The urea concentrations in plasma were measured by photometric detection using an automatic analyzer (Modular automatic analyzer; Roche, France).


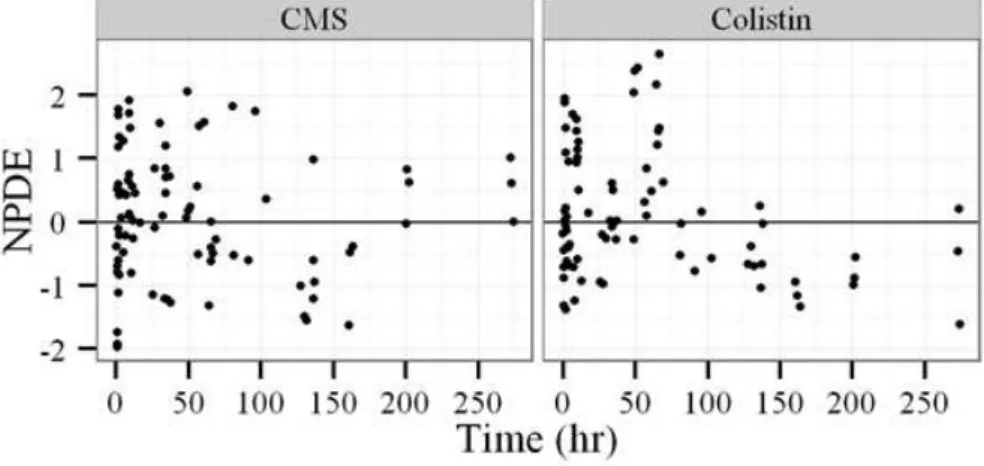
![FIG 3 Observed colistin and CMS concentrations in ELF and plasma with model predictions (as medians [solid lines] and 90% prediction intervals [gray shaded areas]) using parameter estimates](https://thumb-eu.123doks.com/thumbv2/123doknet/7904826.264699/38.877.127.755.199.597/observed-colistin-concentrations-predictions-prediction-intervals-parameter-estimates.webp)