VARIABLE RATE
IRRIGATION AND NITROGEN
FERTILIZATION IN POTATO;
ENGAGE THE SPATIAL
VARIATION (POTENTIAL)
Background document - with guidelines
for variable rate application of water
and nitrogen in potato
SOIL SERVICE OF BELGIUM (SSB) Pieter Janssens, Sofie Reynaert FLEMISH INSTITUTE FOR
TECHNOLOGICAL RESEARCH (VITO) Isabelle Piccard, Klaas Pauly UNIVERSITÉ DE LIÈGE (ULG) Sarah Garré, Gaël Dumont, Christian von Hebel
FORSCHUNGSZENTRUM JÜLICH (FZJ) Jan Van Der Kruk, Christian von Hebel AARHUS UNIVERSITY (AU)
Mathias Neumann Andersen, Kiril Manevski, Junxiang Peng, Kirsten Kørup
FASTERHOLT MASKINFABRIK WAGENINGEN APPLIED PLANT RESEARCH (WUR FIELD CROPS) Jan Kamp, Johan Booij
INSTITUUT VOOR LANDBOUW- EN VISSERIJONDERZOEK (ILVO) Sarah Garré
Acknowledgements
The 7 project partners acknowledge the financial support of het Agentschap voor Innoveren en Ondernemen (VLAIO) (Belgium Vlaanderen), Fund for Scientific Research (FNRS) (Belgium Wallonie), Federal Ministry of Food and Agriculture (BMEL) (Germany), Innovation Fund Denmark (IFD) (Denmark) and the Ministerie van Economische Zaken (The Netherlands).
These funding institutions were gathered in a joint call launched by Water JPI in the frame of the ERA-NET Cofund WaterWorks2015 to support research on the sustainable management of water resources in agriculture, forestry and freshwater aquaculture sectors.
Furthermore, the project partners acknowledge the support of Boerenbond, Belgapom, Yara and Vantage agrometius who cofunded the Belgian part-ners. Also all collaborating farmers such as Bert Peurteners, Koen Van Eyck, Patrick van Oeckel and Jacob Van Den Borne are acknowledged.
Content
1 Introduction 6
2 Main goals of the project 9
3 Current practices for irrigation and N-fertilizer scheduling in potato 10
3.1 Estimation of the irrigation need 10
3.2 Estimation of the N- fertilizer need 16
3.2.1 Belgium 17 3.2.2 Denmark 17 3.2.3 The Netherlands 17 4 Available platforms to facilitate the use of satellite images for farmers 18 4.1 Belgium 18 4.2 The Netherlands 23 5 Experiments 24 6 Quantification of the water and N deficit at the experimental fields using in-situ measurements 38
6.1 Quantification of the water deficit with in-situ measurements 38
6.1.1 Belgium 38
6.1.2 Denmark 40
6.2 Quantification of the nitrogen deficit 41
6.2.1 Belgium 41
6.2.2 Denmark 42
7 Potential of multispectral drone imagery 44
7.1 Types of drones and cameras 44
7.1.1 The use of drones in agriculture 44 7.1.2 Drone images used in POTENTIAL 49 7.2 Potential of drone imagery for variable rate irrigation,
relation between drone indices and in situ measurements 51
7.2.1 Belgium 51
Content
5
7.3 Potential of drone imagery for variable rate fertilization,
relation between drone indices and in situ measurements 55
7.3.1 Belgium 55
7.3.2 Denmark 58
7.4 Guidelines for using drone imagery for variable rate irrigation
and fertilization 59
8 Potential of Sentinel satellite imagery 61
8.1 Types of satellite sensors 61
8.1.1 The use of satellites in agriculture 61 8.1.2 Satellite images used in POTENTIAL 64 8.2 Potential of satellite imagery for variable rate irrigation,
relation between satellite indices and in situ measurements 65
8.2.1 Belgium 65
8.2.2 Denmark 67
8.3 Potential of satellite imagery for variable rate fertilization,
relation between satellite indices and in situ measurements 68
8.3.1 Belgium 68
8.3.2 Denmark 70
8.4 Guidelines for using satellite imagery for variable rate irrigation
and fertilization 71
9 Potential of soil scanning using electromagnetic induction systems 72
9.1 Electrical conductivity as indicator for different soil units 72
9.2 Comparison EMI and classical soil map 75
9.3 Guidelines for using electromagnetic induction data for variable rate
irrigation and fertilization 77
10 Relation between datasets 78
10.1 Relation between multispectral imagery derived from drone and
multispectral imagery derived from Sentinel-2 satellite 78 10.2 Relation between soil scan and multispectral imagery 80
11 Conclusions and summary of guidelines 82
11.1 Summary 82
11.2 Perspectives for further research 85
1
Introduction
With a total acreage of more than 5200 km² in all four countries, potato is an important agricultural crop in Belgium, Denmark, the Netherlands and Germany. In these countries percolation water contains nitrate (NO₃-) concen-trations higher than a safety limit of 25 mg/l, hence it is of common interest to reduce the leaching of nitrogen (N) from NO3- and to increase the water
use efficiency from irrigation of potato fields. It is envisaged that irrigation in potato will be crucial in the future to maintain stable yields as scenarios predict an increased occurrence of climatic extremes. The objective of the project “Variable rate irrigation and nitrogen fertilization in potato; engage the spatial variation” (abbreviated POTENTIAL) is to increase N and water use efficiency in potato by the use of innovative precision farming solutions. Spatio-temporal variation in water and N deficit in potato fields is revealed using remotely sensed data from satellite, drone, electromagnetic induc-tion (EMI) and tractor-mounted and hand-held sensors. The combinainduc-tion of these different types of information on above- and belowground crop and soil information opens up new opportunities for sound decision making. The project envisaged the translation of years of research on mapping the variability in crop vitality and soil condition to specific task maps for farm-ers in order to optimize their management. The consortium was composed of the Soil Service of Belgium (SSB), VITO, Université de Liège (ULg), Aarhus University (AU), Fasterholt Maskinfabrik (FM), Forschungszentrum Jülich (FZJ and Wageningen University & Research (WUR).
1 // Introduction
7 A range of sensors were applied to characterize spatio-temporal variations in soil and crop at field trials in potato farms in Belgium (SSB and WUR) and Denmark (AU) from 2017 to 2019. The sensors were satellite, drone, machine-mounted and handheld. Soil moisture and soil nitrate content is collected in situ, and compared with apparent electrical conductivity (ECa) maps obtained with multi-configuration EMI soil scanners (FZJ, ULg, AU) and a tractor mounted soil water content mapping system developed at AU using Time-Domain Reflectometry (TDR) sensors. Output from these sensor systems was related to in-field crop response maps to water and N stress as well as yield. Classical agronomic recommendation services for irrigation and nitrogen management in the four partnering countries were be listed and assessed. A way of practice indicating how spatial informa-tion can be integrated into the classical agronomic recommendainforma-tions for irrigation and fertilization was outlined. Special attention was given to the investigation of spectral information to distinguish between nitrogen and water deficits and their relation to soil properties. For the implementation of the variable application of water and nitrogen the consortium had the assistance of Jacob Van den Borne in the Netherlands. Jacob Van Den Borne is a potato farmer and is equipped with machinery that allows variable N fertilization, as well as a Fasterholt irrigation gun. The Danish SME Fasterholt Maskinfabrik A/S is an experienced manufacturer of raingun machines primarily for the European market. Fasterholt is currently developing a variable rate raingun with GPS positioning, with the ability to adjust for wind-deflection and to direct the gun according to pre- programmed maps of desired surface application rates.
This background document is valuable to adapt the irrigation and fertili-zation strategy of potato varieties or for the improvement of the existing strategies. It can also be used as a starting point to focus the potato man-agement on the recommended points. The outcomes of the project and presented in the guideline should be robust, because they are based on information from different pedo-climatic and technical conditions.
Irrigation in potato will be
crucial in the future to maintain
stable yields as most future
climate scenarios predict
an increased occurrence of
climatic extremes.
2 // Main goals of the project
9
2
Main goals of the project
The objective of the proposed POTENTIAL project is to increase N and water use efficiency in potato by co-scheduling of N and irrigation water. This implies the reduction of water percolation and N leaching out of the soil profile. Innovative sensing solutions and fertilizer and water application technologies are used to meet this objective. Four specific goals are set:
1 Assess spatio-temporal variation in water and N deficit in potato fields using various data sources (satellite, drone, EMI, tractor- mounted sensors) to collect information on crop and soil state variables.
2 Distinguish between water stress and nitrogen deficiencies and quantify these in potato crops through sensor technology. 3 Integrate information about the spatial variation in operational
services for co-scheduling irrigation and N fertilization.
4 Develop, apply and assess variable rate irrigation and N fertiliza-tion based on this integrated service.
3
Current practices for irrigation and
N-fertilizer scheduling in potato
3.1 ESTIMATION OF THE IRRIGATION NEEDIrrigation can be scheduled using a soil water balance, soil sensors, plant sensors or combinations between them. Irrigation scheduling aims to opti-mize the crop yield with a minimal input of irrigation water. Excess irrigation results in a suboptimal economic result for the farmer, especially in the majority of potato farms in Northwestern Europe, where irrigation is applied with sprinklers, which consume a lot of energy. Furthermore over-irrigation increases the risk of nutrient leaching out of the root zone, to the environ-ment. Popular soil water balances used to schedule irrigation, or to evaluate the irrigation need are BUDGET (Raes et al., 2006), AQUACROP (Raes et al., 2018) or Cropsyst (Stöckle et al., 2003).
To define the optimal time and dose of irrigation, a wide range of soil and plant sensors can be used. These sensors monitor water status at the level of the soil, or at the level of the plant. However, a forecast of irrigation need is rarely provided, since this approach lacks a forecast model. A clas-sical soil water balance model as for example BUDGET (Raes et al., 2006) calculates the root zone depletion for the simulation period (Δt = 1 day) by considering the measured soil water content in the root zone at day i (Di), the daily rainfall (R), irrigation (I), estimated capillary rise (CR), and
the crop evapotranspiration which is calculated by multiplying reference evapotranspiration (ETo) with the crop coefficient Kc (Allen et al., 1998).
Deep percolation (DP) is con sidered when soil water content exceeds Field Capacity (Eq. 1, Figure 1).
Di [mm]= Di-1 + R + CR – DP + I – Kc ETo (1)
3 // Current practices for irrigation and N-fertilizer scheduling in potato 11 Figure 1 Schematic of a soil water balance model, which can be used to forecast irrigation need. rainfall/ irrigation runoff deep drainage capillary rise soil water retention
root water uptake
transpiration evaporation
In the POTENTIAL project, a soil water balance model was used to sched-ule irrigation. For example in experimental field nr 7 (Kasterlee, Belgium), 7 irrigation events were scheduled to maintain soil water status close to the irrigation threshold, which identifies possible water shortage (Figure 2).
Figure 2 Soil water balance used to schedule irrigation on an experimental field in Kasterlee, Belgium (experimental field nr 7). Higher irrigation threshold during tuber formation Irrigation Threshold 7 irrigation events Field Capacity Calculated
Soil water content Measured soil
Water content
3 // Current practices for irrigation and N-fertilizer scheduling in potato
13 Table 1 Commercially available soil moisture sensors used in potato farms in Belgium and the Netherlands (non-exhaustive list, price level 2019)
SENSOR URL TECHNIQUE OUTPUT COSTS
Dacom
Sensetion www.dacom.nl/en/products/sensetion Soil moisture (mm) €1.095+€250/j
Dacom
Terrasen www.dacom.nl/en/products/terrasen Soil moisture (mm)Precipitation (mm)
Soil temperature
€2.295+€250/j
WolkyTolky www.wolkytolky.com/en Watermark Precipitation Soil moisture Temperature Soil temperature Wind (force and direction) Relative humidity Solar radiation UV index Barometric pressure Leaf wetness (disease treatment) SoilMate www.smartfarm.nl/en/
sensors/soilmate Volumetric soil moisture (%) €189+€7,50/m
Sensoterra www.sensoterra.com/en/
product Volumetric soil moisture (%)
GeoBas www.vantage-agrometius.nl/ product/geobas-
bodemvochtsensor
Watermark Volumetric soil moisture (%) Water suction pressure (kPa) Precipitation €500 (LoRa)+€75/j RMA www.rmacompany.nl/ bodemvocht-en-neerslag- via-lora
Volumetric soil moisture (%) Precipitation
€800+€250/j Soil sensors can be used to estimate soil water potential (Ψsoil) or soil water
content (θ) who can be related to each other through the water retention curve. Sensors can measure in real time, and are easily accessible although they lack forecast. Often multiple sensors are needed to get a good view of the spatial variation in the soil, and site specific calibration is requested (Jackisch et al., 2019; Dane et al., 2002; Lukangu et al., 1999). Several sensor and datalogger combinations are on the market to help farmers in the organization of their irrigation (Table 1).
3 // Current practices for irrigation and N-fertilizer scheduling in potato
15 Experiences with the soil sensors on experimental field nr 12, in the Netherlands, showed that calibration is needed to ensure correct obser-vations of soil water status (Figure 3). Also sensors connected to DACOM, RMA or Geobas dataloggers needed to be calibrated to deliver correct absolute soil moisture values.
Figure 3 Evolution of Ψsoil observed with Watermark sensor connected to Wolky Tolky datalogger in the experimental field in the Netherlands in 2019. Readings are compared to Ψsoil observations of Soil Service of Belgium derived from gravimetric sampling and calculated to Ψsoil trough the water retention curve before (a) and after (b) calibration of the sensor Ψsoil data, using the gravimetric soil moisture measurements.
Weather station and different soil sensors as installed on the field of Jacob Van Den Borne in the Netherlands in 2019 (Field nr 12)
(b) (a)
3.2 ESTIMATION OF THE N- FERTILIZER NEED
A crop decision support system of N fertilization in potato should take in to account N uptake of the crop in relation to N supply to the crop due to soil mineralization. This estimation should lead to a N fertilization advise, which can be split into multiple fractions to ensure efficient N uptake (Goffart et al., 2008). In the experimental country’s (Belgium, The Netherlands, Denmark) organic manure is mostly applied before potato planting in combination with mineral fertilizer. About 100 kg N/ha is given by manure, the rest (100-150 kg N/ha) is applied by N-fertilizers with e.g. KAS. Mostly the farmer adds an application during late June/July as a topdress.
There are however N-scheduling tools available to apply the amount of N-fertilizer in a more efficient way and minimize the amount of N-fertilizer. These scheduling tools are called N-sidedress systems. Instead of applying most N-fertilizer at planting, only about 2/3 is applied. The rest is applied as a side dress during June/July based on an estimation of what the crop still needs. This estimation is based on the N-availability in the soil and/or esti-mation of the N-uptake of the crop. Besides soil sampling several methods have been described to outline optimal side dress N rate (Muñoz-Huerta et al., 2013). Plant tissue can be sampled followed with a Kjeldahl digestion or Dumas combustion, however these analyses are destructive. Optimal sensors can estimate chlorophyll concentration such as the SPAD sensor or fluorescence using a Dualex or Multiplex sensor. Optimal sensors can also observe spectral crop reflectance on an active or passive basis and can be installed on various platforms varying from hand held over drone to satellite.
3 // Current practices for irrigation and N-fertilizer scheduling in potato
17
3.2.1 Belgium
On all field trials in Belgium and the Netherlands available N for crop growth is estimated based on nitrate-N and ammonium-N content in the soil, pH, %C and crop characteristics. All of these parameters are considered by Soil Service of Belgium in the N-INDEX expert system (Vandendriessche et al., 1996). For potato soil analysis was conducted to a depth of -60 cm. Soil analysis was conducted in early spring, after which fertilization treatments, as outlined in paragraph 5, were installed. During the growing season addi-tional soil N analysis was conducted to evaluate the various fertilization treatments.
3.2.2 Denmark
On all field trials in Denmark the soil N availability is determined by soil sam-ple analysis for N, P, K and Mg contents in spring before planting. Composite samples from the plough layer (0-25 cm) are collected and analyzed in the lab. Thereafter, the recommended amount of fertilizer (legal quota) applied to the crop is “corrected” by the amount obtained from the soil N analysis (estimated amount of N from mineralization). The recommended amount of fertilizer is based on N response curves obtained from numerous trials on national level, which are cultivar- and soil type specific and the data are compiled and updated annually by advisory services organized by the Danish Ministry of Food and Environment.
3.2.3 The Netherlands
In the trial fields at Van Den Borne the N-uptake of the crop is estimated with biomass maps from a drone camera or nearby Fritzmeijer sensor (Fritzmeier Umwelttechnik, Isaria, Germany). With a growth model the poten-tial N-uptake of the crop is predicted. This potenpoten-tial N-uptake is based on the expected yield and the historic temperature from planting to the date of N-side dress. The difference between the current N-uptake and the potential N-uptake is the amount of N-fertilizer which was applied.
4
Available platforms to facilitate the use
of satellite images for farmers
4.1 BELGIUM
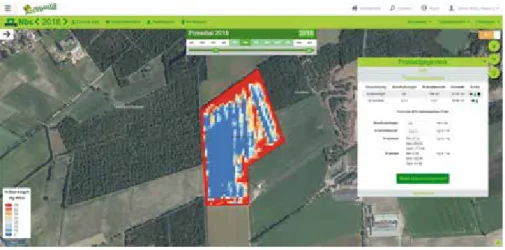
WatchITgrow is a Belgian platform launched to support farmers to monitor the status and evolution of arable crops and vegetables, in view of increas-ing yields, both qualitatively and quantitatively. It centralizes various types of data such as satellite, weather and soil data and field data provided by the farmer. The platform is freely accessible after registration at:
www.watchitgrow.be.
WatchITgrow provides information on crop growth and development as observed from Sentinel-2 satellite images. Light reflectances measured by the satellite sensor are converted into fAPAR (fraction of absorbed Photosynthetically Active Radiation). In WatchITgrow fAPAR is referred to as greenness. fAPAR is a measure of the crop’s productivity and health and is often used as an indicator of the state and evolution of crop cover. Low greenness values indicate that there is no crop growing on the field (bare soil, fAPAR=0). When the crop emerges the greenness will increase until the crop has reached maturity (fAPAR=0.95-1.00). Then the index will decrease again until harvest. WatchITgrow produces new greenness maps every time the satellite passes. Archive images are available since July 2015. In addition to the maps, greenness graphs can be retrieved showing the fAPAR evolution throughout the season at field level. From this growth curve information on phenology and crop development can be derived.
4 // Available platforms to facilitate the use of satellite images for farmers
19 The Sentinel satellites have a revisit frequency of 5 days, in some regions even every 2 to 3 days. The images have pixel sizes of 10x10m. Under cloud free conditions, the availability of such frequent high resolution satellite images allows a close follow up of the fields and an early detection of possible anomalies. The satellite shows a picture ‘from above’ and this may reveal variability in crop growth within the field which is not always visible when visiting the field from the road. The reasons for this variability can be diverse, however, and can include (natural) soil heterogeneity, climate induced problems such as drought or water logging and local damages due to pests or diseases, emergence problems, among others.
Satellite based information on variability within the field allows farmers to manage the fields more effectively. By accounting for the various zones detected within the field, more representative soil or crop samples can be taken. In WatchITgrow application maps can be generated for variable rate fertilization, irrigation and haulm killing, based on the satellite greenness. The farmer enters the product dose (fertilizer, water, herbicide, …) that he or she would normally apply on the field. The dose is then redistributed according to the differences in greenness detected from the satellite image (Figure 4). For N-fertilization, the farmer can choose between two strategies, either applying a higher dose of a fertilizer to zones with a higher greenness index or applying a lower dose to these zones. For farmers, variable rate applications are crucial in order to make cost savings in inputs, increase yields, and use their fields in a more sustainable way. Similarly, application maps can be created for variable rate planting, by accounting for the shadow zones within the field.
The current approach whereby variable rate application maps are based only on satellite greenness has some limitations. Satellite images may reveal variability within the field but to make sound decisions on how to respond to this variability it is important to find out what is causing the variability. Therefore it is recommended to combine satellite data with other sources of information such as soil maps or soil scans, elevation maps, weather data or field observations. Thanks to the knowledge gained in the POTENTIAL project we will be able to further improve this WatchITgrow component in the future.
Figure 4 Creating variable rate fertilization maps in WatchITgrow
As the satellite images cover large areas, they are ideal to remotely moni-tor fields which are located further away from the farm. They can also be used to compare and rank different fields with a region, from low to high greenness or vice versa. This information can then be used to organize field visits in a more efficient way, for instance by prioritizing fields that are showing greenness anomalies. During the harvest period information on the greenness of the fields can be useful for harvest planning and logistics. Crop production is largely influenced by the weather. By monitoring tem-perature and rainfall, production risk or quality losses can be assessed. WatchITgrow offers maps showing temperature and rainfall deviations from the long term average. In addition, graphs can be retrieved showing the evolution of these meteorological variables at field level.
4 // Available platforms to facilitate the use of satellite images for farmers
21 The WatchITgrow platform also provides access to basic information layers such as soil type, erosion risk and elevation maps. These may be helpful when trying to find the cause of variability in crop growth within a field. Further, information on the field history is provided, showing the main crops that have been grown on the fields since 2013.
WatchITgrow also includes a field registration tool. The platform can be used to store and exchange field data in a digital way. This may include basic infor-mation such as the variety, planting date, date of haulm killing, harvest date or more specific information on application of fertilizers, pesticides, irrigation, or on damage assessed at the field. Yield data collected via WatchITgrow are used to train yield forecasting models. Important to note is that the farmer remains the owner of the data at all times. He or she decides whether to share these data or not with advisors, contractors, buyers.
The final objective of WatchITgrow is to combine the various data sources (satellite, weather, soil, field data, …) using new technologies such as big data analytics and machine learning to provide farmers with personalized advice to increase their yields.
The WatchITgrow platform was developed in the frame of a research pro-ject, iPot, a collaboration between researchers from Flanders and Wallonia (VITO, CRA-W and ULg) together with the Belgian potato trade and pro-cessing industry association Belgapom. After the research phase, the platform became operational in 2017 and was rebranded as WatchITgrow. WatchITgrow is an independent platform, hosted by VITO, guaranteeing data-privacy, data-security and data access. It is freely accessible after registration at www.watchitgrow.be. Since 2018 VITO receives funding from Belgapom and the Flemish farmers’ organization Boerenbond to further improve the application and integrate new features. Both organizations are actively promoting the platform among the farmers in the context of the “digitalization of agriculture” in Belgium. VITO is also involved in sev-eral Flemish projects such as POTENTIAL, PPIDD, WikiLeeks, Irrigatie 2.0, as well as in European projects, ensuring the further development of the platform. In collaboration with various partners such as the Soil Service of Belgium, AVR, Inagro, ILVO, … new data layers, improved products and tools have been added, integrating the results of common research projects and using the latest Big Data and cloud processing technologies. Although the platform was initially oriented towards potato monitoring, WatchITgrow can now be used for monitoring a broad range of arable crops, vegetables and grasslands. Since 2017 more than 800 users registered on WatchITgrow, including farmers, traders, processing companies, suppliers, contractors, advisors, researchers, … In 2019, about 1700 Belgian fields, approximately 8000 hectares, were monitored with WatchITgrow. The platform is currently being extended to enable monitoring of fields across the border with the neighboring countries (France, the Netherlands and Germany).
4 // Available platforms to facilitate the use of satellite images for farmers
23 4.2 THE NETHERLANDS
Akkerweb (www.akkerweb.eu) is an online platform from Wageningen University and Research. Scientific results are translated to applications useful for variable rate applications. Akkerweb provides access to external data sources as weather, parcel boundaries, satellite and farm manage-ment data. It stores georeferenced data like soil maps and drone images. Applications translate these data to recommendations and prescription maps for field work, like spraying machines or spreaders (Van Evert et al. 2018). Most applications work on absolute recommendation models, whereas other platforms rely on relative prescription maps, where the farmer can only distribute his inputs more effectively. Apps useful for the cultivation of potato are Haulm Killing App (variable rate of haulm killing herbicides, based on satellite or drone images), N-fertilizer app (variable rate of N-fertilizer based on satellite, drone images, a growth model and weather) and Late Blight App (based on weather data better scheduling of crop protection for late blight) (Kempenaar et al. 2018).
Figure 5 Screenshot of the N-sidedress App on Akkerweb which shows a N-Fertilizer recommendation based on satellite data for the Van den Borne field of 2018.
5
Experiments
During the POTENTIAL project, between 2017 and 2019, 11 experimental fields were set up in Belgium, 3 in the Netherlands and 3 in Denmark. In the experiments two different setups were used. On a part of the experimental fields a variation in water and N status was induced by applying varying doses of irrigation and fertilization. In another experiment the variation in the field was studied, without adding extra degrees of variation in water or nutrient input.
Hose reel irrigator installed in potato field.
5 // Experiments
25
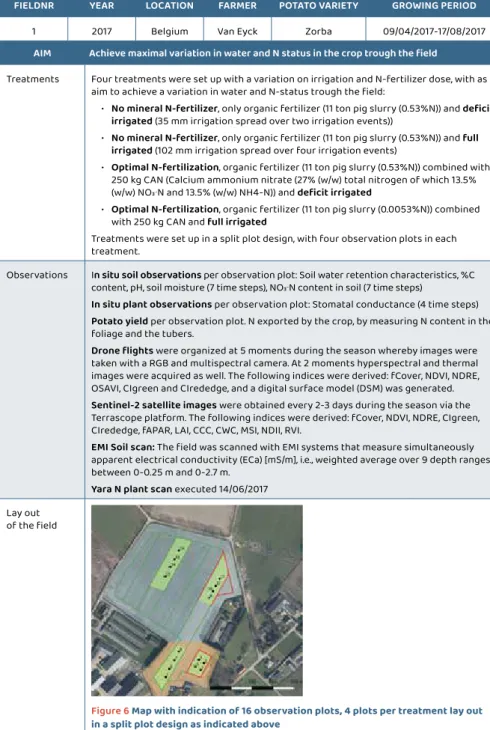
AIM Achieve maximal variation in water and N status in the crop trough the field
Treatments Four treatments were set up with a variation on irrigation and N-fertilizer dose, with as aim to achieve a variation in water and N-status trough the field:
• No mineral N-fertilizer, only organic fertilizer (11 ton pig slurry (0.53%N)) and deficit
irrigated (35 mm irrigation spread over two irrigation events))
• No mineral N-fertilizer, only organic fertilizer (11 ton pig slurry (0.53%N)) and full
irrigated (102 mm irrigation spread over four irrigation events)
• Optimal N-fertilization, organic fertilizer (11 ton pig slurry (0.53%N)) combined with 250 kg CAN (Calcium ammonium nitrate (27% (w/w) total nitrogen of which 13.5% (w/w) NO3-N and 13.5% (w/w) NH4-N)) and deficit irrigated
• Optimal N-fertilization, organic fertilizer (11 ton pig slurry (0.0053%N)) combined with 250 kg CAN and full irrigated
Treatments were set up in a split plot design, with four observation plots in each treatment.
Observations In situ soil observations per observation plot: Soil water retention characteristics, %C content, pH, soil moisture (7 time steps), NO3-N content in soil (7 time steps)
In situ plant observations per observation plot: Stomatal conductance (4 time steps) Potato yield per observation plot. N exported by the crop, by measuring N content in the
foliage and the tubers.
Drone flights were organized at 5 moments during the season whereby images were
taken with a RGB and multispectral camera. At 2 moments hyperspectral and thermal images were acquired as well. The following indices were derived: fCover, NDVI, NDRE, OSAVI, CIgreen and CIrededge, and a digital surface model (DSM) was generated.
Sentinel-2 satellite images were obtained every 2-3 days during the season via the
Terrascope platform. The following indices were derived: fCover, NDVI, NDRE, CIgreen, CIrededge, fAPAR, LAI, CCC, CWC, MSI, NDII, RVI.
EMI Soil scan: The field was scanned with EMI systems that measure simultaneously
apparent electrical conductivity (ECa) [mS/m], i.e., weighted average over 9 depth ranges between 0-0.25 m and 0-2.7 m.
Yara N plant scan executed 14/06/2017
Lay out of the field
Figure 6 Map with indication of 16 observation plots, 4 plots per treatment lay out in a split plot design as indicated above
FIELDNR YEAR LOCATION FARMER POTATO VARIETY GROWING PERIOD
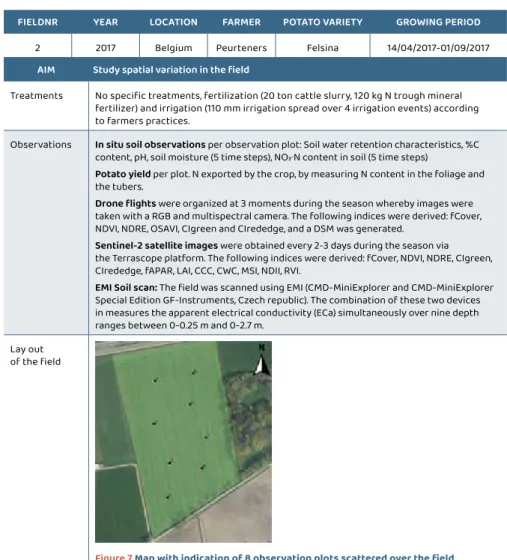
AIM Study spatial variation in the field
Treatments No specific treatments, fertilization (20 ton cattle slurry, 120 kg N trough mineral fertilizer) and irrigation (110 mm irrigation spread over 4 irrigation events) according to farmers practices.
Observations In situ soil observations per observation plot: Soil water retention characteristics, %C
content, pH, soil moisture (5 time steps), NO3-N content in soil (5 time steps)
Potato yield per plot. N exported by the crop, by measuring N content in the foliage and
the tubers.
Drone flights were organized at 3 moments during the season whereby images were
taken with a RGB and multispectral camera. The following indices were derived: fCover, NDVI, NDRE, OSAVI, CIgreen and CIrededge, and a DSM was generated.
Sentinel-2 satellite images were obtained every 2-3 days during the season via
the Terrascope platform. The following indices were derived: fCover, NDVI, NDRE, CIgreen, CIrededge, fAPAR, LAI, CCC, CWC, MSI, NDII, RVI.
EMI Soil scan: The field was scanned using EMI (CMD-MiniExplorer and CMD-MiniExplorer
Special Edition GF-Instruments, Czech republic). The combination of these two devices in measures the apparent electrical conductivity (ECa) simultaneously over nine depth ranges between 0-0.25 m and 0-2.7 m.
Lay out of the field
Figure 7 Map with indication of 8 observation plots scattered over the field FIELDNR YEAR LOCATION FARMER POTATO VARIETY GROWING PERIOD
5 // Experiments
27
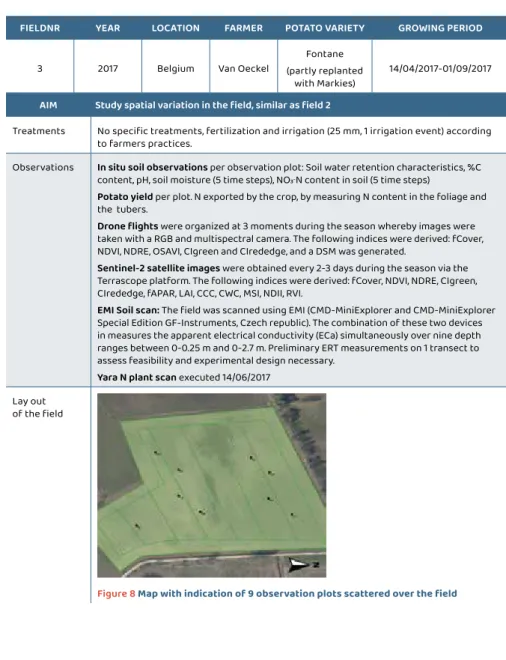
AIM Study spatial variation in the field, similar as field 2
Treatments No specific treatments, fertilization and irrigation (25 mm, 1 irrigation event) according to farmers practices.
Observations In situ soil observations per observation plot: Soil water retention characteristics, %C
content, pH, soil moisture (5 time steps), NO3-N content in soil (5 time steps)
Potato yield per plot. N exported by the crop, by measuring N content in the foliage and
the tubers.
Drone flights were organized at 3 moments during the season whereby images were
taken with a RGB and multispectral camera. The following indices were derived: fCover, NDVI, NDRE, OSAVI, CIgreen and CIrededge, and a DSM was generated.
Sentinel-2 satellite images were obtained every 2-3 days during the season via the
Terrascope platform. The following indices were derived: fCover, NDVI, NDRE, CIgreen, CIrededge, fAPAR, LAI, CCC, CWC, MSI, NDII, RVI.
EMI Soil scan: The field was scanned using EMI (CMD-MiniExplorer and CMD-MiniExplorer
Special Edition GF-Instruments, Czech republic). The combination of these two devices in measures the apparent electrical conductivity (ECa) simultaneously over nine depth ranges between 0-0.25 m and 0-2.7 m. Preliminary ERT measurements on 1 transect to assess feasibility and experimental design necessary.
Yara N plant scan executed 14/06/2017
Lay out of the field
Figure 8 Map with indication of 9 observation plots scattered over the field FIELDNR YEAR LOCATION FARMER POTATO VARIETY GROWING PERIOD
3 2017 Belgium Van Oeckel (partly replanted Fontane
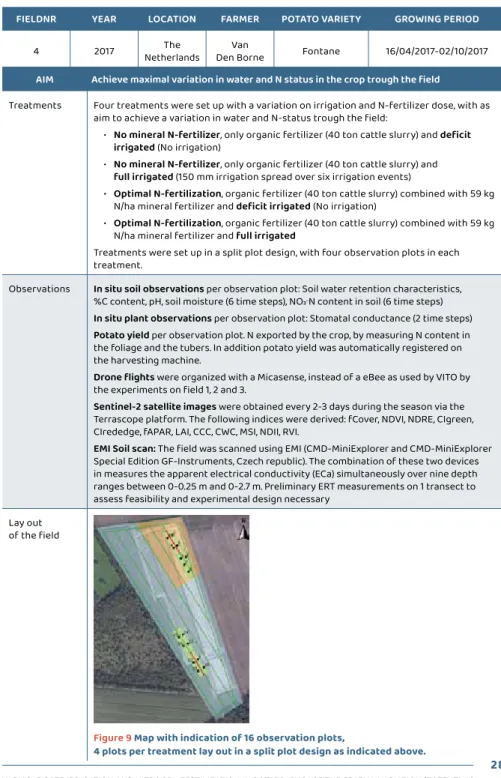
AIM Achieve maximal variation in water and N status in the crop trough the field
Treatments Four treatments were set up with a variation on irrigation and N-fertilizer dose, with as aim to achieve a variation in water and N-status trough the field:
• No mineral N-fertilizer, only organic fertilizer (40 ton cattle slurry) and deficit
irrigated (No irrigation)
• No mineral N-fertilizer, only organic fertilizer (40 ton cattle slurry) and
full irrigated (150 mm irrigation spread over six irrigation events)
• Optimal N-fertilization, organic fertilizer (40 ton cattle slurry) combined with 59 kg N/ha mineral fertilizer and deficit irrigated (No irrigation)
• Optimal N-fertilization, organic fertilizer (40 ton cattle slurry) combined with 59 kg N/ha mineral fertilizer and full irrigated
Treatments were set up in a split plot design, with four observation plots in each treatment.
Observations In situ soil observations per observation plot: Soil water retention characteristics,
%C content, pH, soil moisture (6 time steps), NO3-N content in soil (6 time steps)
In situ plant observations per observation plot: Stomatal conductance (2 time steps) Potato yield per observation plot. N exported by the crop, by measuring N content in
the foliage and the tubers. In addition potato yield was automatically registered on the harvesting machine.
Drone flights were organized with a Micasense, instead of a eBee as used by VITO by
the experiments on field 1, 2 and 3.
Sentinel-2 satellite images were obtained every 2-3 days during the season via the
Terrascope platform. The following indices were derived: fCover, NDVI, NDRE, CIgreen, CIrededge, fAPAR, LAI, CCC, CWC, MSI, NDII, RVI.
EMI Soil scan: The field was scanned using EMI (CMD-MiniExplorer and CMD-MiniExplorer
Special Edition GF-Instruments, Czech republic). The combination of these two devices in measures the apparent electrical conductivity (ECa) simultaneously over nine depth ranges between 0-0.25 m and 0-2.7 m. Preliminary ERT measurements on 1 transect to assess feasibility and experimental design necessary
Lay out of the field
Figure 9 Map with indication of 16 observation plots,
FIELDNR YEAR LOCATION FARMER POTATO VARIETY GROWING PERIOD
5 // Experiments
29
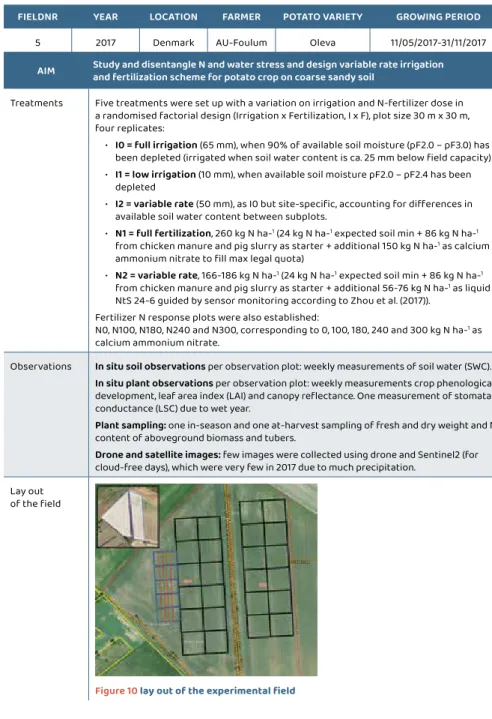
AIM Study and disentangle N and water stress and design variable rate irrigation and fertilization scheme for potato crop on coarse sandy soil
Treatments Five treatments were set up with a variation on irrigation and N-fertilizer dose in a randomised factorial design (Irrigation x Fertilization, I x F), plot size 30 m x 30 m, four replicates:
• I0 = full irrigation (65 mm), when 90% of available soil moisture (pF2.0 – pF3.0) has been depleted (irrigated when soil water content is ca. 25 mm below field capacity) • I1 = low irrigation (10 mm), when available soil moisture pF2.0 – pF2.4 has been
depleted
• I2 = variable rate (50 mm), as I0 but site-specific, accounting for differences in available soil water content between subplots.
• N1 = full fertilization, 260 kg N ha-1 (24 kg N ha-1 expected soil min + 86 kg N ha-1
from chicken manure and pig slurry as starter + additional 150 kg N ha-1 as calcium
ammonium nitrate to fill max legal quota)
• N2 = variable rate, 166-186 kg N ha-1 (24 kg N ha-1 expected soil min + 86 kg N ha-1
from chicken manure and pig slurry as starter + additional 56-76 kg N ha-1 as liquid
NtS 24-6 guided by sensor monitoring according to Zhou et al. (2017)). Fertilizer N response plots were also established:
N0, N100, N180, N240 and N300, corresponding to 0, 100, 180, 240 and 300 kg N ha-1 as
calcium ammonium nitrate.
Observations In situ soil observations per observation plot: weekly measurements of soil water (SWC). In situ plant observations per observation plot: weekly measurements crop phenological
development, leaf area index (LAI) and canopy reflectance. One measurement of stomatal conductance (LSC) due to wet year.
Plant sampling: one in-season and one at-harvest sampling of fresh and dry weight and N
content of aboveground biomass and tubers.
Drone and satellite images: few images were collected using drone and Sentinel2 (for
cloud-free days), which were very few in 2017 due to much precipitation. Lay out
of the field
Figure 10 lay out of the experimental field
FIELDNR YEAR LOCATION FARMER POTATO VARIETY GROWING PERIOD
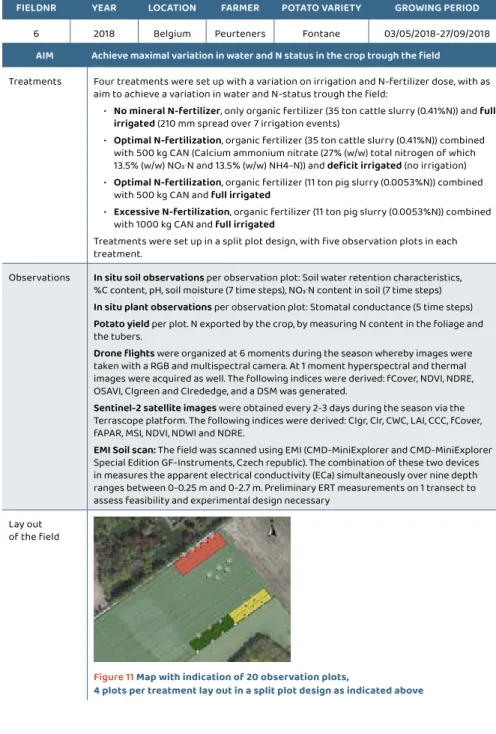
AIM Achieve maximal variation in water and N status in the crop trough the field
Treatments Four treatments were set up with a variation on irrigation and N-fertilizer dose, with as aim to achieve a variation in water and N-status trough the field:
• No mineral N-fertilizer, only organic fertilizer (35 ton cattle slurry (0.41%N)) and full
irrigated (210 mm spread over 7 irrigation events)
• Optimal N-fertilization, organic fertilizer (35 ton cattle slurry (0.41%N)) combined with 500 kg CAN (Calcium ammonium nitrate (27% (w/w) total nitrogen of which 13.5% (w/w) NO3-N and 13.5% (w/w) NH4-N)) and deficit irrigated (no irrigation)
• Optimal N-fertilization, organic fertilizer (11 ton pig slurry (0.0053%N)) combined with 500 kg CAN and full irrigated
• Excessive N-fertilization, organic fertilizer (11 ton pig slurry (0.0053%N)) combined with 1000 kg CAN and full irrigated
Treatments were set up in a split plot design, with five observation plots in each treatment.
Observations In situ soil observations per observation plot: Soil water retention characteristics,
%C content, pH, soil moisture (7 time steps), NO3-N content in soil (7 time steps)
In situ plant observations per observation plot: Stomatal conductance (5 time steps) Potato yield per plot. N exported by the crop, by measuring N content in the foliage and
the tubers.
Drone flights were organized at 6 moments during the season whereby images were
taken with a RGB and multispectral camera. At 1 moment hyperspectral and thermal images were acquired as well. The following indices were derived: fCover, NDVI, NDRE, OSAVI, CIgreen and CIrededge, and a DSM was generated.
Sentinel-2 satellite images were obtained every 2-3 days during the season via the
Terrascope platform. The following indices were derived: CIgr, CIr, CWC, LAI, CCC, fCover, fAPAR, MSI, NDVI, NDWI and NDRE.
EMI Soil scan: The field was scanned using EMI (CMD-MiniExplorer and CMD-MiniExplorer
Special Edition GF-Instruments, Czech republic). The combination of these two devices in measures the apparent electrical conductivity (ECa) simultaneously over nine depth ranges between 0-0.25 m and 0-2.7 m. Preliminary ERT measurements on 1 transect to assess feasibility and experimental design necessary
Lay out of the field
Figure 11 Map with indication of 20 observation plots,
4 plots per treatment lay out in a split plot design as indicated above
FIELDNR YEAR LOCATION FARMER POTATO VARIETY GROWING PERIOD
5 // Experiments
31
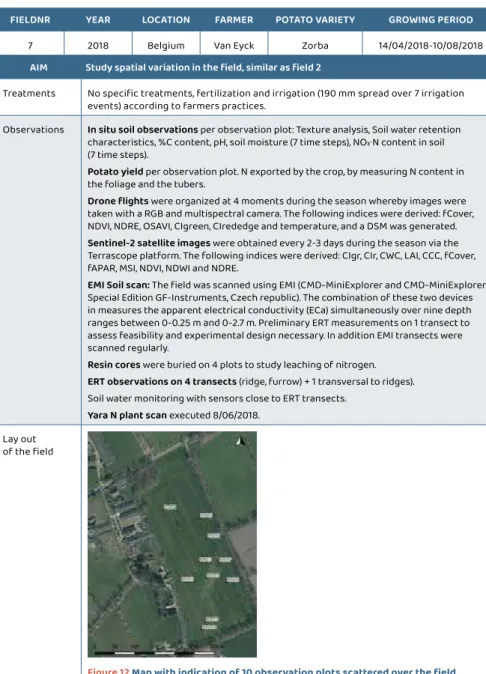
AIM Study spatial variation in the field, similar as field 2
Treatments No specific treatments, fertilization and irrigation (190 mm spread over 7 irrigation events) according to farmers practices.
Observations In situ soil observations per observation plot: Texture analysis, Soil water retention
characteristics, %C content, pH, soil moisture (7 time steps), NO3-N content in soil
(7 time steps).
Potato yield per observation plot. N exported by the crop, by measuring N content in
the foliage and the tubers.
Drone flights were organized at 4 moments during the season whereby images were
taken with a RGB and multispectral camera. The following indices were derived: fCover, NDVI, NDRE, OSAVI, CIgreen, CIrededge and temperature, and a DSM was generated.
Sentinel-2 satellite images were obtained every 2-3 days during the season via the
Terrascope platform. The following indices were derived: CIgr, CIr, CWC, LAI, CCC, fCover, fAPAR, MSI, NDVI, NDWI and NDRE.
EMI Soil scan: The field was scanned using EMI (CMD-MiniExplorer and CMD-MiniExplorer
Special Edition GF-Instruments, Czech republic). The combination of these two devices in measures the apparent electrical conductivity (ECa) simultaneously over nine depth ranges between 0-0.25 m and 0-2.7 m. Preliminary ERT measurements on 1 transect to assess feasibility and experimental design necessary. In addition EMI transects were scanned regularly.
Resin cores were buried on 4 plots to study leaching of nitrogen. ERT observations on 4 transects (ridge, furrow) + 1 transversal to ridges).
Soil water monitoring with sensors close to ERT transects.
Yara N plant scan executed 8/06/2018.
Lay out of the field
Figure 12 Map with indication of 10 observation plots scattered over the field FIELDNR YEAR LOCATION FARMER POTATO VARIETY GROWING PERIOD
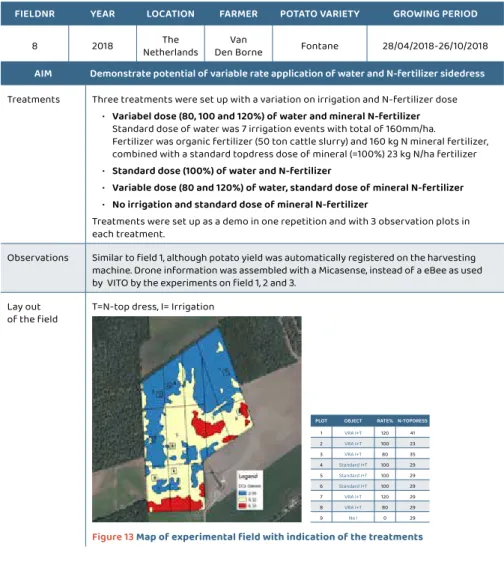
AIM Demonstrate potential of variable rate application of water and N-fertilizer sidedress
Treatments Three treatments were set up with a variation on irrigation and N-fertilizer dose • Variabel dose (80, 100 and 120%) of water and mineral N-fertilizer
Standard dose of water was 7 irrigation events with total of 160mm/ha.
Fertilizer was organic fertilizer (50 ton cattle slurry) and 160 kg N mineral fertilizer, combined with a standard topdress dose of mineral (=100%) 23 kg N/ha fertilizer • Standard dose (100%) of water and N-fertilizer
• Variable dose (80 and 120%) of water, standard dose of mineral N-fertilizer • No irrigation and standard dose of mineral N-fertilizer
Treatments were set up as a demo in one repetition and with 3 observation plots in each treatment.
Observations Similar to field 1, although potato yield was automatically registered on the harvesting machine. Drone information was assembled with a Micasense, instead of a eBee as used by VITO by the experiments on field 1, 2 and 3.
Lay out
of the field T=N-top dress, I= Irrigation
Figure 13 Map of experimental field with indication of the treatments
FIELDNR YEAR LOCATION FARMER POTATO VARIETY GROWING PERIOD
8 2018 NetherlandsThe Den BorneVan Fontane 28/04/2018-26/10/2018
PLOT OBJECT RATE% N-TOPDRESS
1 VRA I+T 120 41 2 VRA I+T 100 23 3 VRA I+T 80 35 4 Standard I+T 100 29 5 Standard I+T 100 29 6 Standard I+T 100 29 7 VRA I+T 120 29 8 VRA I+T 80 29 9 No I 0 29
5 // Experiments
33
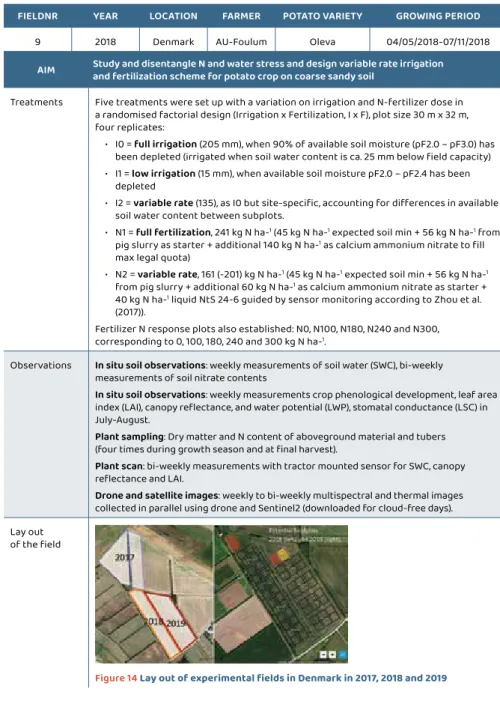
AIM Study and disentangle N and water stress and design variable rate irrigation and fertilization scheme for potato crop on coarse sandy soil
Treatments Five treatments were set up with a variation on irrigation and N-fertilizer dose in a randomised factorial design (Irrigation x Fertilization, I x F), plot size 30 m x 32 m, four replicates:
• I0 = full irrigation (205 mm), when 90% of available soil moisture (pF2.0 – pF3.0) has been depleted (irrigated when soil water content is ca. 25 mm below field capacity) • I1 = low irrigation (15 mm), when available soil moisture pF2.0 – pF2.4 has been
depleted
• I2 = variable rate (135), as I0 but site-specific, accounting for differences in available soil water content between subplots.
• N1 = full fertilization, 241 kg N ha-1 (45 kg N ha-1 expected soil min + 56 kg N ha-1 from
pig slurry as starter + additional 140 kg N ha-1 as calcium ammonium nitrate to fill
max legal quota)
• N2 = variable rate, 161 (-201) kg N ha-1 (45 kg N ha-1 expected soil min + 56 kg N ha-1
from pig slurry + additional 60 kg N ha-1 as calcium ammonium nitrate as starter +
40 kg N ha-1 liquid NtS 24-6 guided by sensor monitoring according to Zhou et al.
(2017)).
Fertilizer N response plots also established: N0, N100, N180, N240 and N300, corresponding to 0, 100, 180, 240 and 300 kg N ha-1.
Observations In situ soil observations: weekly measurements of soil water (SWC), bi-weekly
measurements of soil nitrate contents
In situ soil observations: weekly measurements crop phenological development, leaf area
index (LAI), canopy reflectance, and water potential (LWP), stomatal conductance (LSC) in July-August.
Plant sampling: Dry matter and N content of aboveground material and tubers
(four times during growth season and at final harvest).
Plant scan: bi-weekly measurements with tractor mounted sensor for SWC, canopy
reflectance and LAI.
Drone and satellite images: weekly to bi-weekly multispectral and thermal images
collected in parallel using drone and Sentinel2 (downloaded for cloud-free days). Lay out
of the field
Figure 14 Lay out of experimental fields in Denmark in 2017, 2018 and 2019 FIELDNR YEAR LOCATION FARMER POTATO VARIETY GROWING PERIOD
AIM Achieve maximal variation in water and N status in the crop trough the field
Treatments Four treatments were set up with a variation on irrigation and N-fertilizer dose, with as aim to achieve a variation in water and N-status trough the field:
• No mineral N-fertilizer, organic fertilizer (15 ton cattle slurry and 30 ton cattle manure) and full irrigated (147.5 mm spread over 5 irrigation events) • Optimal N-fertilization, organic fertilizer (15 ton cattle slurry and 30 ton cattle
manure) combined with 380 kg Urea (30% (w/w) total nitrogen of which 7.3% (w/w) NO3-N, 7.3% (w/w) NH4-N and 15.4% (w/w) Urea-N)) and 122 kg CAN (Calcium
ammonium nitrate (27% (w/w) total nitrogen of which 13.5% (w/w) NO3-N and 13.5%
(w/w) NH4-N)); deficit irrigated (no irrigation)
• Optimal N-fertilization, organic fertilizer (15 ton cattle slurry and 30 ton cattle manure) combined with 380 kg Urea and 122 kg CAN; full irrigated
• Excessive N-fertilization, organic fertilizer (15 ton cattle slurry and 30 ton cattle manure) combined with 760 kg Urea and 244 kg CAN; full irrigated
Treatments were set up in a split plot design, with four observation plots in each treatment.
Observations In situ soil observations per observation plot: Soil water retention characteristics,
%C content, pH, soil moisture (7 time steps), NO3-N content in soil (7 time steps)
In situ plant observations per plot: Stomatal conductance (4 time steps)
Potato yield per observation plot. N exported by the crop, by measuring N content in the foliage and the tubers.
Drone flights were organized at 8 moments during the season whereby images were
taken with a RGB and multispectral camera. The following indices were derived: fCover, NDVI, ReNDVI, OSAVI, CIgreen and CIrededge, and a DSM was generated.
Sentinel-2 satellite images were obtained every 2-3 days during the season via
the Terrascope platform. The following indices were derived: CIgr, CIr, CWC, LAI, CCC, fCover, fAPAR, MSI, NDVI, NDWI and NDRE.
EMI Soil scan: The field was scanned with EMI systems that measure simultaneously
apparent electrical conductivity (ECa) [mS/m], i.e., weighted average over 9 depth ranges between 0-0.25 m and 0-2.7 m.
Yara N plant scan executed 10/06/2019.
Lay out of the field
Figure 15 Map with indication of 16 observation plots,
4 plots per treatment lay out in a split plot design as indicated above
FIELDNR YEAR LOCATION FARMER POTATO VARIETY GROWING PERIOD
5 // Experiments
35
AIM Study spatial variation in the field, similar as field 2
Treatments No specific treatments, fertilization (25 ton pig slurry combined with 400 kg CAN) and irrigation (148 mm spread over 5 irrigation events) according to farmers practices. Observations In situ soil observations per observation plot: Soil water retention characteristics,
%C content, pH, soil moisture (8 time steps), NO3-N content in soil (8 time steps)
In situ plant observations per observation plot: Stomatal conductance (3 time steps) Potato yield per plot. N exported by the crop, by measuring N content in the foliage and
the tubers.
Drone flights were organized at 8 moments during the season whereby images were
taken with a RGB and multispectral camera. The following indices were derived from the drone images: fCover, NDVI, ReNDVI, OSAVI, CIgreen and CIrededge, and a digital surface model was generated.
Sentinel-2 satellite images were obtained every 2-3 days during the season via the
Terrascope platform. The following indices were derived from the Sentinel-2 satellite images: CIgr, CIr, CWC, LAI, CCC, fCover, fAPAR, MSI, NDVI, NDWI and NDRE.
EMI Soil scan: The field was scanned with EMI systems that measure simultaneously
apparent electrical conductivity (ECa) [mS/m], i.e., weighted average over 9 depth ranges between 0-0.25 m and 0-2.7 m.
Yara N plant scan executed 10/06/2019.
Lay out of the field
Figure 16 Map with indication of 12 observation plots scattered over the field FIELDNR YEAR LOCATION FARMER POTATO VARIETY GROWING PERIOD
AIM Study potential of different irrigation management zones
Treatments Two treatments were set up with a variation on irrigation
• Zone with low electrical conductivity with higher water demand: 6 irrigation events and total 180 mm
• Zone with high electrical conductivity with lower water demand: 6 irrigation events and total 165 mm
Treatments were set up as a demo in one repetition and with 4 observation plots in each treatment.
Observations Similar to field 1, although potato yield was automatically registered on the harvesting machine. Drone information was assembled with a Micasense, instead of a eBee as used by VITO by the experiments on field 1, 2 and 3.
Lay out of the field
Figure 17 Map of experimental field with indication of zone with high and low conductivity
FIELDNR YEAR LOCATION FARMER POTATO VARIETY GROWING PERIOD
5 // Experiments
37
AIM Study and disentangle N and water stress and design variable rate irrigation and fertilization scheme for potato crop on coarse sandy soil
Treatments Five treatments were set up with a variation on irrigation and N-fertilizer dose in a randomised factorial design (Irrigation x Fertilization, I x F), plot size 30 m x 30 m, four replicates:
• I0 = full irrigation (154 mm), when 90% of available soil moisture (pF2.0 – pF3.0) has been depleted (irrigated when soil water content is ca. 25 mm below field capacity) • I1 = low irrigation (30 mm), when available soil moisture pF2.0 – pF2.4 has been
depleted
• I2 = variable rate (103), as I0 but site-specific, accounting for differences in available soil water content between subplots.
• N1 = full fertilization, 237 kg N ha-1 (41 kg N ha-1 expected soil min + 56 kg N ha-1 from
pig slurry as starter + additional 140 kg N ha-1 as calcium ammonium nitrate to fill
max legal quota)
• N2 = variable rate, 177 kg N ha-1 (41 kg N ha-1 expected soil min + 56 kg N ha-1 from pig
slurry as starter + additional 40 and 40 kg N ha-1 as liquid NtS 24-6 guided by sensor
monitoring according to Zhou et al. (2017)).
Fertilizer N response plots also established: N0, N100, N180, N240 and N300, corresponding to 0, 100, 180, 240 and 300 kg N ha-1.
Observations In situ soil observations: weekly measurements of soil water (SWC), bi-weekly
measurements of soil nitrate contents
In situ plant observations: weekly measurements crop phenological development,
three measurements of leaf water potential (LWP) and stomatal conductance (LSC) in July.
Plant sampling: dry matter and N content of aboveground material and tubers
(four times during growth season and at final harvest).
Plant scan: bi-weekly measurements with tractor mounted sensor (time-domain
reflectometer probes) for SWC, canopy reflectance (RapidScan, Holland Scientific, USA) and LAI.
Drone and satellite images: weekly to bi-weekly multispectral and thermal images
collected in parallel using drone and Sentinel2 (downloaded for cloud-free days). Lay out
of the field See Figure 14 for layout of the field
FIELDNR YEAR LOCATION FARMER POTATO VARIETY GROWING PERIOD
6
Quantification of the water and N deficit
at the experimental fields using in-situ
measurements
6.1 QUANTIFICATION OF THE WATER DEFICIT WITH IN-SITU MEASUREMENTS
6.1.1 Belgium
Irrigation on the trial fields was scheduled using the soil water balance, as described in paragraph 3. The difference in soil moisture between the irrigated and non irrigated treatments was clearly visible in 2017, 2018 and 2019 (Figure 18). In al years total evapotranspiration exceeded total rainfall during the growing season.
Figure 18 Soil water balance of irrigated and non irrigated treatment of field 10 in Belgium in 2019.
//
6 // Quantification of the water and N deficit at the experimental fields using in-situ measurements
39 Figure 19 Relation between average soil moisture and average stomatal conductance on Field 1 (Belgium, 2017). Average was calculated over four observations during the growing season (a); Relation between average soil moisture and average stomatal conductance on Field 6 (Belgium, 2018). Average was calculated over four observations during the growing season (b) and Relation between average soil moisture and average stomatal conductance on Field 10 (Belgium, 2019). Average was calculated over four observations during the growing season (c). Figure 20 Relation between yield and average stomatal conductance on Field 1 (Belgium, 2017). Average was calculated over four observations during the growing season (a); relation between yield and average stomatal conductance on Field 6 (Belgium, 2018). Average was calculated over four observations during the growing season (b) and relation between yield and average stomatal conductance on Field 10 (Belgium, 2019). Average was calculated over four observations during the growing season (c).
For comparison with drone and satellite imagery water deficit was quanti-fied by observations of stomatal conductance. Stomatal closure is a crop response related to water deficit in the soil. Stomatal closure was moni-tored with a porometer (Decagon Devices, 2010) in experimental Fields 1, 4, 6, 10 and 11 (see paragraph 5). During the POTENTIAL project stomatal closure could be related to soil moisture content (Figure 19) and to crop yield (Figure 20). Stomatal Conductance (mmol/m²s) Stomatal conductance (mmol/m² s) Stomatal conductance (mmol/m² s) Stomatal conductance (mmol/m² s) Stomatal Conductance (mmol/m²s) Stomatal conductance (mmol/m² s) (b) (a) (c) (b) (a) (c)
6.1.2 Denmark
In the Danish potato field trials, water deficit was quantified as the differ-ence between the measured soil water content throughout the season and the soil water content at field capacity measured before the start of the experiment. Maximal (control, farmers practice) irrigation aimed to main-tain field capacity and was applied when actual soil water was about 80% of the field capacity. Optimized irrigation aimed to apply smaller but more strategic amounts of water and was applied if actual soil water is about 70% of field capacity (spatially variable). Water stressed trials included irrigation only when soil water deficit does not change, i.e., when soil water content approached wilting point (Figure 21). The decision when to irrigate was also complemented with the weather forecast offered by the Danish Meteorological Institute. Figure 21 Average soil water deficit (difference between soil water content during the season and at field capacity) for the potato trials in Denmark in 2018. Irrigation decision was based on whether soil water deficit is about 90% of field capacity (maximal irrigation), about 30% of field capacity (optimized spatially variable irrigation), or towards reaching wilting point (deficit irrigation). Circles on x-axis (color according to trial) denote irrigation events.
6 // Quantification of the water and N deficit at the experimental fields using in-situ measurements
41 Figure 22 Correlation between potato yield and average NO3-N concentration, measured on 5 to 6 moments
during the growing season, in the soil profile for Field 1 (a) in Belgium in 2017; for Field 6 (b) in Belgium in 2018 and for Field 10 (c) in Belgium.
6.2 QUANTIFICATION OF THE NITROGEN DEFICIT
6.2.1 Belgium
In Belgium nitrogen deficit was quantified by NO₃-N concentration in the soil. NO₃-N content in the soil was measured 5 times during the growing season. Average NO₃-N concentration in the soil profile was correlated to tuber yield in Field 1, Field 6 and Field 10 in Belgium (Figure 22). These were the fields where fertilization experiments were set up.
Average NO3-N in soil profile
(kg/ha) Average NO3
-N in soil profile
(kg/ha) Average NO3
-N in soil profile
(kg/ha)
Soil sampling
(b)
6.2.2 Denmark
For the field trials in Denmark, N deficit was quantified by the relationship between two canopy indices, ratio vegetation index (RVI) and leaf area index (LAI). A previous study showed that the RVI-LAI relationship developed for potato on field scale can be used to detect N stress and to guide N ferti-lization (Figure 23; Zhou et al., 2017). The RVI-LAI relationship was estab-lished from field measurements during the season in “N fertilizer response” trials (fertilizer range from 0 to 300 kg N ha-1) and RVI was measured with
a handheld multispectral sensor RapidScan C45 (Holland Scientific, USA), whereas LAI was measured by a LAI-2000 instrument (Li-Cor, Inc, Lincoln, NE, USA). The RVI-LAI relationship at field scale is shown on Figure 24, and this approach was used to guide fertilization decision (time and amount). However, the approach cannot be upscaled on drone- or satellite level because both LAI and RVI would be derived from the same reflectance data, thereby imposing the collinearity issue. Therefore, other indices from drone and Sentinel-2 data were investigated, as elaborated in the next chapters.
6 // Quantification of the water and N deficit at the experimental fields using in-situ measurements 43 Figure 23 Relationship between ratio vegetation index (RVI) and leaf area index (LAI) for potato trials in Denmark (Zhou et al., 2017). The relationship curve is flanked by ±95% confidence intervals, below which is the N deficiency area (as indicated by the red point). Figure 24 Relationship between ratio vegetation index (RVI) and leaf area index (LAI) for the POTENTIAL field trials in Denmark in 2017 (upper plots) and 2018 (lower plots). The dots represent the experimental plots, the red line is the ±95% confidence levels of the relationship, below which is the N deficiency area. Fertilizer was applied 13-Jul 2017 and 03-Aug 2018.
7
Potential of multispectral drone imagery
7.1 TYPES OF DRONES AND CAMERAS
7.1.1 The use of drones in agriculture
Practical applications for UAVs (unmanned aerial vehicles) or RPAS (Remotely Piloted Aerial Systems), commonly referred to as “drones”, have progressed significantly in recent years. In particular for the agriculture sector, drones offer a range of opportunities.
Drones permit farmers to obtain a “birds-eye-view” of their fields “on-de-mand”. Drone flights are carried out at low altitude, even in the event of cloud cover. The highly detailed images taken by the drones allow farmers to detect subtle, local changes in crop growth within the field that cannot always be identified by regular field visits at ground level. The changes in crop growth observable by drone imagery can be related to water stress or excess, nutrient deficiencies, pest infestations, crop diseases, or other conditions affecting crop development.
Drones can be equipped with various types of cameras to capture the light reflected by the crop below:
RGB cameras:
Multipurpose, cheap cameras, capturing Red, Green, and Blue light.
The images are similar to what is seen with the human eye, meaning they are easy to interpret .
RGB images are useful to detect zones within the field with emergence problems or zones affected by pests, diseases or extreme weather events such as strong winds, hail (when damage is visible by the human eye).
7 // Potential of multispectral drone imagery
45 RGB images can be used to count plants, calculate the
percent-age of soil cover (fCover) or get an idea of the crop’s develop-ment stage.
RGB images have a better spatial resolution (compared to other image types discussed below, from the same flight height). This means that finer details are visible, and denser and more accu-rate 3D models can be derived from RGB imagery.
Multispectral cameras:
Multispectral cameras capture light not only in the visible (RGB) but also in the infrared part of the light spectrum (the Red Edge and Near-InfraRed (NIR)). The infrared part of the light is not visible to the human eye, but is interesting for plant studies, as plants reflect more light in the infrared than they do in the visible part. Multispectral refers to the fact that images are captured in
a limited number of spectral bands, mostly between 3 and 6 bands of which the most common are the Red, Green, Red Edge and NIR bands.
Multispectral drone images reveal variation within the field in a quantitatively reliable way and can be used to generate variable rate prescriptions for nitrogen, pesticides, irrigation of other applications. Well calibrated multispectral camera systems deliver images
which can be compared over time.
The resolution of multispectral images (pixel size) is usually between 5 and 10 cm and hence slightly lower than for RGB images (< 3 cm).
By combining multispectral images “vegetation indices” can be derived. A simple and popular index computed from Red and NIR images is the NDVI. This index provides information on the crop’s greenness or health. Other indices such as the red edge NDVI (NDRE) or red edge chlorophyll index (CIre) are particularly useful for early stress detection.
The position of the spectral bands differs between multi-spectral cameras. This is especially important for the very narrow red edge bands and can affect the interpretation of the resulting vegetation index maps based on these bands.
Hyperspectral cameras:
Mostly experimental cameras, and today still rather expensive. Hyperspectral cameras also capture images in the visible and
infrared part of the light spectrum but compared to multi-spectral imaging, hypermulti-spectral imaging involves a greater num-ber of narrower spectral bands, sometimes more than 2000. Hyperspectral images offer more opportunities to detect
dis-eases in an early stage or to identify weeds by using informa-tion from very specific parts of the light spectrum.
Thermal cameras:
Thermal sensors can read the radiated temperature of an object.
Plants with access to more water appear cooler in an image. As such a thermal sensor can help identify how plants are using water and detect drought stress.
Interpreting thermal images may be challenging though. Temperature variations within the image are sometimes minor and it may be difficult to distinguish drought stress from the other factors that might heat or cool the plant, such as breezes, sun exposure, etc.
7 // Potential of multispectral drone imagery
47 Many types of drones are available today. Those suitable for agricultural appli-cations fall into three categories: fixed-wing, multi-rotor and hybrid drones.
Fixed-wing drones:
Small planes in the form of a non-movable wing and a propeller that facilitates forward movement.
These drones have long-range flight capacity, an advantage when a large area is to be covered.
They fly 2-3 times faster than multi-rotors and take much less time to cover a field compared to a multi-rotor at the same resolution and overlap
Fixed wing drones generally require more open space for take-off and landing. In practice, this often means that a neighboring grass field is needed for take-off and landing.
Fixed wing drones are generally more expensive than multi-rotors.
Multi-rotors:
Small helicopters with 4 to 8 rotors
Multi-rotor drones can take off and land vertically and are therefore easier and faster to use within the field of interest itself.
Multi-rotors [KP6] can fly at lower altitudes to capture extremely detailed images.
Flight time is often limited to 15-20 minutes by the drone’s battery life. Hence, only small areas can be covered in a single flight.
Hybrid drones:
These drones resemble fixed wing drones but can take off and land vertically, by using tilting rotors or using a tail structure to stand vertically and transition into a horizontal cruise flight. They combine the advantages of large coverage and within-field
operation.
Being more complex, hybrid drones are still more expensive and are not yet fully recognized by Belgian law.