A virtual curtain for the detection of humans
and access control
Olivier Barnich, Sébastien Piérard, and Marc Van Droogenbroeck INTELSIG Laboratory, Montefiore Institute, University of Liège, Belgium
Abstract Biometrics has become a popular field for the development of techniques that aim at recognizing humans based upon one or more intrinsic physical or behavioral traits. In particular, many solutions ded-icated to access control integrate biometric features like fingerprinting or face recognition.
This paper describes a new method designed to interpret what happens when crossing an invisible vertical plane, called virtual curtain hereafter, at the footstep of a door frame. It relies on the use of two laser scanners located in the upper corners of the frame, and on the classification of the time series of the information provided by the scanners after registration. The technique is trained and tested on a set of sequences representative for multiple scenarios of normal crossings by a single person and for tentatives to fool the system.
We present the details of the technique and discuss classification results. It appears that the technique is capable to recognize many scenarios which may lead to the development of new commercial applications.
1
Introduction
Detecting a person, locating him, and recognizing its identity are three corner-stones of applications turned on security. Over the past years, many technologies based on biometrical signatures have emerged to achieve these goals. The hand-book by Jain et al. [1] illustrates the many techniques available today. They ranges from fingerprinting, voice recognition, face detection, dental identifica-tion techniques to iris, gesture or gait recogniidentifica-tion, just to name a few.
In this paper, we propose a new platform (comprising hardware and soft-ware) for critical applications such as secure access control, where biometrics has became a viable technology, that can be integrated in identity management systems. Commonly, access to restricted areas is monitored by a door with an electrical lock or a revolving door activated by the swipe of an access control card. In this context, we aim for a system able to send an alarm when the ex-pected scenario of a single person crossing the door frame is not confirmed; this could occur when someone enters a restricted area by passing through the door at the same time as another person (this is called piggybacking when the other person is authorized and tailgating when the other person is unauthorized).
The purpose of our method is to identify the scenario of one or more persons when they cross a door frame. While camera driven solutions exist for it, we
deliberately chose to rely of laser scanners instead because they can be directly embedded in a door frame and do not require a controlled environment. In addition, the complete solution is required to operate in real time with a limited amount of processing power, and it appeared that the choice of laser scanners proved adequate, retrospectively.
The article by Sequeira et al. [2] is representative for the problems faced with laser scanners. Some of them are:
– occlusions and shadows. Objects located beyond other objects are not
de-tected (occlusion) and, likewise, it is impossible to interpret the scene beyond the first object reached by the rays of a laser (shadowing).
– angle of acquisition. Laser scanners have a narrow aperture angle in one
or two dimensions. Also, as the technology is based on a sender/receiver mechanism, physical properties and the angle of incidence are important.
– scan overlap. To interpret fast movements, data has to be captured either
at a high speed, or with a fair overlap between successive scans. A practical solution consists in the use of linear scanners with a high acquisition rate.
– scan resolution. Radial scanners output distances of closest objects for a
fixed set of angles. The radial sampling might be uniform, this does not mean that the precision on the distance both in the direction of the light ray or in the direction perpendicular to it is uniform as well. In fact, objects should be closer to increase the measurement accuracy, but the price to pay is an increased shadowing effect.
The paper is organized as follows. As we propose an original placement of laser scanners and a new method to build a virtual curtain (which is an invisible and immaterial membrane), we first describe our set-up in Section 2. From this ar-rangement of scanners, we derive the notion of a virtual curtain, described in Section 2.2. This concept is the key of a classification process detailed in Sec-tion 3. First, surfacic features are extracted from the intersecSec-tion of the curtain and an object or a person that crosses it. Then we concatenate these features over time to derive a windowed temporal signature. This signature is then used to identify the scene by a classification process; the purpose is to raise an alarm when the normal situation of a single person crossing the curtain is not met, for example when several persons want to pass the door simultaneously. Results of this classification method obtained over a database of more than 800 sequences are provided in Section 4. Section 5 concludes the paper.
2
Original set-up
A real security application requires that the system is insensitive to lighting conditions. Consequently, we cannot afford using a background subtracted video stream to recover the binary silhouettes of the walkers. Instead, we use laser devices described in the next section. Then we develop the concept of virtual curtain.
2.1 Sensors
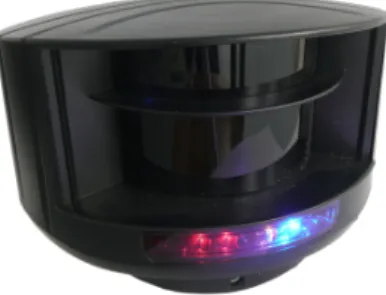
Laser range sensors are widely used nowadays. Simple devices measure distances for a few 3D directions, but more sophisticated sensors exist. For example, there are devices that are used in conjunction with rotating mirrors to scan a 360° field of view. For our platform, we use the rotating laser sensors manufactured by B.E.A. (see Figure 1).
Figure 1. The laser sensor used in our experiments (the LZR P-200 manufactured by B.E.A. S.A., http://www.bea.be).
These laser range sensors are completely independent of the lighting con-ditions, as they rely on their own light sources. They are able to measure the distance between the scanner and surrounding objects by sending and receiving laser pulses in a plane. The measurement process is discrete; it samples the an-gles with an angular precision of 0.35° and covers an angular aperture of 96°. The plane is scanned 60 times per second. In practical terms, these sensors deliver a signal dt(θ) where (1) d is the distance between the sensor and the object hit by the laser ray, (2) θ denotes the angle in the scanning plane (0 ≤ θ ≤ 96°), and (3) t (= k
60sfor k = 0, 1, 2, . . .) is the time index.
The information that these sensors provide has a physical meaning (the dis-tance is given in millimeters) and relates only to the geometrical configuration; the color and texture of objects have no impact on the measurements. Note also that these sensors have been designed to be integrated in difficult industrial environments, like revolving doors, where a camera might not fit as well.
2.2 Towards the concept of virtual curtain
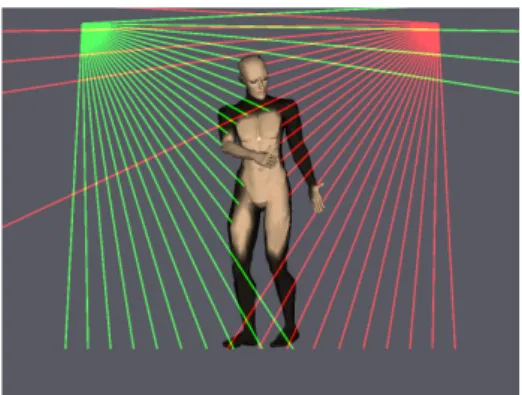
Theoretically, a single scanner suffices to build a 2D shape. However, we have decided to use two scanners to reduce the shadowing effects resulting from a single scanner. The sensing system is made of two laser scanners located in the two upper corners of the frame of a door (see Figure 2). Consequently, distances are measured in a plane that comprises the vertical of the gravity and
the straight line joining the two sensors. This is our concept of virtual curtain. To some extend, it can be seen as a wide traversable waterfall, except that you don’t get wet if you cross it!
Figure 2. Arrangement of the sensors. The two rotating laser range sensors are located in the upper corners of a vertical plane. They send rays that hit the lateral door frame, the ground or a person crossing the plane.
It must be noted that signals collected from the two sensors are not synchro-nized. This impacts on the system. A detailed analysis of the physical uncertainty resulting from desynchronization shows that, in the worst case, a shift of 10 cm at the height of the knee is possible. As a matter of fact, the physical precision on the location of a point increases with its height in the reconstructed plane. In other words, the horizontal imprecision, due to desynchronization, decreases with the height of a point.
Furthermore, as measures correspond to the distance between the sensor and the first point hit by the laser along its course, they account for a linear information related to the central projection of the silhouette of the moving objects passing through the door; it implies that points located beyond the first point are invisible and that widths are impossible to measure with a single scanner. With two scanners, there are less ambiguities but some of them remain, for example in the bottom part of the silhouette. Furthermore, a hole in the silhouette cannot be detected. In practice, the subsequent classification algorithm has to be robust enough to be able to deal with these ambiguities.
2.3 Computing a virtual curtain
We now describe how to build a series of silhouettes of a walking human crossing the virtual curtain.
Polar transformation and registration of the two signals. Since the
re-construction of an image related to the shape of the scanned objects is a polar transformation of the raw signals:
xt(θ) = dt(θ) cos(θ), (1)
yt(θ) = dt(θ) sin(θ). (2)
Every 1
60s, we get two signals dt(θ) covering the quarter area of a plane, one
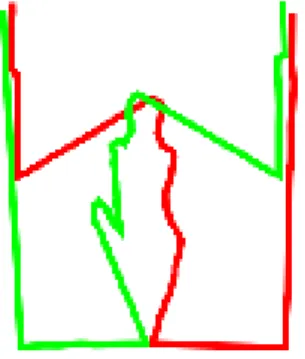
per sensor, and apply a polar transformation to them. Then we connect succes-sive points with straight line segments and register the two signals according to the width of the frame of the door. This process is illustrated in Figure 3.
Figure 3. Construction of a curve per sensor that corresponds to the closest visible points. The signal captured by the left (right) sensor is displayed in green (red).
Thanks to the calibration of the sensors and the real physical distances they deliver, the registration process is simple as it relies exclusively on the physical dimensions of the door. Note however that since the signals provided by the two sensors are not synchronized, the registration of the sensor signals will be affected by a time jitter that impacts on the overall signal to noise ratio.
Flood fill and intersection. For each laser scanner, we now have a continuous
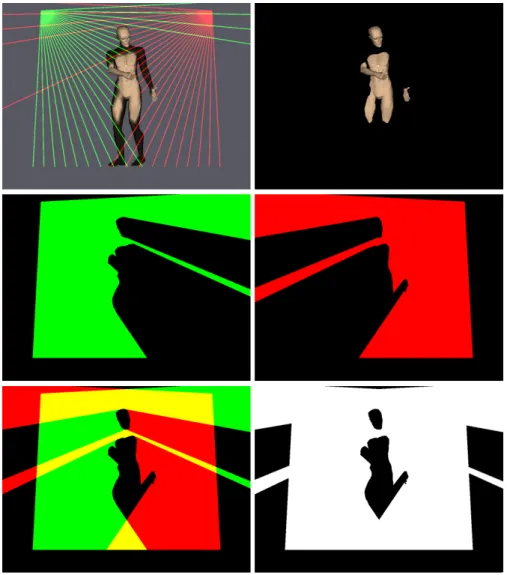
line that outlines one side of the silhouette of the object seen in the curtain. We still need to reconstruct one complete silhouette. The reconstruction of a half silhouette is achieved by closing the contour and applying a flood fill algorithm to the continuous line that outlines it. Then the two half silhouettes are intersected to get the silhouette. The reconstruction process is illustrated in Figure 4.
We can see that the upper parts of the silhouette (in principle, the shoulders and the head) are better represented than the lower parts of the silhouette because the lasers are closer to the upper part and thus do sample this part of the shape with a higher precision. As a matter of fact, the legs are almost absent from the reconstructed silhouettes. Furthermore, we showed in Section 2.2 that the lack of synchronization of the sensors causes an horizontal imprecision that decreases with the height of a point.
Figure 4. Illustration of the silhouette reconstruction process.
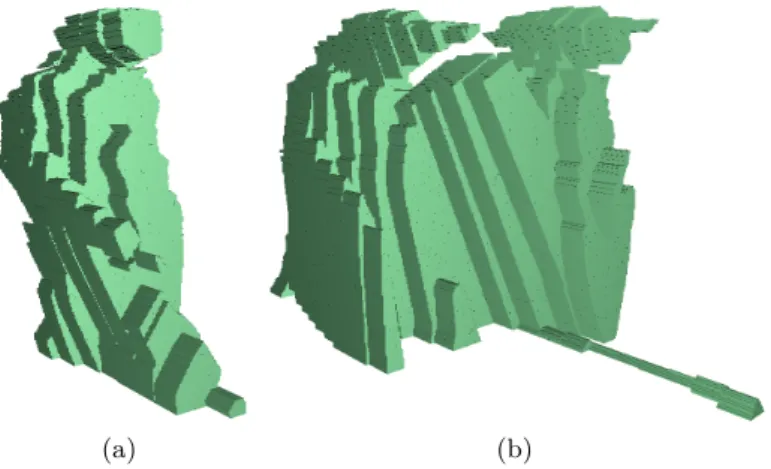
The reconstruction of a silhouette happens 60 times per second. Figure 5 shows a 3D volume obtained by piling up the successive silhouettes of one (left-hand side picture) or two (right-(left-hand side picture) persons while they cross the curtain. This 3D shape is not very intuitive. Therefore we need to elaborate on the appropriate features to describe it.
3
Features extraction and classification
The closest field to our application in the literature is that of human gait recog-nition where relevant features are extracted from the time series of the binary
(a) (b)
Figure 5. Volume whose slices are consecutive silhouettes of one person (a) or two persons (b) crossing the curtain over time.
silhouettes of a moving object. Classification is then performed on the basis of these features (often referred to as signature) to recover the identity of the walk-ing human in front of the camera. In our application, we can use these features extraction and classification techniques to identify the time series of silhouettes that correspond to a single walking human from the others.
A good introductory reading about gait recognition can be found in [3,4,5]. An extensive review of the existing techniques is presented in [6].
Model-based approaches process sequences of images to estimate the param-eters of an explicit gait model. These estimated values are then used to recover the identity of the walking human. It should be noted that, in our case, these silhouettes need to be reconstructed from the contour-related information given by the two radial sensors.
These methods often need high definition images in order to work properly which is a major drawback for our application since the laser sensors only provide 274 points per scan for an angular aperture of 96°. Furthermore, they exhibit a significantly higher computational cost than silhouette-based techniques. This is also a serious issue since real-time processing is required in our application.
Silhouette-based approaches do not rely on any explicit model for the walking human(s). These techniques extract signatures directly from series of silhouettes. A simple approach is described in [7] where the areas of raw (re-sized) silhouettes are used as a gait signature. In [8], the gait template of a walking human is computed by averaging the corresponding binary silhouettes. The classification is then achieved using a nearest neighbor technique.
The contours of silhouettes have been used in [9] and by Soriano et al. in [10] where signatures are derived from series of Freeman encoding of the re-sized silhouette shape. An angular transform of the silhouette is proposed in [11] and is said to be more robust than the raw contour descriptions.
The gait signature of [12] is based on horizontal and vertical projections of the silhouettes. The authors of [13] consider time series of horizontal and vertical projections of silhouettes as frieze patterns. Using the framework of frieze patterns, they estimate the viewing direction of the walking humans and align walking sequences from similar viewpoints both spatially and over time. Cross-correlation and nearest neighbor classification is then used to perform the identification of the walkers. To get an increased robustness to differences between the training and test sets, [14] proposes a technique that relies on frieze patterns of frame differences between a key silhouette and a series of successive silhouettes.
In our application, we apply an approach similar to silhouette-based gait recognition. First we extract surfacic features from a single silhouette. Then we aggregate features over time to obtain a temporal signature that is used to identify the ongoing crossing scenario.
3.1 Feature extracted from the intersection between an object and the virtual curtain
To characterize reconstructed silhouettes, we use the notion of cover by
rectan-gles. The cover by rectangles is a morphological descriptor defined as the union
of all the largest rectangles that can fit inside of a silhouette. The whole idea is described in [15].
From the cover of a silhouette, many features can be extracted to build a silhouette signature. Features that could be considered to characterize the dataset are:
– The set of the enclosed rectangles (that is, the cover itself).
– The maximum width (or height) of the rectangles included in the cover. – Histogram of the widths (or heights) of the rectangles included in the cover. – 2D histogram of the widths and heights of the rectangles included in the
cover.
– The horizontal or vertical profile of the silhouette.
Due to the unusual shape of the silhouette, there is no prior art about the best suited characteristics. Therefore, we fall back to proved intra-frame signatures that were considered in [16] for gait recognition. They are:
– The 2D histogram of the widths and heights of the rectangles included in
the cover (denoted as GW ×H(i, j)), and
– The concatenation of the histogram of the widths and the histogram of the
heights of the rectangles included in the cover (denoted as GW +H(i, j)). Note that in order to build histograms, we partition the widths and heights of the rectangles respectively into M bins and N bins. The best values for M, N are discussed later.
Temporal features. The full signature is constructed as a combination of
intra-frame silhouette signatures. Its purpose is to capture the time dynamics of the moving object crossing the door. In our application, the time dynamics may be very important. One of the proposed solution to handle the temporal evolution of a shape is to normalize the gait cycle, like in [17].
Like for gait recognition, this poses a problem in that the classifier will delay its answer until the end of the sequence. An alternative solution is to normalize the sequence by parts. Another approach to consider is to learn several speeds during the database set-up, and use the global normalization as a fallback or confirmation step.
Our approach is much simpler and provides results similar to results obtained with other approaches. Our inter-frame spatio-temporal signature (denoted as GW +H(i, j, t) or GW ×H(i, j, t)) is the concatenation of a given number L of consecutive intra-frame signatures.
3.2 Classification
Classification consists in the learning of a function from labeled input data. The learned function, sometimes referred to as model, is later used to predict the label of unlabeled data. The purpose of the classifier is to generalize the knowledge present in the labeled examples to new samples.
When a person crosses the virtual curtain, we reconstruct the time series of his binary silhouettes and assign a class to it with our classification algorithm. In this particular application, only two classes can be assigned to a series of silhouettes:
– “0”, which denotes that a single person has crossed the virtual curtain, – and “1”, which denotes that more than one person have crossed the virtual
curtain.
Learning and cross-validation. To build a classifier, it is necessary to label
(manually) a large amount of data samples. Part of these labeled samples are used to train the classifier. They constitute the “learning set”. Remaining labeled samples are used to evaluate the performances of the classifier; they are part of the “test set”.
A rule of thumb is to divide the available labeled data in two equal parts: one to train the model, and the other to test it. With only a few available labeled data, it may be disadvantageous to ignore half of the labeled data to train the model. A common solution is then to use cross-validation briefly described hereafter.
If there are N labeled samples, cross-validation consists in dividing them into
K subsets of equal size. (K − 1) subsets are used to train the model while the
remaining one is used to test it. This procedure is repeated K times, for each test set on turn. The final score of the classifier is the average of the K computed scores. When K = N, this method is called leave-one-out.
Classification tool. There are many classification techniques available. Among
the most popular are nearest neighbors classifiers (KNN), artificial neural net-works (ANN), (ensemble of) decision trees, and support vector machines (SVM). In our case, the sets of features extracted from the time series of reconstructed silhouettes are classified with a support vector machine classifier [18]. An SVM is a binary classifier that maps its input features into a high-dimensional non-linear subspace where a linear decision surface is constructed. We used the implemen-tation provided by libsvm [19] with a radial basis function (RBF) kernel.
4
Results
To evaluate the performances of our algorithm, the B.E.A. company has pro-vided us 349 labeled sequences of a single person (class “0”) and 517 sequences that contain two walkers (class “1”). We use these sequences to build databases of labeled signatures for different sets of parameters (M, N, and L are the pa-rameters, that is the number of bins for the rectangle widths, the number of bins for the rectangle heights, and the number of intra-frame features aggre-gated in a signature respectively). For each set of parameters, we employ 5-fold cross-validation on the corresponding database to assess the precision of the classification according to the error rate (E) defined by
E= F P + F N
T P + T N + F P + F N, (3)
where TP is the number of true positives, TN the number of true negatives, FP the number of false positives, and FN the number of false negatives.
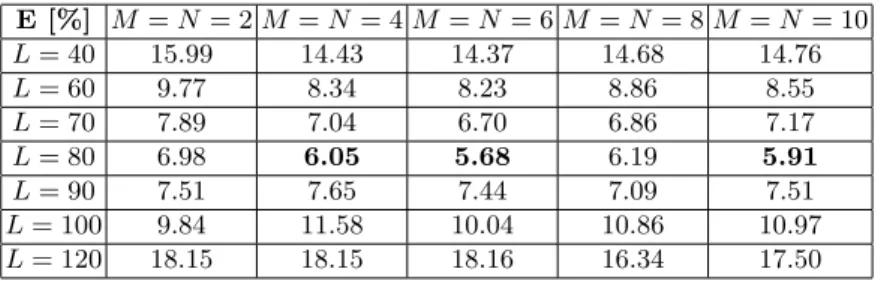
We tested both GW +H(i, j, t) and GW ×H(i, j, t). The two corresponding series of results are given in Table 1 and Table 2.
E [%] M = N = 2 M = N = 4 M = N = 6 M = N = 8 M = N = 10 L = 40 15.99 14.43 14.37 14.68 14.76 L = 60 9.77 8.34 8.23 8.86 8.55 L = 70 7.89 7.04 6.70 6.86 7.17 L = 80 6.98 6.05 5.68 6.19 5.91 L = 90 7.51 7.65 7.44 7.09 7.51 L = 100 9.84 11.58 10.04 10.86 10.97 L = 120 18.15 18.15 18.16 16.34 17.50 Table 1. Error rates obtained for GW +H(i, j, t).
They show that an error rate as low as 5.68% is reached for the GW +H(i, j, t) signature with M = N = 6, and L = 80. We also observe that, for this particular problem, L is the parameter with the largest variability in the result. From our tests, the best results are obtained for a signature length L of 80 frames, a num-ber that matches the average time to cross the curtain. For M and N, the choice
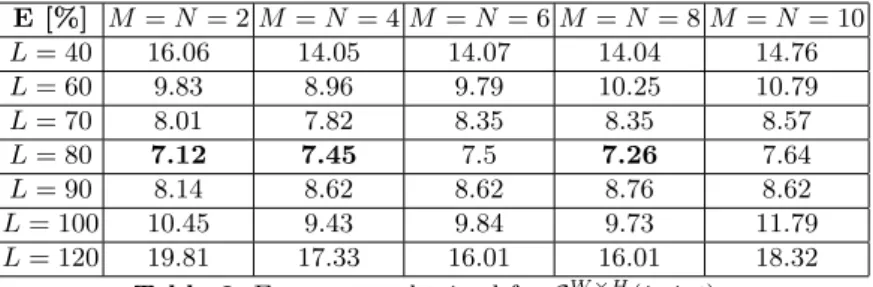
E [%] M = N = 2 M = N = 4 M = N = 6 M = N = 8 M = N = 10 L = 40 16.06 14.05 14.07 14.04 14.76 L = 60 9.83 8.96 9.79 10.25 10.79 L = 70 8.01 7.82 8.35 8.35 8.57 L = 80 7.12 7.45 7.5 7.26 7.64 L = 90 8.14 8.62 8.62 8.76 8.62 L = 100 10.45 9.43 9.84 9.73 11.79 L = 120 19.81 17.33 16.01 16.01 18.32 Table 2. Error rates obtained for GW ×H(i, j, t).
of a value is less critical but, from our tests, it appears that M = N = 4 is an ap-propriate choice. We also noticed that for this particular problem, GW +H(i, j, t) has slightly better results than GW ×H(i, j, t) while having a reduced computa-tional cost. One explanation to this is that the shadowing effect in the lower part of the silhouette adds more noise on GW ×H(i, j, t) than on GW +H(i, j, t).
Finally, it must be noted that during our tests, we observed that for low global error rates, the number of FN is considerably lower than the number of FP. In other words, the system is naturally more inclined to reject a single person than to allow to a group of two persons to pass the door. For an access control system, it is a welcomed property.
5
Conclusions
This paper introduces the concept of virtual curtain that is obtained by the registration of two linear laser scanners that measure distances in a same plane. Despite intrinsic shortcomings, originated by effects like occlusion or shadowing, features derived from an object crossing a virtual curtain permit to interpret the scene. In particular, it is shown how it is possible to differentiate between several scenarios for the context of access control. Features are first extracted for every intersection between an object and the curtain, then they are concatenated to provide a temporal signature. This signature is handled by a classification process that identifies the ongoing scenario. Results show that a high recognition rate is achievable for a pre-defined set of training and testing scenarios. In practice, we will have to wait for international standardization bodies or organizations to elaborate some criteria to benchmark the performances for a use under variable operational conditions. But our results proof that our system is tractable and usable for the interpretation of a scene.
Acknowledgments This work was supported by the Belgian Walloon Region
(http://www.wallonie.be). S. Piérard has a grant funded by the FRIA (http: //www.frs-fnrs.be/). We are also grateful to B.E.A. S.A. (http://www.bea. be), and in particular to Y. Borlez, O. Gillieaux, and E. Koch, and for their invaluable help.
References
1. Jain, A., Flynn, P., Ross, A.: Handbook of Biometrics. Springer (2008)
2. Sequeira, V., Boström, G., Gonçalves, J.: 3D site modelling and verification: usage of 3D laser techniques for verification of plant design for nuclear security applica-tions. In Koschan, A., Pollefeys, M., Abidi, M., eds.: 3D Imaging for Safety and Security. Springer (2007) 225–247
3. Boulgouris, N., Hatzinakos, D., Plataniotis, K.: Gait recognition: a challenging signal processing technology for biometric identification. IEEE Signal Processing Magazine 22(6) (November 2005) 78–90
4. Nixon, M., Carter, J., Shutler, J., Grant, M.: New advances in automatic gait recognition. Elsevier Information Security Technical Report 7(4) (2002) 23–35 5. Nixon, M.: Gait biometrics. Biometric Technology Today 16(7-8) (July 2008) 8–9 6. Nixon, M., Tan, T., Chellappa, R.: Human identification based on gait. Springer
(2006)
7. Foster, J., Nixon, M., Prügel-Bennett, A.: Automatic gait recognition using area-based metrics. Pattern Recognition Letters 24(14) (October 2003) 2489–2497 8. Huang, X., Boulgouris, N.: Human gait recognition based on multiview gait
se-quences. EURASIP Journal on Advances in Signal Processing 2008 (January 2008) 8 pages
9. Wang, L., Tan, T., Ning, H., Hu, W.: Silhouette analysis-based gait recognition for human identification. IEEE Transactions on Pattern Analysis and Machine Intelligence 25(12) (December 2003) 1505–1518
10. Soriano, M., Araullo, A., Saloma, C.: Curve spreads: a biometric from front-view gait video. Pattern Recognition Letters 25(14) (2004) 1595–1602
11. Boulgouris, N., Chi, Z.: Gait recognition using radon transform and linear dis-criminant analysis. IEEE Transactions on Image Processing 16(3) (March 2007) 731–740
12. Kale, A., Cuntoor, N., Yegnanarayana, B., Rajagopalan, A., Chellappa, R.: Gait analysis for human identification. In: Proceedings of the International Conference on Audio-and Video-Based Person Authentication, Guildford, UK (2003) 706–714 13. Liu, Y., Collins, R., Tsin, Y.: Gait sequence analysis using frieze patterns. In: Proceedings of the 7th European Conference on Computer Vision - Part II, London, UK, Springer-Verlag (2002) 657–671
14. Lee, S., Liu, Y., Collins, R.: Shape variation-based frieze pattern for robust gait recognition. In: IEEE International Conference on Computer Vision and Pattern Recognition (CVPR). (June 2007) 1–8
15. Barnich, O., Jodogne, S., Van Droogenbroeck, M.: Robust analysis of silhouettes by morphological size distributions. In: Advanced Concepts for Intelligent Vision Systems (ACIVS 2006). Volume 4179 of Lecture Notes on Computer Science., Springer (September 2006) 734–745
16. Barnich, O., Van Droogenbroeck, M.: Frontal-view gait recognition by intra- and inter-frame rectangle size distribution. Pattern Recognition Letters 30(10) (July 2009) 893–901
17. Boulgouris, N., Plataniotis, K., Hatzinakos, D.: Gait recognition using linear time normalization. Pattern Recognition 39(5) (May 2006) 969–979
18. Cortes, C., Vapnik, V.: Support-vector networks. Machine Learning 20(3) (1995) 273–297
19. Chang, C.C., Lin, C.J.: LIBSVM: a library for support vector machines. (2001) Software available at http://www.csie.ntu.edu.tw/~cjlin/libsvm.