X-Ray Microtomography Studies of Tannin-Derived Organic and Carbon Foams
Texte intégral
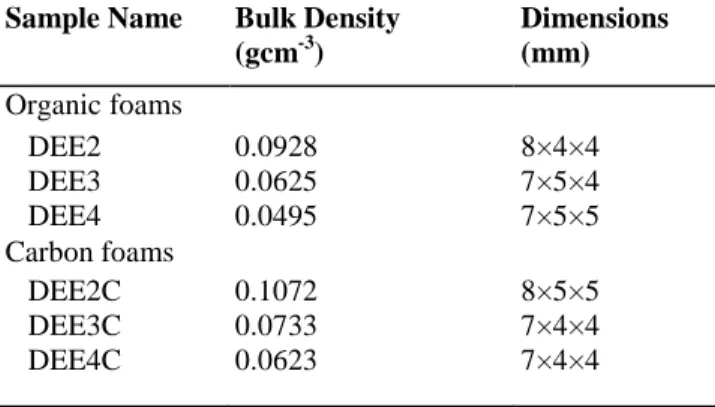
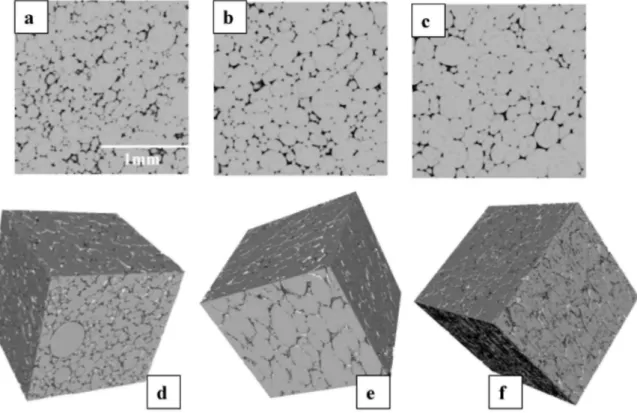
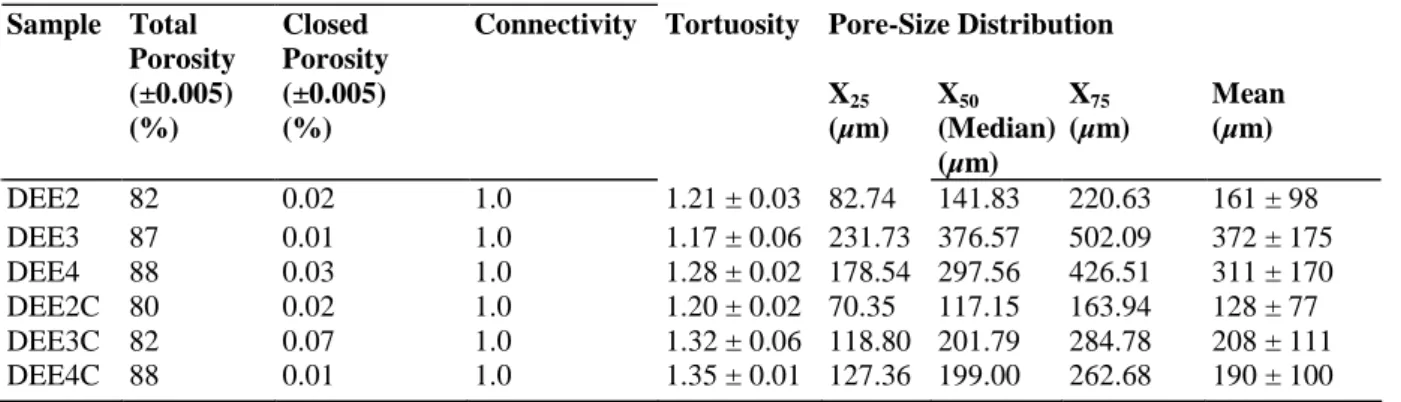
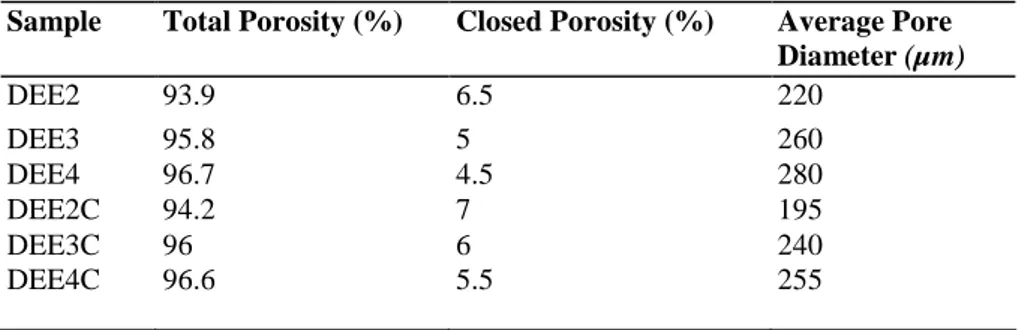
Figure
Documents relatifs
This paper proposes a transformation of the current tolerance analysis problem formulation into a parallel system probability assessment problem using the Lagrange dual form of
In the present study, erythrocyte GSH-Px activity was significantly lower in individuals homozygous or heterozygous for TNF -308 allele 2, and we hypothesized that
Elles sont généralement composées de blanc de plomb broyé dans l’huile, mais il peut aussi s’agir d’une simple couche d’huile siccativée (c'est-à-dire dont la
: Résultats des tests de Kruskal-Wallis (Hc) réalisés sur les données de production primaire brute globale (PPB) et de respiration de la communauté benthique (RC), lors de l'étude
A key question that remains unclear in the ICCAT Commission management recommendation is: which species are primarily targeted by the FAD-moratorium. While it seems implicitly
ﻓﻲ ﻋﺎم 1931ﺗﺣدث "ﺷﯾﻠون وﯾوﻧﻎ" ﻋن اﻟﻐﯾﺎب اﻟﻣطول ﻋن اﻟﻣدرﺳﺔ اﻟﺗﻲ ﻋرﻓت ﻗدﯾﻣﺎ ﺑﻣدرﺳﺔ اﻟﺗﺳﻛﻊ وﻟﻛن ﻣﻧذ ﻋﺎم 1932ﻗﺎم اﻟﺑﺎﺣث ﺑرودووﯾن
In order to properly include this additional stress-induced anisotropy during inversion for formation properties and the in situ stress estimation from logging data, a thorough
