In the last decade, near-infrared spectroscopy (NIRS) has taken an important place in the industrial field, especially in the pharma-ceutical industry. Indeed, this technique, which belongs to vibrational spectroscopy, shows numerous advantages including fast acquisition, non-invasive, non-destructive and minimisation of sample preparation and offers
the possibility to use probes. Furthermore, this solvent-free technique is a promising tool in Process Analytical Technology (PAT) and Green Chemistry frameworks.
As any analytical procedures, NIRS quanti -tative methods require a thorough validation before their applications in the pharmaceutical industry. Several notes and drafts for guidance
were published by different industrial or scientist groups and regulatory authorities in order to help analysts to decide if their quantitative methods are valid1-4. Despite these
publications, a lack of thorough validation of NIRS methods remains in literature.
Facing this situation, the objective of this review is to provide a new tool which offers analysts the possibility of having a critical overview of methodologies applied to assess the validity of quantitative methods using near-infrared spectroscopy. This review is oriented in pharmaceutical applications.
Decision methodologies used to
validate NIRS methods
There are four main decision method-ologies used to assess the validity of analytical methods, namely the descriptive approach
As in any analytical method, a mandatory step at the end of the development of a
near infrared spectroscopy (NIRS) method is the validation. This step ensures that
future results coming from the application of the method in routine will be
close enough to the true value. However, from the literature, a minority of
NIRS methods are thoroughly validated despite the guidelines published by
different group and regulatory authorities to help an analyst adequately decide
if his method can be considered as valid. In this context, the aim of this review is to
offer a critical overview of the different validation methodologies applied to assess
the validity of quantitative methods using near infrared spectroscopy used in the
field of pharmacy.
Validation methodologies
of near infrared
spectroscopy methods in
pharmaceutical applications
Pierre-François Chavez, Charlotte De Bleye, Pierre-Yves Sacré,Eric Rozet, Philippe Hubert and Eric Ziemons
Laboratory of Analytical Chemistry, CIRM, Department of Pharmacy, University of Liege
European Pharmaceutical Review
www.europeanpharmaceuticalreview.com 3 Volume 18 |Issue 1 |2013
Exchange information,
ideas and opportunities
http://linkd.in/PharmaReview
Join european pharmaceutical review on
using statistical descriptive parameters, the different approach using statistical hypothesis tests, the equivalence app-roach and the accuracy profile which is based on the statistical methodology of tolerance intervals5-8.
Most of the validation procedures per formed for NIRS methods in pharmaceutical applications fall in the descriptive approach which includes two main meth odologies: the use of traditional chemometric parameters and the criteria from the ICH Q2 guideline9.
Concerning traditional chemometric parameters, two steps are involved to validate a multivariate calibration model. The first step entails the use of a calibration set of data and using the cross-validation technique such as leave-one-out to assess the suitability of the R2
cal, the root mean square error of
calibration (RMSEC) and the root mean square error of the cross-validation (RMSECV) are computed. To optimise this calibration model, it is necessary to determine the optimal number of factors by plotting RMSEC and more especially RMSECV versus the number of factors. The RMSEC is decreased by increasing the number of factors and it also provides the most
optimistic estimate of the partial least squares (PLS) calibration model performance showing the ability of this multivariate calibration model to fit the observed data of the calibration
set. The second step consists of the use of an external set of data, not involved in the calibration procedure, to validate the NIR predictive model on future data. The R2
pred
NEAR INFRARED IN-DEPTH FOCUS
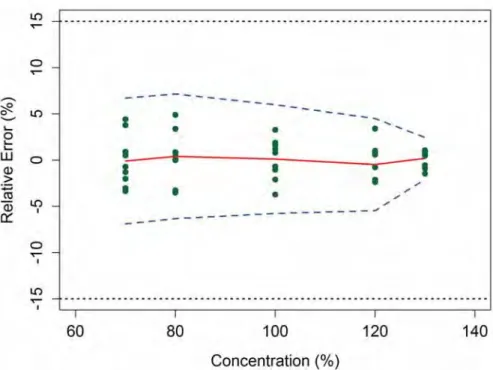
Figure 1 Accuracy profile obtained from an NIR method for the determination of an API in pharmaceutical tablets.
The plain line is the relative bias, the dashed lines are the β-expectation tolerance limits (β=95 per cent) and the dotted lines represent the acceptance limits (± 15 per cent)
Bruker Optik GmbH Rudolf-Plank-Str. 27 D-76275 Ettlingen Tel: +49 (7243) 504-2000 Fax: +49 (7243) 504-2050 E-Mail: [email protected]
Process Analytical
Technology
Today, many companies are not only striving to manufacture high quality products, but also increase production efficiency by installing the analytical systems directly into their production plants. This improves process verifiability and process understanding and gives the company the opportunity to optimize material use, run-time of machines and quality of the products up to real-time-release. Bruker´s spectroscopical technology based on modern FT spectrometers can be used at a lot of different process steps and offer high amount information to gain better process knowledge. The robust design of all spectrometers enables usage in tough conditions in production plants with very low maintenance costs/ times.
Contact us for more details:
www.bruker.com
Innovation with Integrity
F T-NIRMATRIX-F
FT-NIR Spectrometer
Allows in-line measurements e.g. in blender, granulators, dryers, and coaters leading to a better understanding and control of processes.
MATRIX-MF
FT-IR Spectrometer
Development/process spectrometer ideal for real-time monitoring and analysis of chemical and biological reactions.
MPA
FT-NIR Lab Spectrometer
Modular, multi-channel system for your needs in incoming goods identi-fication up to product or content uniformity control. and the root mean square error of prediction (RMSEP) are used to
evaluate the quantitative performance of the NIR model. At the end of this process, it is advised to readjust the number of factors in order to improve the performance of the developed NIR model by observing the criteria values. In this context, the closer to one of the value of R2
caland R2predare and the smaller the values of RMSEC,
RMSECV and RMSEP are, better is the developed NIR method. The problem of the traditional chemometric validation application in literature is that, most of the time, there is no evaluation of quantitative criteria which are trueness, precision, results accuracy, linearity and valid dosing range. Therefore, the pharmaceutical regulatory requirements concerning method validation found in the ICH Q2 document are not always respected9. In addition, there is no
information about the suitability of the method for its intended use or evaluation of the future results and their reliability coming from the future application of the NIR method in routine.
The second main approach used to validate a NIR multivariate quantitative method is the use of validation criteria found in the ICH Q2 document9. The main limitation of this validation methodology
concerns the evaluation of the linearity which is the relationship between the predicted results coming from the NIRS and the reference results obtained by a reference method (e.g. HPLC). Indeed, the linearity is evaluated by observing the value of the correlation coefficient: the closer to one its value is, the better the results are. However, it has been demonstrated that a value close to one is not sufficient to guarantee the comparability and the exchangeability of the analytical method investigated10.
What about the differential approach, where statistical hypothesis tests are used to assess if the observed effects are statistically significant. This approach is generally used to evaluate if the average difference of the results coming from the reference and the NIRS methods are statistically different in order to evaluate the average accuracy of the method. But it is also used to assess the linearity criterion by demonstrating that the slope is equal to one and the intercept equal to zero. However, there is an important risk with this approach, to accept a method as valid even though it is not. It is important to avoid flawed conclusions. The only conclusion that can be drawn with this approach is the ability to demonstrate a difference and not equivalence. The equivalence approach, which is not as well used, corrects these flaws.
The last approach is the accuracy profile based on tolerance intervals. The tolerance interval used is a ‘β-expectation tolerance interval’ which defines an interval where an expected proportion of NIR results will fall with a defined probability β. An example of an accuracy profile is given in Figure 1 opposite.
In this representation, the plain line represents the relative bias and the dashed lines are the β-expectation tolerance limits which links β-expectation tolerance intervals calculated from each concentration levels tested using their estimated bias and standard deviation of intermediate precision. If β-expectation tolerance limits are comprised within the acceptance limits, which are represented in dotted lines and fixed according to the regulatory requirements (five per cent on pharmaceutical specialties), the method can be considered as valid on the whole concentration range. This fully ICH compliant approach can declare the method as valid and guarantees European Pharmaceutical Review Volume 18 |Issue 1 |2013
the quality, reliability and accuracy of the individual results for the intended use of the NIRS method. Accuracy profiles have been computed from results coming from some NIRS applications validated according to the descriptive approach. It has been shown that some of them which present low RMSEP could not be declared as valid based on their accuracy profiles11. This case demonstrates that small
RMSEP is not sufficient to guarantee the validity of NIRS methods.
Conclusion
The consideration of an analytical method as valid depends on the responsibility of the analyst and of the methodology which he chooses to make this conclusion. This review serves to highlight that it is important to avoid flawed conclusions. Some approaches are not sufficient to consider a NIRS method as valid. The accuracy profile approach which is based on tolerance interval is probably more adapted and is fully ICH compliant.
European Pharmaceutical Review
Volume 18 |Issue 1 |2013 6
NEAR INFRARED IN-DEPTH FOCUS
1. Pharmaceutical Analytical Sciences Group (PASG), NIR sub-Group Guidelines for the Development and Validation of Near-Infrared Spectroscopy Methods in the Pharmaceutical Industry, PASG, 2002
2. Y.-M. Ginot, P. Bernard-Moulin, R. Cinier, F. Despagne, J.-P. Dubost, L. Francès, M. Le Bihan, M. Le Page, A. Michelet, L. Meunier, G. Monteillet, A. Quintana, A. Rieutord, I. Storme, F. Thenevot, E. Ziemons, Quantitative analysis using near infrared spectroscopy, application to tablet content uniformity, I. Methodology, STP Pharma Prat. 20 (2010) 117-135 3. The European Agency for the Evaluation of Medicinal
¨Products, Note for guidance on the use of near-infrared spectroscopy by the pharma ceutical industry and the data requirements for news submissions and variations, EMEA/CVMP/ 961/01, 2003
4. The European Agency for the Evaluation of Medicinal ¨Products, Draft for guideline on the use of near-infrared spectroscopy by the pharma ceutical industry and the data requirements for news submissions and variations, EMEA/CHMP/ CVMP/QWP/17760/2009 Rev 1, 2009
5. A. Bouabidi, E. Rozet, M. Fillet, E. Ziemons, E. Chapuzet, B. Mertens, R. Klinkenberg, A. Ceccato, M. Talbi, B. Streel, A. Bouklouze, B. Boulanger, Ph. Hubert, Critical analysis of several analytical method validation strategies in the framework of the fir for purpose concept, J. Chromatogr. A 1217 (2010) 3180-3192 6. Ph. Hubert, J. J. Nguyen-Huu, B. Boulanger, E.
Chapuzet, P. Chiap, N. Cohen, P. A. Compagnon, W. Dewe, M. Feinberg, M. Lallier, M. Laurentie, N. Mercier, G. Muzard, C. Nivet, L. Valat, Harmonization of strategies for the validation of quantitative analytical
procedures A SFSTP proposal—part I, J. Pharm. Biomed. Anal. 36 (2004) 579-586
7. Ph. Hubert, J. J. Nguyen-Huu, B. Boulanger, E. Chapuzet, P. Chiap, N. Cohen, P. A. Compagnon, W. Dewe, M. Feinberg, M. Lallier, M. Laurentie, N. Mercier, G. Muzard, C. Nivet, L. Valat ; E. Rozet, Harmonization of strategies for the validation of quantitative analytical procedures A SFSTP proposal—part II J. Pharm. Biomed. Anal. 45 (2007) 70-81
8. Ph. Hubert, J. J. Nguyen-Huu, B. Boulanger, E. Chapuzet, N. Cohen, P. A. Compagnon, W. Dewe, M. Feinberg, M. Laurentie, N. Mercier, G. Muzard, L. Valat, E. Rozet, Harmonization of strategies for the validation of quantitative analytical procedures A SFSTP proposal—part III, J. Pharm. Biomed. Anal. 45 (2007) 82-96
9. International Conference on Harmonisation (ICH) of technical Requirements for Registration of Pharmaceuticals for human Use, Tpoic Q2 (R1), Validation of Analytical Procedures: Text and Methodology, Geneva, 2005
10. E. Rozet, A. Ceccato, C. Hubert, E. Ziemons, R. Oprean, S. Rudaz, B; Boulanger, Ph. Hubert, Analysis of recent pharmaceutical regulatory documents on analytical method validation, J. Chromatogr. A 1158 (2007) 111-125
11. C. De Bleye, P.-F. Chavez, J. Mantanus, R. Marini, Ph. Hubert, E. Rozet, E. Ziemons, Critical Review of near-infrared spectroscopic methods validations in pharmaceutical applications, Journal of Pharmaceutical and Biomedical Analysis 69 (2012) 125-132 References Dm itr y K alinov sk y / S hutter stock
Pierre-François Chavez is a PhD Student at
the Laboratory of Analytical Chemistry of Department of Pharmacy of University of Liege. His thesis topic is implementation of vibrational spectroscopy including Near Infrared as Process Analytical Technology tool in pharmaceutical industry. He obtained his Master’s degree in Pharmacy from University of Liege.
Charlotte De Bleye received her degree in
pharmaceutical sciences from the University of Liege in June 2011. She is currently a PhD student in pharmaceutical and biological sciences working on the development of Surface Enhanced Raman Scattering methods to identify and quantify small pharmaceutical and biological molecules in complex matrices.
Dr. Pierre-Yves Sacré received his PhD in
2011 in Pharmaceutical and Biomedical Sciences from the University of Liege for his researches on the detection of counterfeit medicines. He is currently involved in the development of hyperspectral imaging analysis of pharmaceuticals in Professor Hubert’s Analytical Chemistry Laboratory at the University of Liege.
Eric Rozet is Postdoctoral Researcher at
the Analytical Chemistry Laboratory of the University of Liege. He has more than nine years of experience in non-clinical statistics: robust optimisation, validation, transfer, inter-laboratories studies and uncertainty assessment. Eric has a BSc degree in Bio-engineering and a PhD degree in Pharmaceutical Sciences.
Philippe Hubert is Professor of Analytical
Chemistry and head of the Department of Pharmaceutical Sciences at the University of Liege. He has published more than 200 peer reviewed articles. His research focuses on separation techniques for the determination of active ingredients, vibrational spectroscopy in the framework of PAT and analytical methods validation.
Eric Ziemons received his PhD in 2006 in
Pharmaceutical Sciences from the University of Liege. His researches are focused on vibrational spectroscopy (NIR and Raman spectroscopy) applied in the framework Process Analytical Technology (PAT) and on Surface Enhanced Raman Scattering (SERS). He is the author of more than 40 peer reviewed articles.