K.VERSTRAETE,K.DE REU,J.ROBYN,L.HERMAN, M.HEYNDRICKX,J.DEL-FAVERO,D.PIERARD,
G.DAUBE,L.DE ZUTTER. OF
N
EWE
MERGINGP
ATHOGENICESCHERICHIA
C
OLIAgro-food
Promotors L.DE ZUTTER,
GHENT UNIVERSITY,FACULTY OF VETERINARY MEDICINE
K.DE REU,K.VERSTRAETE,J.ROBYN,L.HERMAN,M.HEYNDRICKX,
INSTITUTE FOR AGRICULTURAL AND FISHERIES RESEARCH (ILVO), TECHNOLOGY AND FOOD SCIENCES
J.DEL-FAVERO,
UNIVERSITY OF ANTWERP,APPLIED MOLECULAR GENOMICS GROUP, VIBDEPARTMENT OF MOLECULAR GENETICS
D.PIÉRARD,
UNIVERSITAIR ZIEKENHUIS BRUSSEL,LAB OF MICROBIOLOGY
G.DAUBE
UNIVERSITY OF LIÈGE,FACULTY OF VETERINARY MEDICINE
Authors
K.VERSTRAETE,K.DE REU,J.ROBYN,L.HERMAN, M.HEYNDRICKX,J.DEL-FAVERO,D.PIÉRARD,
G.DAUBE,L.DE ZUTTER.
S
CIENCE FOR A SUSTAINABLE DEVELOPMENT
(SSD)
FINAL REPORT
“
V
ALIDATION OFM
ETHODS FORT
HED
ETECTION OFN
EWE
MERGINGP
ATHOGENICESCHERICHIA COLI
”
“STECTRACK”
SD/AF/06
D/2010/1191/14
Published in 2010 by the Belgian Science Policy Avenue Louise 231 Louizalaan 231 B-1050 Brussels Belgium Tel: +32 (0)2 238 34 11 – Fax: +32 (0)2 230 59 12 http://www.belspo.be
Contact person: Christine Mathieu +32 (0)2 238 34 93
Neither the Belgian Science Policy nor any person acting on behalf of the Belgian Science Policy is responsible for the use which might be made of the following information. The authors are responsible for the content.
No part of this publication may be reproduced, stored in a retrieval system, or transmitted in any form or by any means, electronic, mechanical, photocopying, recording, or otherwise, without indicating the reference :
K. Verstraete, K. De Reu, J. Robyn, L. Herman, M. Heyndrickx, J. Del-Favero, D. Piérard, G. Daube, L. De Zutter. “Validation of methods for the detection of new emerging
pathogenic Escherichia coli – STECTRACK”. Final Report. Brussels : Belgian Science Policy
INDEX OF CONTENT
Index of Tables
... 4
Index of Figures
... 5
1.
Summary
... 7
2.
Introduction
... 13
2.1. Context... 13
2.2. Objectives ... 13
2.3. Expected Outcomes... 14
2.4. Research Team ... 14
3.
Results
... 15
3.1. Task 1: Evaluation Of IMS And Optimization Of STEC Detection In Cattle
Faeces ... 15
3.2. Task 2: Implementation Of Multiplex PCR And Pulsenet Europe PFGE
Protocol... 18
3.2.1. 33-mPCR And PFGE ...18
3.2.2. Derived Multiplex Pcr For Sample Screening ...26
3.3. Task 3 Evaluation Of The Detection And Isolation Method On Human Clinical
Samples ... 32
3.4. Task 4. Validation Of The STEC Isolation Studies... 35
3.4.1. In-House Validation Of STEC Isolation Method ...35
3.4.2. Validation Of STEC Isolation Method Using Interlaboratory Study 47
3.5. Task 5 Validation By Workshops, Meetings And Publications ... 50
4.
Adjustments Made To Original Project Planning
... 51
5.
References
... 55
6.
Publications
... 57
7.
Presentations / Lectures
... 59
8.
General Conclusions
... 61
9.
Recommendations In The Frame Of Policy
... 63
INDEX OF TABLES
Table 1 Isolation efficiencies of STEC O157 (s-) and O26 from (artificially inoculated) cattle faeces samples. ...16
Table 2 Recovery percentage of Dynabeads and Captivate beads IMS for the used
STEC serotypes...17
Table 3 VT-profiles of strains belonging to serotypes O26, O103, O111, O145
and O157. ...22
Table 4 PCR typing results on 334 human and animal STEC strains from the different
partners...27
Table 5 Isolation efficiencies of STEC O26, O103, O111 and O145, inoculate in diffe-
rent levels to 4 to 6 human faecal samples. ...34
Table 6 Isolation efficiencies of STEC O26, O103 and O111, from naturally
contaminated human faecal samples, using several isolation methods. ...34
Table 7 Isolation efficiency of STEC O157 (s-) and (s+), O26, O103, O111 and
O145 in minced beef (A), cheese from raw milk (B) and sprouted seeds (C)...37
Table 8 List of possible mPCR amplification products for the different strains used for inoculation and the respective lengths of these fragments...39
Table 9 Efficiency for detecting STEC O157 (s-) and (s+), O26, O103, O111
and O145 under different conditions in minced beef using mPCR. ...40
Table 10 Comparison of detection with mPCR and the classic isolation method of
STEC O157 (S-) and (S+), O26, O103, O111 and O145 under different
conditions in minced beef.. ...42
Table 11 mPCR efficiency for detecting STEC O157 (s-) and (s+), O26, O103,
O111 and O145 under different conditions in raw milk cheese. (A) Results with all expected fragments amplified by mPCR. (B) Results with 1 to 3 out of 4 expected fragment amplified by mPCR. (C) Results showing
amplification of 1 or more fragments: (C) = (A) + (B)...43
Table 12 Comparison of detection with mPCR and classic isolation method of
STEC O157 (s-) and (s+), O26, O103, O111 and O145 under different
INDEX OF FIGURES
Figure 1. Screenshot of the aligned sequences that are similar to STEC reference
sequences, obtained by BLAST analysis. ...19
Figure 2. Screenshot of the organization of similar STEC sequences in a tree structure...20 Figure 3. PFGE fingerprints of 10 STEC strains and three times the standard strain
Salmonella Braenderup (H9812) obtained after restriction with the enzyme Xba I and the PNE protocol for PFGE. ...21
Figure 4. Tree-structure of STEC strains based on PFGE DNA fingerprints. ...21 Figure 5. Three-dimensional preview of STEC strains based on PFGE DNA fingerprints..21 Figure 6. Two-dimensional view of PFGE clustering for serotype O157, with coloring
according to the VT-profile...23
Figure 7. Three-dimensional view of STEC collection, with indication of katP, Tir
or EspP detection and FliC type. ...24
Figure 8. Three-dimensional view of human clinical STEC strains, with colouring
according to clinical manifestation. Yellow, asymptomatic; purple, bloody
diarrhoea; red, diarrhoea; green, HUS. ...24
Figure 9. Three-dimensional view of human clinical STEC O157 strains. A. Colour
according to clinical manifestation. ...25
Figure 10. PFGE clustering of a persisting clone causing an outbreak in August 2006. ...25 Figure 11. Inhibitory effect of matrix components on 9-mPCR for 4 DNA extraction
methods using a target DNA dilution ...28
Figure 12. Sensitivity of 9-mPCR in detecting virulence marker and serotype genes
of STEC O157 in cattle faeces using two DNA extraction methods ...30
Figure 13. Detection limit of 9-mPCR screening test.. ...31 Figure 14. Representation of 9-mPCR on DNA extracted from raw milk cheese artificially
1. Summary
Enterohaemorrhagic Escherichia coli (EHEC) are shigatoxin producing E. coli (STEC) that can cause serious disease to humans. These food-borne pathogens belong to the fifth most common zoonoses in Belgium, but due to their severe clinical symptoms in humans they are highly dreaded. They can cause a range of disease symptoms ranging from asymptomatically carriage over various diarrhoea symptoms to the life-threatening HUS (haemolytic uremic syndrome). Cattle are the main reservoir and infection of humans occurs through contact with faecal excretion material and consumption of contaminated food or water. A broad variety of serotypes is able to cause human infections, but the principal serotypes are O26, O103, O111, O145 and O157. These strains are denoted as new emerging pathogens by the WHO. The group of sorbitol non-fermenting (s-) O157:H7 strains are examined the most, because an ISO-method is available. For sorbitol fermenting (s+) O157 strains as well as for non-O157 STEC strains recently a new isolation method was developed in the Belspo project SD/AF/06A (Possé et al. 2008a).
The aim of the project was the optimization and the validation of the above-mentioned detection and isolation method for STEC in different matrices. In the first place immunomagnetic separation (IMS) was evaluated for the optimization of the STEC isolation method for cattle faeces (Ghent University, UGent). Second, molecular characterization of STEC strains was performed using a newly designed 33-mPCR as an alternative tool (University of Antwerp, VIB) and pulsed field gel electrophoresis (PFGE) (Institute for Agricultural and Fisheries Research, ILVO). Also a smaller derived multiplex PCR (9-mPCR) was designed (VIB) and optimized for the screening of samples (ILVO). The third goal was the evaluation of different approaches for STEC isolation from human faecal samples (Universitair Ziekenhuis Brussel, UZ). Finally the STEC detection and isolation method was validated by an in-house and an interlaboratory study which was based on the ISO 16140 guideline for the validation of alternative methods (University of Liège; UGent; ILVO).
For the optimization of the STEC isolation protocol for cattle faeces and the evaluation of the effect of IMS, cattle faecal samples were artificially inoculated with various numbers of STEC (10-100 and 100-1000 cfu/25g faeces) and isolated using the isolation protocol with 6h or 24h of enrichment followed by IMS and plating or direct plating on selective agars. Two types of IMS beads (Dynabeads and Captivate beads) were tested. Results showed that IMS (any of the two types of beads) had a highly positive effect on the isolation of serotype O157 (s-
and s+), whereas only a small or even a negative effect for non-O157 serotypes was found. This was largely clarified by results on pure broth suspensions of STEC, showing that high percentages were recovered from the IMS beads used in suspensions with the serotypes O157 (s- and s+), O26 and O103, but lower percentages were recovered for O111 and O145. Non-O157 STEC were often already efficiently isolated from faeces using only direct plating, whereas O157 (s- and s+) STEC were not. For the enrichment time, 24h generally gave higher isolation efficiencies than 6h. Finally for serotypes O157 (s- and s+), O26 and O103, a level of 10-100 cfu/25g was reliably detected, whereas for serotypes O111 and O145 only 100-1000 cfu/25g was reliably detected.
To accomplish the second task of the project, the Applied Molecular Genomics Group of the VIB Department of Molecular Genetics (UA-VIB) designed a proprietary 33-amplicon multiplex PCR (mPCR) assay combined with capillary electrophoresis. This mPCR assay contains the detection of 5 STEC serotypes (O26, O103, O111, O145, O157), the main virulence genes VT1 with variants (VT1ab, VT1c and VT1d), VT2 with six variants (VT2b,c,d,e,f,g) and consensus, eae with five variants (eaeα1, eaeβ1, eaeγ1; eaeγ2; eaeε and eaeζ), ehx, tir, katP, saa, espP and FliC H2, H7, H8, H11 and H28. The assay was optimized and validated on a set of test strains representative for the priority amplicons. Next, this molecular technology was validated on a collection of 334 human clinical and animal strains from the Belgian STEC Reference Center (UZ).
This collection of human and animal strains was also characterized by performing the PulseNet Europe protocol for pulsed field gel electrophoresis (PFGE). This technique creates a fingerprint of a strain by means of rare cutter restriction enzyme cutting of DNA and gel electrophoresis. Analysis of the band patterns lead to clustering of strains according to similarity or relatedness. Then results of 33-mPCR and PFGE genotyping were combined to show eventual correlations between PFGE genotypes and virulence profiles. Also background information about the strains (date of isolation, human or animal source, clinical manifestation, outbreak information) was included to the analysis.
Combining mPCR and PFGE genotyping results, correlations were shown. In the first place STEC strains were clustered according to their serotype. Secondly a correlation occurred between virulence profile and PFGE clustering, concerning VT genes and other genes. Particularly for STEC O157, strains had very diverse VT-profiles, and strains with the same VT-profile clustered together. Concerning the clinical manifestation, ‘asymptomatic’ cases occurred more frequently for non-O157 than for O157 STEC, but besides this no correlation was shown between the PFGE clustering and the clinical manifestation or between the VT-profile and the clinical manifestation. Finally several case studies could be appointed based
on the PFGE dendrograms. In general the cases contained clones that persisted during several years, had similar virulence profiles and infected humans as well as animals.
As a part of the second task, the UA-VIB also designed a derived 9-amplicon multiplex PCR (9-mPCR) for fast sample screening. Using this 9-mPCR, a combination of serotypes (O26, O103, O111, O145, O157) and virulence genes (VT1, VT2, eae and ehx) is detected in one run and can be visualized using conventional gel electrophoresis.
Once the 9-mPCR was developed and tested on pure strains, an evaluation on samples was performed. Hereto ILVO (Institute for Agricultural and Fisheries Research) tested several methods to extract DNA from artificially inoculated samples. Methods were compared based on the ability to remove PCR inhibiting molecules and on the ability to isolate and purify DNA from STEC cells.
Out of four methods only two methods, in which no removal of sample debris was done, were suitable for sample preparation. The method using bead beating cell lysis described by Yu and Morrison (2004), was at least 10 times more sensitive than the method using the Qiagen Stool Mini Kit according to the manufacturer’s instructions, and was therefore recommended. However, the method using bead beating cell lysis is much more time consuming than the Qiagen method and the use of a ribolyser is necessary.
As ILVO used the method employing the ribolyser in all following experiments, this method was used on artificially inoculated samples to determine its detection limit. All virulence marker genes and the serotype gene of strain MB3901 (serotype O157) could be detected in enriched minced beef and cheese from raw milk artificially inoculated with 2 cfu/25g sample. For cattle fecal samples the screening test was 10 times less sensitive; 21 cfu/25g feces could be detected.
Finally the influence of the volume of lysate used in the mPCR reaction mix was examined. An mPCR reaction containing 1 and 2µl of lysate DNA was performed, but no difference in detection was seen.
Testing of different clinical isolates of non-O157 STEC on the newly designed selective agars, showed that growth characteristics were generally as expected. However, more standardization of the preparation of the medium is needed to obtain more reproducible results. Some O103 isolates did not grow on the media prepared at UZ and the color of the colonies of O111 was often difficult to distinguish from O26.
Using artificially contaminated stool samples, the sensitivity of the STEC isolation protocol developed in a previous Belspo SPSD II project was similar to the protocol used routinely at UZ (103 and 104 cfu/5g). The sensitivity was about 10 times higher when using IMS. The method
performed well on frozen STEC positive samples, but this could only be tested on 14 samples, of which 11 with O157, 2 with O111 and one O26.
In-house validation of the STEC isolation protocol was performed to evaluate if the protocol is applicable for different types of food matrices. All samples used for this validation were artificially contaminated. Ten samples of minced beef, raw milk cheese and sprouted seeds were artificially inoculated with varying numbers (10-2000 cfu/25g) of non-stressed and stressed strains belonging to the serotypes O157 (s-) and (s+), O26, O103, O111 and O145. Cultured STEC strains were cold and freeze stressed by storing them for at least 5 days at respectively 2 and -18°C. Inoculated samples were pre-enriched in a weak selective medium for 6 hours followed by enrichment in a stronger selective medium for 18 hours. Direct plating on a selective medium was performed after each enrichment step. In a third pathway, an IMS (Dynabeads or Captivate beads) step was performed after 24h enrichment and prior to plating. Suspected colonies on the selective medium were purified and tentatively confirmed on a purification medium followed by a confirmation by a serotype PCR. Parallel to the classical isolation method, the 9-mPCR screening test was performed on the enrichment medium (after 24 hours enrichment). Results indicate that the isolation protocol as well as mPCR screening provide good detection of non-stressed and cold-stressed O26, O103, O157 (s+) and O145 in raw milk cheese and minced beef.
Detection of the other non-stressed and cold-stressed serotypes (O111 and O157 (s+)) in raw milk cheese and minced beef and of all serotypes under freeze stressed conditions in minced beef was low or almost zero.
Probably due to the high level of background flora, detection of any serotype in sprouted seeds was almost impossible even though inoculation numbers were as high as 2000 cfu/25g.
Finally the optimized STEC detection and isolation methods were validated by an interlaboratory study performed by national and international laboratories (twelve laboratories in total). First, a pre-trial experiment was organized to give the collaborative laboratories the possibility to become familiar with the isolation method. Secondly, the actual interlaboratory study was performed. Products necessary to prepare all culture media (in-house-prepared: IHP) and ready-to-use selective agar culture media (ready-to-use: RTU) were sent to the participating laboratories, as well as a questionnaire and a document to report the results. For each participating laboratory, 20 samples of 25g of minced beef were prepared: one sample for the temperature measurement upon arrival, one for the enumeration of the total count, Enterobacteriaceae and E. coli, two blank samples and sixteen samples inoculated
with single strains belonging to 4 serotypes at 2 levels of contamination in duplicate (30 cfu/g and 300 cfu/g). All strains were cold stressed. Samples were prepared the day of the shipment and had to be analyzed on a prefixed day. The University of Liège evaluated all results based on the recommendations of ISO 16140. Results showed no difference between RTU and IHP media. The arabinose test seemed difficult to be read, so the dulcitol test is now preferred for the confirmation of serotypes O103 and O111. Some mistakes were made during sample inoculation, like a wrong inoculation of four samples and no inoculation of one sample. If we do not take into account these mistakes, all four serotypes were detected with high sensitivity. In general it can be concluded that the laboratory performance is highly satisfactory.
2. Introduction
2.1. Context
Food borne shigatoxin-producing E. coli or STEC infection is a serious problem in human healthcare: these extremely severe pathogens can cause a range of disease symptoms ranging from asymptomatically carriage over various diarrhea symptoms to HUS (hemolytic uremic syndrome). Diagnosis of STEC is mostly directed to the serotype O157 because of the availability of a standard detection method exploiting the lack of sorbitol fermentation in the majority of the O157 strains. Due to the absence of routine detection methods for other serotypes, so-called non-O157 STEC, detailed epidemiological data on non-O157 infections are limited. However, recent data obtained in Belgium confirm WHO recommendations, identifying serotypes O26, O103, O111, O145 and sorbitol positive O157 as emerging pathogens, responsible for 80% of the hospitalized STEC infections and 23% of the HUS cases.
2.2. Objectives
Optimization and validation of STEC detection, isolation and identification methods:
A detection and isolation method for non-O157 STEC and sorbitol positive O157 STEC developed during the previous SPSD II project (Possé et al., 2008a) will be finally optimized resulting in a reliable, fast and robust method for different matrices including cattle feces for which IMS will be evaluated to increase the detection sensitivity.
Implementation of several molecular methods for fast sample screening and for strain characterization or confirmation. These will include a 33-amplicon multiplex PCR (33-mPCR) for a one-step virulence characterization and serotype identification of strains, a smaller multiplex PCR containing 9 amplicons (9-mPCR) for sample screening and confirmation of colonies and the PulseNet Pulsed Field Gel Electrophoresis (PFGE) protocol for strain typing.
Evaluation of several approaches for STEC detection and isolation from human fecal samples based on the previously developed protocols for screening samples, to assess feasibility for routine use in clinical laboratories.
Optimized STEC detection and isolation methods will be validated in-house on different food matrices, at different contamination levels and subsequently by an interlaboratory study for a selected matrix in both national and international laboratories, based on ISO guidelines.
2.3. Expected outcomes
Optimized detection and isolation method for STEC (including non-O157 strains) in cattle faeces.
Validated method for detection and isolation of STEC non-O157 and O157 (s+) strains in different food categories: meat, produce and dairy products
Molecular methods for STEC strain characterization (identification to serotype level as well as virulence and genetic typing) as alternative to conventional characterization: 33-mPCR assay for strain characterization.
Direct, quick and easy detection method for STEC in human faeces.
2.4. Research team
During the project frequent contacts between different partners occurred in order to organize the laboratory work of the partners involved in the relevant tasks. As foreseen in the technical specification of the project, all partners involved in the different tasks were working synergetic so that the same work was not done in duplicate.
For task 2 a good collaboration was developed between partner 2, 3 and 4 to develop the 33- and 9-mPCR: which genes to include, delivery of a collection of human isolates by partner 4 to partner 2 and of DNA from the strains by partner 2 to partner 3. Partner 3 implemented the 33-mPCR and confirmed the presence of nine genes detected by partner 2 by other primers (confirmation tests). The scientist of partner 2 followed the practical work done in the laboratory of the coordinator and evaluated the obtained results with the promoters of both partners (C and P2). Also decisions about the type and number of samples to be examined in Task 4.1 (in house validation) were made in consensus between the coordinator and partner 2. Partner 2 delivered all technical information to partner 4 so that the latter was able to start with this task 3. Since partner 4 had at the start problems with the performance of the isolation protocol using the selective medium, partner 4 followed a short technical training in the laboratory of the coordinator.
For the preparation of the organization of the international ring-trial a first meeting was organized between the coordinator, partner 2 and partner 5. Then a technical workshop was organized for the participating laboratories before sending out the samples. Also other details (conditions for sending out the samples, time schedule,…) of the trial were discussed. The ring-trial was organized by the coordinator in cooperation with partner 5. Samples were prepared by technical staff of the coordinator and partner 5, whereas partner 5 was responsible for the sending of the samples, analysis of the laboratory results and the reporting of the ring-trial.
3. Results
3.1. Task 1: Evaluation of IMS and optimization of STEC
detection in cattle faeces
- Partners:
o Ghent University
- Objective:
The purpose of this study was to evaluate the technique of immunomagnetic separation (IMS) and to optimize a method for isolation of non-O157 shiga toxin-producing Escherichia coli (STEC) serotypes O26, O103, O111, O145 and sorbitol positive (s+) O157 from cattle faeces using artificially contaminated faecal samples.
- Materials and Methods:
o STEC isolation from cattle faeces
Cattle faecal samples were artificially inoculated with varying numbers (10-100 cfu/25g and 100-1000 cfu/25g) of clinical STEC strains and consequently recovered using a selective enrichment step of 6 or 24h, followed by plating on selective agars (Possé et al., 2008a) preceded by IMS or not. Two types of IMS beads, Dynabeads (Dynal, Oslo, Norway) and Captivate beads (Lab M, Bury, UK), were implemented, each on one set of four faecal samples. Isolated strains were confirmed using serotype-specific PCR (O26: DebRoy et al., 2004; O145: Feng et al., 2005; O103: Fratamico et al., 2005; O111 and O157: Paton and Paton, 1998).
o Evaluation of IMS beads on pure suspensions
Evaluation of Dynabeads and Captivate beads was performed on pure suspensions of STEC. Overnight broth cultures of each serotype, were serially diluted in phosphate buffered saline (PBS) to 10-50, 50-250, 250-500 and >500 cells/ml and concentrations were determined by counting on Tryptone Soy Agar (TSA). In a first experiment detection limits and recovery percentages were determined for both types of beads by performing IMS on every dilution and plating the resulting solution on TSA+YE plate (TSA supplemented with 0.6% yeast extract (YE); LP0021; Oxoid). This was repeated up to seven times per dilution. In a second experiment loss-making factors in the IMS (Dynabeads) procedure were determined. IMS was performed on two dilutions of every strain (50-250 and 750-1250 CFU/ml) in duplicate and all waste and end solutions were streaked on TSA+YE. The waste solutions originated from the aspiration of
the sample matrix and the washing of the bead-bacteria complexes when immobilized by the magnet.
- Results
o STEC isolation from cattle faeces
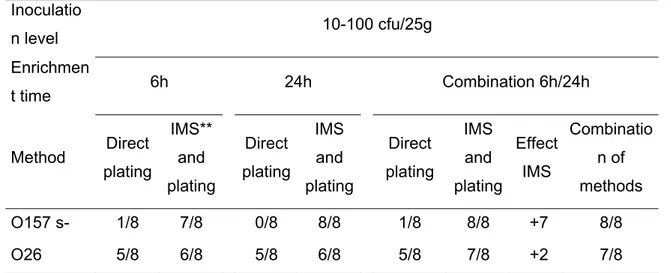
Results using direct plating showed that serotype O145 was isolated more efficiently after 6h of enrichment, whereas for serotypes O103 and O111 24h of enrichment was more efficiently (results not shown). Isolation efficiencies of serotypes O26, O157 (s+) and O157 (s-) were similar for both enrichment times (Table 1). Isolation efficiencies were higher for non-O157 serotypes than serotype O157 and higher if samples were inoculated in a higher level.
Secondly, results showed that IMS was most beneficial for the isolation of the serotype O157 (s- and s+) with an increase of 4 up to 7 positive samples. For non-O157 serotypes, IMS was less useful, because direct plating generally already gave high isolation efficiencies and the effect of IMS often was variable (Results for O157 (s-), O26 in Table 1; Results for O157 (s+), O103, O111, O145 not shown).
Concerning the detection limits, the level of 10-100 cfu/25g was reliably isolated using direct plating for the serotype O103 and by using IMS and plating also for O157 (s- and s+) and O26 (Table 1). For serotypes O145 and O111 the level of 100-1000 cfu/25g was reliably isolated using direct plating only.
Table 1. Isolation efficiencies of STEC O157 (s-) and O26 from (artificially inoculated) cattle faeces samples. Inoculatio n level 10-100 cfu/25g Enrichmen t time 6h 24h Combination 6h/24h Method Direct plating IMS** and plating Direct plating IMS and plating Direct plating IMS and plating Effect IMS Combinatio n of methods O157 s- 1/8 7/8 0/8 8/8 1/8 8/8 +7 8/8 O26 5/8 6/8 5/8 6/8 5/8 7/8 +2 7/8
*x=number of positive experiments / y= total performed experiments ** use of Dynabeads or Captivate beads
o Evaluation of IMS beads on pure suspensions
Recovery efficiency was variable from serotype to serotype. STEC was efficiently recovered from the pure suspension using both types of IMS beads, except for some serotypes in dilution 10-50 cells/ml (O103, O111 Captivate beads) and 50-250 cells/ml (O111, O145 Dynabeads) for which some negative results were obtained (results not shown).
Recovery percentages of serotypes O157 (s- and s+), O26 and O103 were relatively high for both types of beads, with higher percentages using Dynabeads than using Captivate beads (Table 2). For serotypes O145 and O111 recovery percentages were moderate only when using Captivate beads, but very low when using Dynabeads.
Table 2. Recovery percentage of Dynabeads and Captivate beads IMS for the used STEC serotypes. Used beads Dynabead s Captivate beads O157 s- 145% 62% O157 s+ 57% 35% O26 70% 62% O103 84% 19% O111 3% 32% O145 6% 26%
Results on loss-making factors in the IMS procedure using Dynabeads showed that for the well recovered serotypes O157 (s- and s+), O26 and O103 no loss-making factors could be determined in the procedure, whereas for the weakly recovered serotypes O111 and O145, it was found that respectively the aspiration of the sample matrix and the washing of the bacteria-beads complexes are responsible for a great loss of cells.
- Conclusions
In conclusion, the positive effect of IMS on the isolation efficiency of STEC O157 (s- and s+) in faeces, was not always observed for non-O157 STEC. This could largely be clarified by results on pure broth suspensions of STEC, showing that the bead affinities were high for O157 (s- and s+), O26 and O103, but weaker for O111 and O145. Also non-O157 STEC were often already efficiently isolated from faeces using direct plating whereas O157 (s- and s+) STEC were not. Finally, concerning the enrichment time, 24h gave the highest or similar isolation efficiencies compared to 6h for most of the serotypes.
3.2. Task 2: Implementation of multiplex PCR and
Pulsenet Europe PFGE protocol
3.2.1. 33-mPCR and PFGE
- Partners:
o University of Antwerp: Development of the 33-mPCR and characterization of strains
o ILVO: Implementation of PulseNet Europe (PNE) PFGE protocol on strains and characterization of the collection of strains
- Objective:
The purpose of this study is to develop a 33-mPCR as a molecular tool for strain characterization. Secondly, this mPCR and the PNE PFGE protocol were implemented to characterize a collection of ca. 300 human clinical and animal STEC strains.
- Results
o Development of the 33-mPCR assay
The Applied Molecular Genomics (AMG) group of the VIB Department of Molecular Genetics (UA-VIB) designed a proprietary 33-mPCR (mPCR) assay. This 33 amplicon mPCR assay contains 5 STEC serotypes (O111, O157, O103, O26 and O145) and the main virulence genes VT1 with three variants (VT1ab, VT1c and VT1d), VT2 with six variants (VT2 b,c,d,e,f,g) and consensus, eae with five variants (eae α1, eaeβ1, eaeγ1; eaeγ2; eaeε and eaeζ), ehx, tir, katP, saa, espP, FliC H2, H7, H8, H11 and H28 (Nielsen et al., 2003; Blanco et al., 2004; Persson et al., 2007).
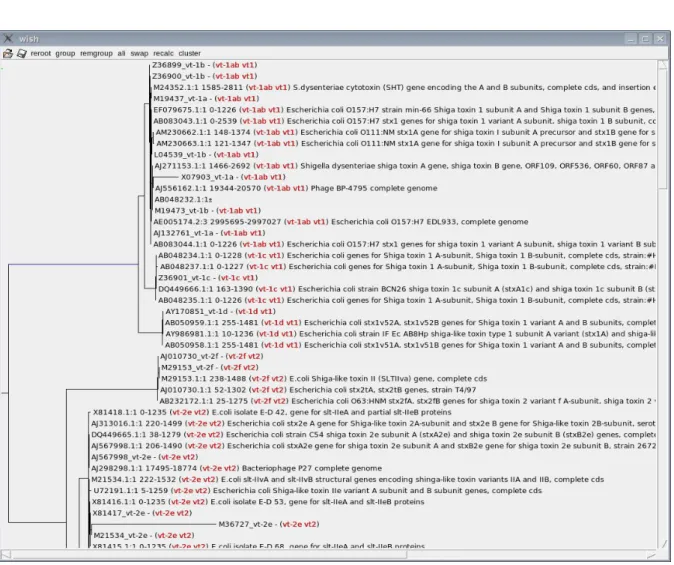
To accomplish this task successfully the VIB collected all publicly available sequences using BLAST analysis with the 33 reference sequences described above as query sequences (Figure 1). Data clean-up and manual curating resulted in a total of 856 similar sequences for further analysis. Next these sequences were properly aligned (Muscle) and organized in a tree (clearcut) structure (Figure 2). The obtained trees were manually verified and groups assigned. These groups, reflecting the 33 reference sequences, served as starting point for multiplex primer design. Hereto, a consensus sequence is generated from each of the 33 alignments taking into account ambiguity bases which can’t be included in the subsequent primers. Furthermore, to reduce the possibility of false positive amplifications the VIB designed an
algorithm that allows verification of the generated primers for a specific group for the absence of annealing possibilities on sequences for all the other groups. The resulting list of group specific sequences is subsequently fed into our MultiPCR algorithm for the multiplex PCR assay.
The assay(s) were optimized and validated on a set of test strains representative for the priority amplicons. Next, this molecular technology was validated on a collection of 334 human and animal strains from the Belgian STEC Reference Center (UZ).
Figure 1 . Screenshot of the aligned sequences that are similar to STEC reference sequences, obtained by BLAST analysis.
Figure 2. Screenshot of the organization of similar STEC sequences in a tree structure.
o Characterization of a STEC collection
Using the 33-mPCR, 321 strains of the STEC collection (334 strains) were characterized. 62% of the typed strains were of serotype O157, 10% of O26, 5% of O103, 3% of O111 and 3% of O145. Similar percentages were shown for the FliC types; 63% H7, 10% H11, 6% O103, 3% H8 and 3% H28. Concerning the main virulence genes, 39% of the strains carried VT1; of which 89% subtype vtx1a or b, 9% vtx1c and 1% vtx1d. 71% of the strains carried any variant of VT2, of which 53% carried subtype vtx2, 39% carried vtx2c or d, 6% vtx2b, only one strain subtype vtx2e in a combination with vtx2g or h. 88% of the strains carried eae, of which 65% subtype γ1, 11% β1, 5% ε, 4% γ2 and 4% ζ and 92% of the strains carried ehx. Other virulence genes like EspP was carried by 78% of the strains, KatP by 76%, Tir by 11% and Saa by 3% of the strains.
In a second place PNE protocol for PFGE was performed on the STEC collection, leading to fingerprints of all strains (Figure 3).The PNE protocol with the restriction enzyme XbaI was used (http://www.pulsenet-europe.org)
Figure 3 PFGE fingerprints of 10 STEC strains and three times the standard strain Salmonella Braenderup (H9812) obtained after restriction with the enzyme Xba I and the PNE protocol for PFGE.
Using Bionumerics, PFGE patterns were analyzed and clustered based on similarity. Then results of mPCR and PFGE genotyping were combined to screen for eventual correlations between relatedness and virulence profiles. Also background information about the strains (date of isolation, human or animal source, clinical manifestation, outbreak information) was included to the analysis.
PFGE clustering of serotypes
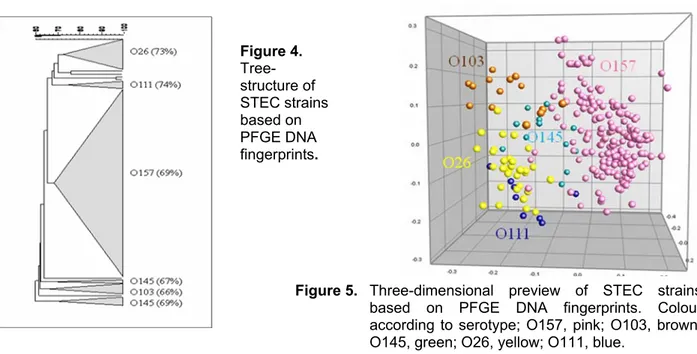
In the first place STEC strains were clustered according to their serotype. This was shown in the tree-structure (Figure 4) and in the three-dimensional preview of the collection (Figure 5) in which strains of the same serotype are grouped together.
Figure 4. Tree-structure of STEC strains based on PFGE DNA fingerprints.
Figure 5. Three-dimensional preview of STEC strains based on PFGE DNA fingerprints. Colour according to serotype; O157, pink; O103, brown;
Correlation between virulence profile and PFGE clustering VT-profile
Concerning the VT-profile, most strains belonging to the serotype O26, O103 and O111 carried only VT1. For O145 the main VT-profile was vtx2 (Table 3). For O157 the VT-profile was diverse with two prominent profiles vtx2 and vtx2c or d and three profiles combining these genes with VT1.
For serotype O157, results showed that the VT-profile is correlated to the PFGE clustering or strains carrying the same VT genes were more related. This is illustrated in a two-dimensional view (Figure 6) of the strains positioned according to their relatedness and coloured according to VT-profile.
Table 3 VT-profiles of strains belonging to serotypes O26, O103, O111, O145 and O157. Serotype VT-profile Percentage
O26 VT1 86% (25/29) vtx2 7% (2/29) vtx2 + vtx2c or d 3% (1/29) O103 VT1 85% (11/13) VT1 + vtx2c or d 15% (2/13) O111 VT1 63% (5/8 ) VT1 + vtx2 37% (3/8) O145 vtx2 58% (7/12) VT1 33% (4/12) vtx2 + vtx2c or d 8% (1/12) O157 vtx2c or d 35% (63/178) vtx2 32% (56/178) vtx2c or d + vtx2 17% (30/178) VT1 + vtx2c or d 9% (16/178) VT1 + vtx2 6% (10/178) VT1 + vtx2 + vtx2c or d 1% (2/178)
Figure 6 . Two-dimensional view of PFGE clustering for serotype O157, with coloring according to the VT-profile; vtx2c or d, yellow; vtx2, blue; vtx2c or d + vtx2, pink; VT1 + vtx2c or d, red; VT1 + vtx2, green; VT1 + vtx2c or d + vtx2, purple.
For non-O157 serotypes no analysis concerning a correlation between VT-profile and PFGE clustering was performed, because mainly only one VT-profile overruled and the amount of strains was low.
Other genes
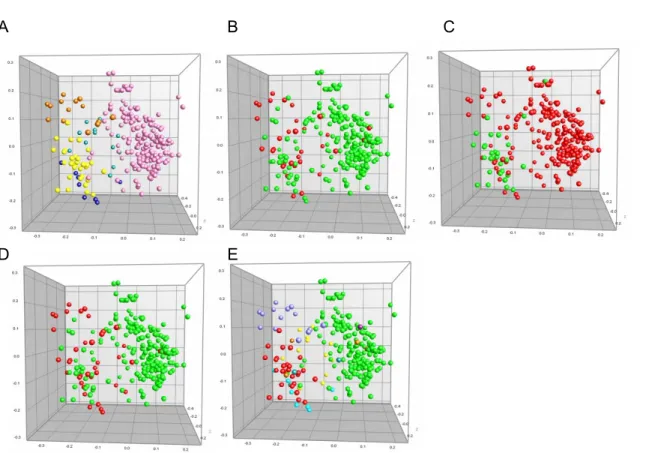
Also the presence of other genes, like katP, Tir and EspP was correlated to the PFGE clustering (Figure 7). The gene saa was carried by only ten strains of the collection.
A B C
D E
Figure 7. Three-dimensional view of STEC collection, with indication of katP, Tir or EspP detection and FliC type. (A. Colour according to serotype; O157= pink; O103= brown; O145= green; O26= yellow; O111= blue. B. katP detection; present= red; absent= green. C. Tir detection; present= red; absent= green. D. EspP detection; present= red; absent= green. E. FliC types; H7= green, H11= red; H2= purple; H28= yellow; H8= blue; H4= lilac)
Correlation between virulence profile, PFGE clustering and clinical manifestation
The clinical manifestation ‘asymptomatic’ occurs more frequently for non-O157 than for O157 STEC (Figure 8).
Figure 8 . Three-dimensional view of human clinical STEC strains, with colouring according to clinical manifestation. Yellow, asymptomatic; purple, bloody diarrhoea; red, diarrhoea; green, HUS.
10 0 99 98 MB4269 MB3921 MB3919 MB3920 MB4000 MB4022 MB4096 MB4105 MB4221 MB4238 MB4271 MB3916 MB3917 MB4087 human human human human animal human human human human human human animal animal human BD BD BD HUS / HUS unknown BD unknown HUS HUS / / HUS 30/07/2007 08/08/2006 04/08/2006 04/08/2006 09/09/2005 10/11/2005 17/09/2004 16/11/2004 25/04/2003 20/08/2003 17/08/2007 04/08/2006 04/08/2006 26/08/2004 . . . . . . . . . . . a a a a a a a a a a a a a a G1 G1 G1 G1 G1 G1 G1 G1 G1 G1 G1 G1 G1 G1 1 1 1 1 1 1 1 1 1 1 1 1 1 1 1
No correlation was shown between the VT-profile and the clinical manifestation, and between the PFGE clustering and the clinical manifestation (Figure 9).
A B
Figure 9 Three-dimensional view of human clinical STEC O157 strains. A. Colour according to clinical manifestation; yellow, asymptomatic; purple, bloody diarrhoea; red, diarrhoea; green, HUS. B. Colour according to VT-profile; vtx2c or d, yellow; vtx2, blue; vtx2c or d + vtx2, pink; VT1 + vtx2c or d, red; VT1 + vtx2, green; VT1 + vtx2c or d + vtx2, purple.
Case studies
Results showed an outbreak that occurred in August 2006, which infected three people of which one developed HUS. At the same time the same clone was isolated from cattle as well. These 5 strains were part of a bigger cluster of 14 strains with nearly identical PFGE patterns (97% similarity) and similar virulence profile. During several years this clone was isolated from animals and humans, causing a variety of clinical manifestations.
- Conclusions
A 33-mPCR was developed by the VIB-UA and implemented on a collection of human clinical and animal STEC strains. As a result virulence profiles were created for all strains in the collection. Also the PulseNet Europe protocol for PFGE was performed, creating fingerprints that leaded to clustering of the strains according to similarity or relatedness.
Combining mPCR and PFGE genotyping results, correlations between relatedness and virulence profiles were shown. Also background information about the strains (date of isolation, human or animal source, clinical manifestation, outbreak information) was included in the analysis. In the first place STEC strains were clustered according to their serotype. Secondly a correlation occurred between virulence profile and PFGE clustering, concerning VT genes and other genes. Particularly for STEC O157, strains had very diverse VT-profiles, and strains of the same VT-profile clustered together. Concerning the clinical manifestation, ‘asymptomatic’ cases occurred more frequently for non-O157 than for O157 STEC, but beside this no correlation was shown between the PFGE clustering and the clinical manifestation or between the VT-profile and the clinical manifestation. Finally several case studies could be appointed based on the PFGE dendrograms, that in general contained clones that persisted during several years, had similar virulence profiles and infected as well humans as animals.
3.2.2. Derived multiplex PCR for sample screening
- Partners:
o University of Antwerp: 9-mPCR design o ILVO: optimization screening method
- Objective:
The VIB has designed a 9-mPCR for fast sample screening. Using this mPCR, a combination of serotypes (O26, O103, O111, O145, O157) and virulence genes (VT1, VT2, eae and ehx) is detected in one run and can be visualized using conventional gel electrophoresis. In the first year of the project, the mPCR mix and protocol for sample screening were developed.
- Materials and Methods:
The VIB tested the 9-mPCR on the collection of 334 human and animal STEC strains from the Belgian STEC Reference Center (UZ). Results were compared to typing results obtained by
ILVO and UZ on the same strains by means of individual PCR’s; the comparison is listed in
Table 4.
Table 4 PCR typing results on 334 human and animal STEC strains from the different partners (Percentages represent the amount of STEC strains found positive for the target gene). Partner VT1 VT2 eae ehx O157 O26 O103 O111 O145
VIB 39% 70% 88% 91% 62% 9% 5% 3% 3%
ILVO 39% 71% 87% 91% 63% 10% 7% 4% 6%
UZ 39% 71% 88% 91% 62% 10% 5% 3% 3%
Typing results of the collection of human and animal STEC strains were very similar for the three partners (Table 6).
Once the 9-mPCR was developed and tested on pure strains, an evaluation on artificially contaminated samples was performed. Therefore ILVO tested several methods to extract DNA from these samples, as an efficient DNA extraction is indispensable for sensitive mPCR detection. Methods were compared based on the ability to remove PCR inhibiting molecules and on the ability to isolate and purify DNA from STEC cells.
In a first stage the inhibitory effect of matrix components was tested for different extraction methods. Samples of cattle feces, minced beef and cheese from raw milk were enriched during 24h followed by DNA extraction of the background flora. Then a series of dilutions of STEC target DNA was added to the lysate prior to the implementation of 9-mPCR. Four DNA extraction protocols were tested. Each protocol started with removing sample debris by centrifugation or filtration. In protocol 1A, 1B and 3: one mL of enrichment broth culture was centrifuged at 3000g for 1 minute, then the supernatant was transferred to a new tube and centrifuged at 13000g for 5 minutes to pellet the bacteria (Osek et al., 2002). In protocol 1A the pellet was resuspended in 100µl lysis solution (0.05 M NaOH, 0.125% SDS) and heated at 90°C for 17 minutes, followed by vortexing and centrifugation at 13.000g for 1 minute. In protocol 1B the pellet was washed two times with PBS (phosphate buffered saline) prior to heat lysis. In protocol 3 the pellet was resuspended in lysis buffer and DNA extraction was performed according to the method described by Yu and Morrison (2004) using bead beating and purification by QiaAMP columns (Qiagen, Düsseldorf, Germany). In protocol 2: five mL of enrichment broth culture was filtered through a Whatman No. 4 filter (Whatman, Kent, UK) and filtrate was centrifuged for 5 minutes at 13000 g to pellet the bacteria (Rijpens et al., 1998). The pellet was dissolved in 100µl lysis solution (0.05 M NaOH, 0.125% SDS) and heated at 90°C for 17 minutes, followed by vortexing and centrifugation at 13.000g for 1 minute.
PCR was performed in a final volume of 25 µl, containing 10µL reaction mix (VIB, Antwerp, Belgium), 0.125 µl Titanium Taq polymerase, 15 µl double-distilled water (ddH2O), 1 µl lysate and target DNA with a concentration of 300, 30, 3, 0.3 or 0.03 ng per 25µl reaction mix (strain MB3901 with serotype O157).
The PCR program consists of a denaturation step at 98°C for 3 minutes followed by 30 cycles which each consist of a denaturation step at 95°C for 45 seconds, a primer annealing step for 45 seconds at 58°C and an elongation at 72°C for 2 minutes. After 30 cycles an additional elongation at 72°C for 10 minutes is performed.
Electrophoresis was performed on a 2.5% agarose gel using SeaKem LE agarose (Lonza, USA)
- Results:
The inhibitory effect of the three matrices was compared for the four DNA extraction methods (Figure 11).
I. Minced beef II. Cheese III. Cattle feces
1A 1B 2 3 M 1A 1B 2 3 M 1A 1B 2 3 M
Figure 11 Inhibitory effect of matrix components on 9-mPCR for 4 DNA extraction methods using a target DNA dilution and 3 matrices (I, II & III) . Methods: 1A: heat lysis of bacteria in pellet; 1B: heat lysis of bacteria in pellet after washing; 2: heat lysis of filtrate; 3: bead beating lysis and purification by QiaAMP column of the precipitated DNA. Target DNA (strain MB3901) added to the PCR reaction: 0.3 ng/25µl reaction mix. Amplicon length target genes: O157, 101bp; eae, 264bp; VT1, 352bp; VT2, 399bp; ehx, 442bp. M: pUC mix 8/ 1 kb DNA Molecular Weight Marker (Invitrogen, USA).
The 10-3 dilution of the target DNA solution (resulting in 0.3 ng per 25µl reaction mix) added to
the mPCR reaction mix could be detected in all three sample matrices (Figure 11). For minced beef all extraction methods successfully removed inhibitory components. For cheese, methods 1B (heat lysis after washing of bacteria in pellet) and 3 (bead beating lysis and purification by QiaAMP column) were successful. For cattle feces only method 3 succeeded in removing inhibitory components. 1018 bp 517 bp 396 bp 398 bp 220 bp 154 bp 501 bp 404 bp 331 bp 242 bp 398 bp 111 bp
In the next experiment the efficiency of cell lysis and DNA isolation of methods 1B and 3 was tested. Samples of minced beef, cheese and feces were enriched and subsequently artificially inoculated with high concentrations of STEC O157 (strain MB3901). Results were disappointing because 6*104 STEC bacteria /ml could not be detected in any matrix using any method. The
stage of the protocol in which most cells were lost, was identified by plate counting the amount of STEC bacteria present in every stage of the protocol. Results indicated that 95% of the STEC cells were washed away in the early step removing sample debris.
Therefore, in a next experiment, the Qiagen Stool kit (method 4) and the bead beating extraction method with subsequent DNA purification by QiaAmp column (method 3bis) were implemented directly on the enrichment broth culture without the removal of sample debris. Samples of minced beef, cattle feces and cheese from raw milk were enriched and subsequently artificially inoculated with a series of dilutions of STEC O157 (strain MB3901). Using method 3, 4*103 cfu/ml could be detected in minced beef and 4*104 cfu/ml in cheese and
cattle feces (Figure 12A). In Figure 12B the detection sensitivity of STEC in feces could be compared using the QiaAMP Stool kit (method 4) and using the bead beating extraction method with subsequent DNA purification by QiaAmp column (method 3bis) on the same fecal sample. An exact detection limit for both methods could not be determined, because the inoculated fecal sample was already naturally contaminated with STEC. But the results in Figure 12 did show that the bead beating method with subsequent QiaAMP DNA purification (method 3bis) is at least 10 times more sensitive than the QiaAMP stool protocol (method 4). More concrete, using method 4, 1,8*105 cfu/ml could only just be detected , whereas using method 3, 1,8*104 cfu/ml
A. Method 3. B. Method 3 versus Method 4
²
1 2 3 4 5 6 7 8 9 10 11 12 13 14 15 16 17 18
Figure 12 Sensitivity of 9-mPCR in detecting virulence marker and serotype genes of STEC O157 in cattle faeces using two DNA extraction methods (3bis and 4, see text). Matrices: lanes 1-3: cheese from raw milk; lanes 4-6: minced beef; lanes 7-9, 12-16: cattle feces. A. Enriched sample inoculated with STEC O157 (strain MB3901) in a series of dilutions and DNA extracted using method 3. Target STEC cell concentration: 4*102 (lanes 1, 4, 7); 4*103 (lanes 2, 5, 8); 4*104 cfu/ml (lanes 3, 6, 9). B. Enriched sample inoculated with STEC O157 (strain MB3901) and DNA extracted using methods 3 (lane 13, 14, 16) and 4 (12-15). Target STEC cell concentration: 1,8*104 cfu/ml (lane 13); 1,8*105 (lanes 12,14). Blanks: lane 15, 16. Positive controle: lane 10, 17: 0,5 ng/µl target DNA of STEC O157 (strain MB3901). 1 kb DNA Molecular Weight Marker: lanes 11, 18. Amplicon length target genes: O157, 101bp; eae, 264bp; VT1, 352bp; VT2, 399bp; ehx, 442bp.
In a following experiment the detection limit of the 9-mPCR sample screening test using method 3bis on samples inoculated with STEC O157 (MB3901) was determined. All virulence marker genes and the serotype gene of strain MB3901 could be detected in enriched minced beef and cheese from raw milk artificially inoculated with 2 cfu/25g sample (Figure 13). For cattle fecal samples the screening test was 10 times less sensitive; 21 cfu/25g feces could be detected (Figure 13). 1018 bp 517 bp 396 bp 344 bp 398 bp 220 bp 154 bp
1 2 3 4 5 6 7 8 9 10 11 12
Figure 13 . Detection limit of 9-mPCR screening test. Matrix: Cheese from raw milk (lanes 1-3); Minced beef (lanes 4-6); Cattle feces (lanes 7-9); No matrix (lanes 10,11). Samples inoculated with STEC O157 (strain MB3901) prior to enrichment in two concentrations: 2 cfu/ml (lanes 1,4, 7, and 10) and 21 cfu/ml (lanes 2, 5, 8 and 11). Blanks: lanes 3, 6, 9. Amplicon length target genes: O157, 101bp; eae, 264bp; VT1, 352bp; VT2, 399bp; ehx, 442bp. 1 kb DNA Molecular Weight Marker: lane 12.
Finally the influence of the volume of lysate used on the 9-mPCR reaction was examined. An mPCR reaction containing 1µl and 2µl of lysate DNA was performed, but no difference in detection was seen.
- Conclusions:
Method 3 and 4, without the removal of sample debris, were the only two methods suitable for sample preparation. Method 3, using bead beating cell lysis, is at least 10 times more sensitive than method 4 and therefore recommended. However, method 3 is much more time consuming than method 4 and secondly, if a laboratory does not have a ribolyser (which is needed for the bead beating lysis), the use of method 4 (Qiagen Stool kit) is advised. The detection limit for method 3 was ascertained as being 2 cfu/25g or less in raw milk cheese and minced beef but 21 cfu/25g in cattle feces.
For the mPCR screening test the ILVO used the DNA extraction method using bead beating and QiaAMP column purification (method 3) for task 4.1 and the UZ used the Qiagen Stool kit protocol (method 4)(task 3).
1018 bp 517 bp 396 bp 344 bp 398 bp 220 bp 154 bp
3.3. Task 3 Evaluation of the detection and isolation
method on human clinical samples
- Partners:
o Universitair Ziekenhuis Brussel
- Objective:
To evaluate the optimized detection and isolation method for STEC developed in this project on human samples.
- Methods and Materials:
1. Preliminary tests: The differentiation- and confirmation media developed in the previous SPSDII project for non-O157 were tested on a collection of STEC clinical isolates that were different from those used for the initial development of these media. For this purpose, pure cultures of the isolates were cultivated on media prepared following the instructions for preparation.
2. Direct extraction of DNA from stools followed by PCR detection of STEC: the Qiagen stools kit was used for this purpose, as no ribolyser was available in the lab. The extracted DNA was then tested using the 9-mPCR developed in this project.
3. Detection of STEC in artificially contaminated stool samples:
Routine stool samples submitted to the laboratory and tested negative for STEC were contaminated with dilutions of suspensions of known STEC isolates obtained from fresh cultures on agar. Counting of the number of colony forming units was performed by subculturing dilutions of the original suspension and counting the colonies.
The artificially contaminated stool samples were tested as follows:
• Direct plating on sorbitol-MacConkey agar (SMAC) followed by a multiple PCR targeting VT1, VT2 and VT2f variant (routine protocol at UZ) performed first on mixture of colonies, then on individual colonies.
• Direct plating on the selective medium for non-O157 (B1), followed by the 9-mPCR protocol developed in this project performed first on mixture of colonies, then on individual colonies.
• IMS with Captivate beads for the different serogroups expected in these samples followed by plating on B1, followed by the 9-mPCR protocol
developed in this project performed first on mixture of colonies, then on individual colonies.
• Finally, the mTSB enrichment broth used for IMS was also used directly after extraction by Qiagen DNA extraction kit.
4. Detection of STEC in naturally contaminated stool samples:
Only a limited number of naturally contaminated samples were available, most of them being positive for O157 (s-). They were tested using the same techniques as the artificially contaminated samples.
- Results:
1. Preliminary tests: the preparation of the differentiation media was difficult. A number of unsuccessful attempts had to be made before obtaining interpretable results. However, it should be underlined that we did not obtain even clear-cut colorations of colonies as those presented with media obtained from the coordinator or even with those prepared with products provided by the coordinator. In general, the growth characteristics of isolates from the 4 non-O157 serogroups on differentiation medium for non-O157 were as expected, but we made the following observations:
a. O26: Of the 9 tested isolates, only 8 grew as the expected purple colonies; the last one grew as a light purple colony. This isolate was atypical since it did not ferment sorbitol.
b. O103: Of the 8 tested isolates, 3 did not grow on the selective medium for non-O157, one grew only as very small colonies. The 4 other isolates grew as blue colonies, as expected.
c. O111: only 1 of 7 isolates grew as clearly blue colonies, the other 6 grew as light purple colonies, difficult to distinguish from O26.
d. O145: all 8 isolates grew as green colonies as expected. The only point worth to mention is that one isolate formed rather small colonies.
Only one O157 (s+) isolate was available for testing. Growth characteristics on B1 were as expected.
On the purification media, all isolates grew as expected, with the exception of one O103 isolate that did ferment dulcitol when O103 is expected not to ferment this sugar.
2. Direct extraction of DNA from stools followed by PCR detection of STEC: very deceiving results were obtained in a few preliminary tests and this technique was abandoned.
Table 5 Isolation efficiencies of STEC O26, O103, O111 and O145, inoculate in different levels to 4 to 6 human faecal samples, using several isolation methods.
Level of inoculum (range) 2-6 104 cfu/5g 2-6 103 cfu/5g
Method platingDirect 1 platingDirect 2 IMS2 platingDirect 1 platingDirect 2 IMS2
Selective medium SMAC B1 B1 SMAC B1 B1
O26 5/6* 6/6 6/6 3/6 4/6 4/6 O103 6/6 6/6 6/6 4/6 6/6 6/6 O111 6/6 6/6 6/6 2/6 2/6 4/6 O145 3/4 3/4 4/4 4/4 2/4 4/4 Level of inoculum (range) 2-6 102 cfu/5g 2-6 101 cfu/5g Method Direct
plating1 platingDirect 2 IMS2 platingDirect 1 platingDirect 2 IMS2
Selective medium SMAC B1 B1 SMAC B1 B1
O26 1/6 0/6 3/6 0/4 0/4 1/4
O103 2/6 3/6 5/6 0/6 0/6 4/6
O111 1/6 1/6 4/6 0/6 0/6 2/6
O145 1/4 1/4 2/4 0/4 0/4 0/4
1: tested by using routine PCR protocol (consensus primers for all VT variants) 2: tested by multiplex PCR developed in this project.
*x=number of positive experiments / y= total performed experiments
In addition, the multiplex PCR was tested directly on mTSB enrichment broth, after extraction by Qiagen DNA extraction kit, with the following results: at levels of 2-6 103 cfu/5 g, all 6
samples were positive by the multiplex PCR developed in this project, at levels of 2-6 103 cfu/5 g, 5/6 samples were positive, at levels of 2-6 102 cfu/5 g, 3/6 samples were positive and
at levels of 2-6 101 cfu/5 g, 1/6 samples was positive.
4. Results on detection of STEC in naturally contaminated stool samples are listed in
Table 6.
Table 6 Isolation efficiencies of STEC O26, O103 and O111, from naturally contaminated human faecal samples, using several isolation methods.
Method PCR on mTSB enrich-ment Direct plating B1 Direct plating SMAC IMS B1 IMS SMAC Positi-ve Colo-nies 9-mPCR Positi-ve Colo-nies 9-mPCR Positi-ve Colo-nies 9-mPCR Positi-ve Colo-nies 9-mPCR O157 7/11* 8/11 8/11 10/11 11/11 11/11 11/11 10/11 11/11 O111 2/2 2/2 2/2 - 2/2 1/2 1/2 - 2/2 O26 1/1 1/1 1/1 - 1/1 1/1 1/1 - 1/1
The PCR performed directly on mTSB broth after extraction of DNA by Qiagen DNA extraction kit was less sensitive than the test performed on colonies (Table 7).
In general, the performance of both solid media was similar on naturally contaminated samples.
- Conclusions:
The preliminary tests on differentiation and confirmation media, showed that adaptation of the instructions for the preparation of the differentiation media were needed. The growth on these media have also to be interpreted with caution, taking into account the problems of standardisation. The performance of the selective medium for non-O157 (B1) has to be further investigated with more O103 STEC isolates.
For the artificially contaminated stool samples: similar results were obtained by direct plating on SMAC and B1. The sensitivity of the method was enhanced by use of IMS. This effect was seen for the 4 serogroups, but more pronounced for O26.
The sensitivity of the new media was not higher than SMAC medium from which randomly selected colonies were selected. For O157 (s-) positive samples, this can be explained by better performance of SMAC medium while for the three non-O157 samples available, the high concentration of STEC explains that both methods performed well. With the artificially contaminated samples, IMS enrichment yielded some enhancement of the sensitivity, especially with serogroup O26.
This method could be useful when studying HUS patients, presenting several days (generally one week) after the start of the acute diarrhoea, when concentrations of STEC have dropped.
3.4. Task 4. Validation of the STEC isolation studies
3.4.1. In-house validation of STEC isolation method
- Partners:
o Ghent University: culture-based isolation of STEC in food samples o ILVO: mPCR screening of the food samples
- Objective:
The STEC isolation protocol developed in a previous SPSD II project (Possé et al., 2008a) is intended to be applicable for different types of food matrices and for samples from the primary
production stage. Therefore the protocol was firstly be validated in-house followed by a validation by an interlaboratory study
- Methods and Materials:
All samples used for this validation were artificially contaminated. Ten samples of minced beef, cheese from raw milk and sprouted seeds were artificially inoculated with varying numbers (10-2000 cfu/25g) of non-stressed and stressed strains belonging to the serotypes O157 (s-) and (s+), O26, O103, O111 and O145. Cultured STEC strains were cold and freeze stressed by storing them for at least 5 days at respectively 2°C and -18°C. Inoculated samples were enriched in a weak selective medium for 6 hours followed by enrichment in a stronger selective medium for 18 hours. Direct plating on a selective medium (B1) was performed after each enrichment step. In a third pathway, an IMS (Dynal or Captivate) step was performed after 24h enrichment and prior to plating. Suspected colonies on B1 were purified and tentatively confirmed on a purification medium (B2) followed by a confirmation by a serotype PCR. Parallel to the classical isolation method, the mPCR screening test has been performed on the enrichment medium (after 24 hours enrichment). DNA is extracted from the enrichment medium using a method described by Yu and Morrison, 2004 (method 3bis, in task 3.2.2).
- Results:
Table 7 Isolation efficiency of STEC O157 (s-) and (s+), O26, O103, O111 and O145 in minced beef (A), cheese from raw milk (B) and sprouted seeds (C) using a protocol with 6 or 24 hours of selective
enrichment followed by direct plating or 24h of selective enrichment followed by IMS (Dynal or Captivate) prior to plating.IMS kits implemented: Dynal (O157 (s-) and (s+), O26, O103),
Captivate (O111, O145). A. B. C. Sprout ed seeds Non-stressed cells 10-30 cfu/25g Non-stressed cells 600-2000 cfu/25g
Stressed cells (2°C 7 days) 10-30 cfu/25g
Enrich-ment 6h 24h 24h 6h 24h 24h 6h 24h 24h
Plating plating Direct plating Direct plating IMS + plating Direct plating Direct plating IMS + plating Direct plating Direct plating IMS + O157 (s-) 0/10 0/10 0/10 0/5 0/5 1/5 0/10 0/10 1/10 O157 (s+) 1/10 0/10 0/10 0/5 0/5 0/5 0/10 0/10 0/10 O26 0/10 0/10 0/10 2/5 1/5 1/5 0/10 0/10 0/10 O103 0/10 0/10 0/10 1/5 1/5 2/5 0/10 0/10 0/10 O111 0/10 0/10 0/10 0/5 0/5 0/5 0/10 0/10 0/10 O145 0/10 0/10 0/10 0/5 0/5 0/5 0/10 0/10 0/10
*x/y: x=number of positive experiments; y= total performed experiments Minced
beef
Non-stressed cells 10-30 cfu/25g
Stressed cells (2°C 7 days) 10-30 cfu/25g Stressed cells (-18°C 14 days) 10-60 cfu/25g Enrich-ment 6h 24h 24h 6h 24h 24h 6h 24h 24h Plating Direct plating Direct plating IMS + plating Direct plating Direct plating IMS + plating Direct plating Direct plating IMS + plating O157 (s-) 2/5* 6/10 7/10 1/9 4/10 9/10 0/10 2/10 6/10 O157 (s+) 2/10 2/10 7/10 2/10 2/10 5/10 0/10 0/10 0/10 O26 3/5 10/10 9/10 1/9 10/10 10/10 0/10 5/10 6/10 O103 4/5 10/10 9/10 0/9 10/10 10/10 0/10 9/10 10/10 O111 2/10 3/10 6/10 0/10 3/10 3/10 0/10 5/10 7/10 O145 2/5 10/10 9/10 0/9 9/10 9/10 0/10 7/10 9/10 Cheese raw milk Non-stressed cells 10-30 cfu/25g
Stressed cells (2°C 7 days) 10-30 cfu/25g Enrich-ment 6h 24h 24h 6h 24h 24h Plating Direct plating Direct plating IMS + plating Direct plating Direct plating IMS + plating O157 (s-) 0/10 9/10 10/10 1/10 10/10 10/10 O157 (s+) 0/10 1/10 4/10 0/10 2/10 4/10 O26 8/10 10/10 10/10 6/10 10/10 10/10 O103 6/10 9/10 10/10 4/10 10/10 10/10 O111 3/10 10/10 10/10 2/10 10/10 10/10 O145 3/10 10/10 10/10 6/10 10/10 10/10
In general, for minced beef samples inoculated with non-stressed and cold stressed cells, serotypes O26, O103 and O145 were very well isolated using direct plating after 24h, O157 (s-) was efficiently isolated using IMS, and detection rates of O157 (s+) also increased using IMS. Non-stressed O111 was isolated insufficient by direct plating and detection rates increased using IMS. Recovery rate remained low for cold stressed O111 cells, even when using IMS. For freeze stressed cells, detection rates were low for each serotype and for all tested methods in a first inoculation experiment (results not shown), but this could be due to the low inoculation level (1-5 cfu/25g). Inoculating minced beef samples with a higher number of freeze stressed cells resulted in high detection rates for O103, O26, O111, O145 and O157(s-). Recovery rates for O103 using direct plating or IMS followed by direct plating after 24h were very high. For O111, O145, O26 and O157 (s-) recovery rates increased using IMS followed by plating after 24h. For O157 (s+) higher inoculation did not result in a satisfying detection with any method tested. In concrete, for minced beef samples inoculated with non-stressed or cold stressed cells (10-30 cfu/25g), detection rates of the serotypes O26, O103 and O145 were high to maximal (90-100%) using the protocol of 24 h enrichment followed by direct plating or IMS followed by plating resulting in a reliable (≥75%) detection of 10-30 cfu/25 g. Detection rates of these serotypes were lower when 6h enrichment was followed by direct plating. For the serotype O157 (s-) detection rates increased using IMS after 24h of enrichment from 40-60% to 70-90% for cold stressed and non-stressed cells. Detection rates were lower when 6h enrichment was followed by direct plating. The implementation of IMS for the isolation of STEC O157 (s+) resulted in the detection rates to increase from 20% to 50-70% for non-stressed and cold-stressed cells. Using direct plating after 6h of enrichment STEC O157 (s+) was detected in only 20% of the samples. Non-stressed and cold stressed STEC O111 was isolated from 0-30% of the samples using direct plating (after 6h and 24h of enrichment) and 30-60% of the samples using IMS followed by plating. In conclusion, for the serotypes O157 (s+) and O111 10-30 cfu/25g were not reliably detected. For freeze stressed cells, detection rates did not reach 50% for O157(s+) using any method. For all serotypes detection rates were 0% using direct plating after 6h enrichment. Detection rates for freeze stressed O103 and O145 were high to maximal (70-100%) using direct plating or IMS followed by direct plating after 24h and a detection limit of 10-30 cfu/25g was reached. For O157(s-), O26 and O111 detection rates were 20-50% using direct plating and 60-70% using IMS. A detection limit of 10-30 cfu/25g was not reached for O157(s-), O26 and O111 (Table 7A).
For cheese from raw milk inoculated with non-stressed and cold stressed cells, detection rates of the serotypes O157 (s-), O26, O103, O111 and O145 were high to maximal (90-100%) using the protocol of 24 h of enrichment followed by direct plating or IMS followed by plating resulting
in a reliable detection of 10-30 cfu/25g. For samples inoculated with non-stressed and cold stressed STEC O157 (s+) cells, detection rates were below 50% (10-40%) using the protocol of 24h enrichment followed by direct plating or IMS followed by plating. Using the protocol with 6h enrichment, non-stressed and cold stressed STEC cells were detected in 0-10% of the samples for O157 (s-) and (s+), 60-80% for O26, 40-60% for O103, and 20-30% for O111 and 30-60% for O145 (Table 7B).
For sprouted seeds detection rates of STEC were low for all serotypes and all methods. Only STEC O157 (s-) and (s+), O26 and O103 could be detected (10-40%). A detection limit of 10-30 cfu/25g sprouted seeds was reached for none of the serotypes. Experiments to determine the detection limit by inoculating non-stressed cells up to 2000 cfu/25g were carried out in a second stage. Detection rates of STEC again stayed low for all serotypes and methods. Only 40% of O103 and 20% of O26 and O157 (s-) could be detected. Detection limit for all serotypes must be >2000 cfu/25g (Table 7C).
Parallel to the classic isolation method an mPCR (Task 3.2.2) was performed on the 24h enrichment media. Table 8 presents the expected amplification products for the different strains used in the inoculation experiments. The mPCR reaction mix includes 9 primerpairs; 5 serotype specific (O111, O145, O103, O26 & O157) and 4 virulence gene specific (eae, ehx, VT1 & VT2). The mPCR reaction amplifies 4 sequences in every strain, one serotype specific and three virulence specific sequences.
Table 8 List of possible mPCR amplification products for the different strains used for inoculation and the respective lengths of these fragments.
strain serotype O26 ehx VT2 VT1 O145 eae O111 O103 O157 PH4 O103 - + - + - + - + - PH25 O26 + + - + - + - - - PH27 O145 - + + - + + - - - PH29 O111 - + - + - + + - - PH59 O157 s- - + + - - + - - + PH76 O157 s+ - + + - - + - - + bp 492 442 399 352 303 264 214 160 101
During the implementation of the mPCR on the DNA extracted from the enrichment media some samples had a shortage of amplification products. It differed between samples from which fragments did not become amplified. Most samples also showed aspecific amplification. All aspecific fragments were of bigger size than the fragments of interest, implicating no