Compression of the Earth’s magnetotail by interplanetary shocks
directly drives transient magnetic flux closure
B. Hubert(1), M. Palmroth(2), T.V. Laitinen(2), P. Janhunen(2), S.E. Milan(3), A. Grocott(3), S.W.H. Cowley(3), T. Pulkkinen(2), and J.-C. Gérard(1).
1. Laboratory for Planetary and Atmospheric Physics, Université de Liège 2. Finnish Meteorological Institute, Space Physics Group
3. Department of Physics & Astronomy, University of Leicester
Abstract
We use a novel method to evaluate the global opening and closure of magnetic flux in the terrestrial system, and to analyse two interplanetary shock passages that occurred during magnetically quiet periods. We find that, even under these quiet conditions, where the amount of open flux was already low, the compression of the magnetotail by the shocks still created intense but short-lived bursts of flux closure reaching ~130 kV, comparable to values obtained shortly after a substorm onset, although no expansion phase developed. The results, supported by a global MHD simulation of the space environment, point to a trigger mechanism of flux closure directly driven by the solar wind compression, independent of the usual substorm expansion phase process.
1. Introduction
The solar wind plasma outflow from the Sun carries the interplanetary magnetic field (IMF) outward into the solar system, where it interacts with the Earth’s magnetic field. Reconnection with the IMF at the outer magnetopause boundary of the planetary field produces open magnetic field lines which map from the polar regions of the planet into the solar wind. These open field lines are carried anti-sunward by the solar wind flow and are stretched into a long magnetic tail, in which the field lines eventually reconnect and return to the Earth [Dungey, 1961]. The auroral substorm cycle classically consists of a growth phase, a substorm onset, an expansion phase and finally a recovery phase [Akasofu, 1964; McPherron, 1970]. During the growth phase, the interplanetary magnetic field (IMF) carried by the solar wind is usually oriented southward so that it efficiently reconnects with the geomagnetic field, producing new open flux. This phase ends in a substorm onset characterized by a sudden localized brightening of the polar aurora near midnight, which announces the expansion phase during which accumulated open flux is closed by intense magnetic reconnection in the
magnetotail [Milan et al., 2004 and references therein]. The system then returns to a quiet state during the recovery phase. In addition, solar bursts of fast-flowing plasma develop into interplanetary shocks, which interact with the magnetic environment of the Earth and can influence the rate of open flux closure in the tail. It is well known that, among other disturbances, interplanetary shocks can trigger flux closure and the development of an expansion phase [Boudouridis et al., 2005 and references therein, Meurant et al., 2003, Milan
et al., 2004]. Similar processes can occur on other planets as well, and should be considered
as a general mechanism involved in magnetospheric physics. Indeed, shock-induced open flux closure has been suggested to be the basic cause of Saturn’s auroral dynamics [Cowley et al., 2005].
We have developed a method that combines space-based measurements of the proton aurora and ground-based measurements of the ionospheric flow to compute the global rates at which flux is opened and closed in the Earth’s magnetosphere [Hubert et al., 2006]. These rates are expressed as voltages, with 1 V being equivalent to 1 Wb s-1 from Faraday’s law. The images of the proton aurora are from the Spectrographic Imager at 121.8 nm (SI12) instrument of the Far UltraViolet (FUV) experiment onboard the Imager for Magnetopause to Aurora Global Exploration (IMAGE) satellite [Mende et al., 2000], and allow us to estimate the location of the boundary between open and closed field lines, as well as its latitudinal motion [Hubert et al., 2006]. The ionospheric flow velocity vi
r
is measured with the Super Dual Auroral Radar Network (SuperDARN) radar system and is used to retrieve the ionospheric electric field Ei
r given by Ei vi B r r r × − = where B r
is the Earth’s magnetic field [Ruohoniemi and Baker,1998]. The electric field in the reference frame of the open-closed field boundary can then be obtained, and integrated along the boundary to compute the voltages associated with flux opening and closure [Blanchard et al., 2001, and references therein]. This method has already been successfully applied to the study of the substorm cycle [Hubert et al., 2006]. The IMAGE-FUV instrument captures an image of the planet every 2 min, though the filtering process that is applied in our method to denoise our results and allow time derivative computation reduces the time resolution to ~12 min, thus slightly smearing rapidly varying signals. In this study, we analyze the time dependent flux closure directly due to the interaction of shocks and the magnetotail on the global scale, both from the observational and the theoretical standpoints
2. Observed shock-induced reconnection
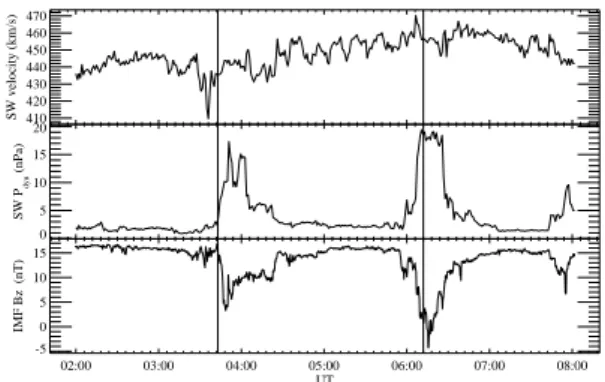
On 8 November 2000, two interplanetary shocks impinged on the Earth following a several hour interval of dominantly northward IMF (Figure 1), such that no growth phase signature was expected and the amount of open flux in the system was rather low. The interaction of the shocks with the magnetosphere disturbed its field lines on the dayside
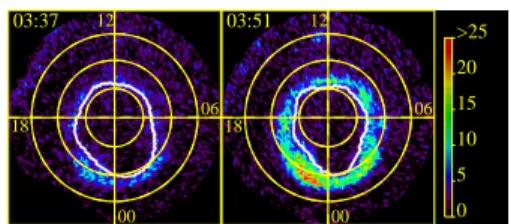
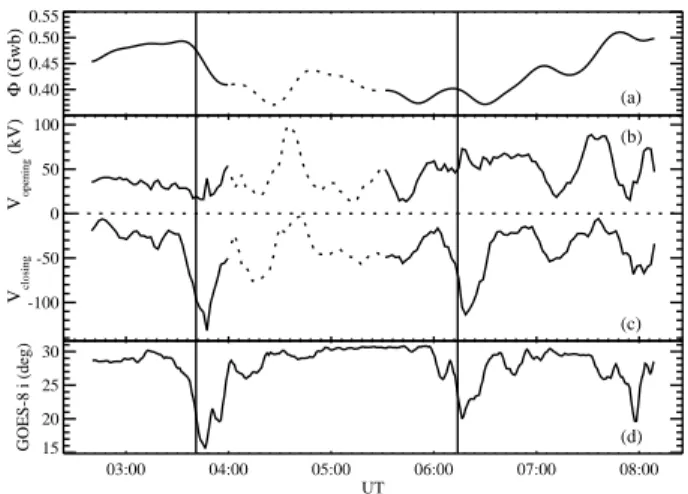
causing subauroral proton flashes [Hubert et al., 2003] at 0339 UT and 0612 UT. The solar wind plasma then swept by the planet and interacted with the magnetotail. The auroral activity triggered by these shocks did not evolve into a substorm, as confirmed by their ground magnetic signature, which did not display the characteristic ‘magnetic bay’ signature. The ground based magnetometers of the International Monitor for Auroral Geomagnetic Effects network all recorded similar signatures, consisting of oscillations following the shock (not shown). The AU and AL indices (not shown) demonstrate that substorm activity was not in progress. Energetic particle observations at geosynchronous orbit (not shown) support this conclusion. Figure 2 shows the global proton aurora prior to (0337 UT) and after (0351 UT) the first shock hit the Earth, with the polar cap boundary indicated by the white line. The poleward contraction of the boundary is conspicuous, especially in the pre- and post-midnight sectors. The simultaneous data from IMAGE-FUV SI12 and SuperDARN were then used to compute the variations in the open flux during the interval, and the individual rates at which flux is opened and closed, with results shown in Figure 3. A transpolar arc was observed between 0400 and 0530 UT that disturbed our algorithms and impaired their reliability, although the presence of a transpolar arc is not of crucial importance in this study because these structures evolve only slowly whereas we are studying transient phenomena. The first shock hit the planet at 03:39 UT. A few minutes later, the flux closure rate dramatically intensified to 132 kV, and then returned to undisturbed values. Overall the open flux in the system significantly decreased. The second shock impinged on the Earth at 06:12 UT and again caused an intensification of the closure rate from ~20 to 114 kV in the following minutes. The intensification of the closure voltage of Figure 3 prior to the arrival of the shock results partly from a smearing of rapidly varying signals by our algorithms and partly from the increase of the solar wind dynamic pressure prior to the arrival of the shock main ramp. The shock-induced reconnection determined here is consistent with the geosynchronous measurement of the geomagnetic field by the GOES-8 satellite, ideally located in the midnight sector in the northern lobe at the time of both shocks. The Bx component of the magnetospheric field (and thus the earthward component as well) exhibits a marked decrease at the time of each shock arrival, while the Bz component increases. The magnetic inclination angle (defined as acotan(Bp/Be) with Bp –Be– the component of the magnetic field along the perpendicular to the orbital plane –along the satellite-Earth line, respectively–) sharply decreases at the time of both shocks (Figure 3) indicating dipolarization, a well known signature of tail reconnection.
Both events thus share similar properties. An interplanetary shock interacted with the Earth when the open magnetic flux was low: less than 0.5 GWb for the first event, and less than 0.4 GWb for the second. Despite this fact, the flux closure voltage intensified after the shock to values similar to those of a substorm expansion phase, though other expansion phase features were not observed in these cases. The nightside magnetic reconnection presented here
is thus clearly not related to the classical substorm cycle. Indeed, one would usually expect the pre-onset open flux to be significantly higher than in Figure 3, with values of 0.7 - 1 GWb being reported previously, while the open flux seems to reach values below 0.4 GWb only rather rarely [Milan et al., 2006]. The mechanism responsible for the flux closure reported here must be studied from another standpoint, since it does not follow from an accumulation of large amounts of open flux in the magnetotail, but is driven more directly by the interaction of the interplanetary shocks with the magnetosphere, which are capable of compressing the magnetotail as they sweep by it.
The phenomenon of transient flux closure induced by an IP shock does of course not exclude reconnection inherent with the substorm cycle. A major IP shock has been observed on 18 April 2001, that impinged on the Earth at ~0047 UT when the open flux was ~0.89 GWb as determined using SI12 images. A dramatic transient flux closure resulted from the interaction of the shock and the magnetosphere, reaching ~340 kV (a value much larger than those usually met at substorm onset) shortly after the shock had reached the dayside magnetopause and had triggered a subauroral proton flash. The activity that followed the transient closure, considering the AU and AL indices as well as the computed closure voltage, points to the substorm expansion and recovery phases (not shown). We can thus speculate that the compression of the tail by the IP shock triggered a direct flux closure and a substorm expansion at the same time.
3. MHD simulation
A theoretical simulation was undertaken with the magnetohydrodynamic (MHD) Grand Unified Magnetosphere-Ionosphere Coupling Simulation (GUMICS-4) model [Janhunen, 2000] in order to analyze the mechanism responsible for the flux closure. This model solves the equations of ideal MHD for the coupled solar wind – magnetosphere system, and is coupled to an ionospheric simulation. Like any ideal MHD model, GUMICS-4 does not include any explicit modelling of the reconnection microphysics, nor does it reproduce the loading-unloading cycle [Laitinen et al., 2005]. However, the model is able to describe the plasma flow and magnetic field topology in the surroundings of a neutral line that develops in the tail. Indeed, in a first approximation, classical MHD remains valid in the diffusion region surrounding the reconnection site [Kivelson and Russel, 1997], although Hall MHD is important as well in the immediate vicinity of a (substorm-related) reconnection line [Nagai et al., 2003, and referances there in] . The neutral line appears in the simulation as a consequence of numerical diffusion that mimics resistive processes when the magnetic topology is close to the x-line structure. No reconnection voltage can be consistently computed from the simulation because the computed electric field remains null or perpendicular to the merging line in ideal MHD. However, it is possible to compute the
reconnection power, i.e. the amount of magnetic energy that is converted into thermal and kinetic energy by reconnection at the x-line, by integrating the divergence of the Poynting vector over a volume that contains the neutral line [Laitinen et al., 2005]. We focus on the structure of the MHD flow in order to identify the manner in which it could influence a realistic reconnection neutral line in the tail.
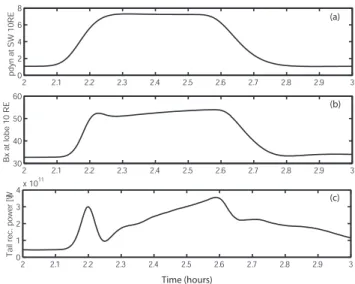
The simulation that we conducted represents the interaction of an interplanetary shock with the magnetosphere under northward IMF Bz conditions. The magnitude of the x-component of the magnetic field in the tail lobe and the computed reconnection power are shown in Figure 4, together with the solar wind dynamic pressure used as model input. The simulation conventionally starts at 00:00 UT. The model is first run with steady inputs until it reaches a steady state around 01:30 UT. The solar wind density is suddenly increased around 02:10 UT, simulating the arrival of an interplanetary shock. The increased density compresses the magnetosphere, causing the geomagnetic Bx field component to intensify. As the geomagnetic field is mostly parallel to the x direction in the tail lobe, such an increase in Bx implies an increase of the magnetic field magnitude. The computed nightside reconnection power exhibits an increase by a factor ~7 after the shock hits the magnetosphere. Figure 5 presents the computed plasma density and shows how the shock drapes around the magnetopause compressing it. The lobe magnetic field signature seen in the simulation (increase of Bx –Figure 4–, positive deflection of By and negative deflection of Bz in the north lobe) is known to be typical of lobe compression [Huttunen et al., 2005]. The compression of the magnetotail extends all the way down to the equatorial plane, causing an increase of the plasma density in the near Earth plasma sheet (Figure 5). The magnetic Bx disturbance only vanishes after the solar wind pressure is decreased, indicating that the magnetic field lines are “piled up” in the tail by the lobe compression. This shows that the simulated plasma flow and geomagnetic topology, and hence the way the x-line region is fed with magnetic field to be reconnected, are strongly influenced by the solar wind pressure exerted on the magnetospheric tail. Detailed inspection of the MHD simulation outputs thus shows that direct compression is responsible for the modification of the geomagnetic topology that leads to closure reconnection. Indeed, a disturbance of a boundary layer can result in the crossing of a critical limit of stability leading to the formation of a neutral line topology [Brin et al., 2003].
4. Summary
The direct capability of solar wind disturbances to drive near-tail magnetic reconnection, and the dependence of the tail energy state on the ability of near-tail reconnection to drive a substorm are important elements in understanding the solar wind – magnetosphere coupling. We have demonstrated that the observed intensification of the flux closure rate under the effect of interplanetary shocks is directly driven by the compression of
the tail lobes that moves the flowing plasma and field lines towards the plasma sheet, feeding the reconnection site with fresh magnetic flux. This produces reconnection voltages larger than 110 kV, comparable with values found shortly after substorm onsets, despite the pre-existing open flux content being so small during these events that effects related to the loading-unloading substorm cycle are not expected.
Acknowledgements. J.-C. Gérard and B. Hubert are supported by the Belgian National Fund for Scientific Research (FNRS). This work was funded by the PRODEX program of ESA. Work at Leicester was supported by PPARC grant PPA/G/O/2003/00013. ACE level 2 data were provided by N.F. Ness (MFI) and D.J. McComas (SWEPAM), and the ACE Science Centre. GOES-8 data were obtained thanks to CDAWeb. AU and AL indices are provided by the World Data Centre for Geomagnetism (WDC-C2) in Kyoto.
References.
Akasofu, S. I., The development of the auroral substorm, Planet. Space Sci., 12, 273, 1964. Brin, J., K. Schindler, and M. Hesse, Formation of thin current sheets in the magnetotail:
Effects of propagating deformations, J. Geophys. Res., 108, 1337, doi: 10.1029/2002JA009641, 2003.
Blanchard, G. T., C. L. Ellington, L. R. Lyons, and F. J. Rich, Incoherent scatter radar identification of the dayside magnetic separatrix and measurement of magnetic reconnection, J. Geophys. Res., 106, 8185, 2001.
Boudouridis, A., E. Zesta, L. R. Lyons, P.C. Anderson, D. Lummerzheim, Enhanced solar wind geoeffectiveness after a sudden increase in dynamic pressure during southward IMF orientation, J. Geophys. Res., 110, doi: 10.1029/2004JA010704, 2005.
Cowley, S.W.H., S.V. Badman, E.J. Bunce, J.T. Clarke, J.-C. Gérard, D. Grodent, C.M. Jackman, S.E. Milan, and T.K. Yeoman, Reconnection in a rotation-dominated magnetosphere and its relation to Saturn’s auroral dynamics, J. Geophys. Res., 110, A02201, doi:10.1029/2004JA010796, 2005.
Dungey, J.W., Interplanetary field and the auroral zones, Phys. Res. Lett., 6, 47, 1961
Hubert, B., J.-C. Gérard, S. A. Fuselier, S. B. Mende, Observation of dayside subauroral proton flashes with the IMAGE-FUV imagers, Geophys. Res. Lett., 30, 10.1029/2002GL016464, 2003.
Hubert, B., S. E. Milan, A. Grocott, C. Blockx, S. W. H. Cowley, and J.-C. Gérard, Dayside and nightside reconnection rates inferred from IMAGE FUV and Super Dual Auroral Radar Network data, J. Geophys. Res., 111, A03217, doi:10.1029/2005JA011140, 2006.
Huttunen, K. E. J., J. Slavin, M. Collier, H.E.J. Koskinen, A. Szabo, E. Tanskanen, A. Balogh, E. Lucek, and H. Rème, Cluster observation of sudden impulses in the magnetotail caused by interplanetary shocks and pressure increases, Ann. Geophys., 23, 609, 2005.
Janhunen P., A positive conservative method for magnetohydrodynamics based on HLL and Roe methods, J. Comp. Phys., 160, 649-661, 2000.
Kivelson, M. G. and C. T. Russel, Introduction to space physics, Cambridge University Press, 1997.
Laitinen, T. V., Pulkkinen, T. I., Palmroth, M., Janhunen, P., and Koskinen, H. E. J., The magnetotail reconnection region in a global MHD simulation, Ann. Geophys., 23, 3753-3764, 2005.
McPherron, R.L., Growth phase of magnetospheric substorms, J. Geophys. Res., 75, 5592, 1970
Mende, S.B., H. Heetderks, H.U. Frey, J.M. Stock, M. Lampton, S. Geller, R. Abiad, O. Siegmund, S. Habraken, E. Renotte, C. Jamar, P. Rochus, J.C. Gérard, R. Sigler, and H. Lauche, Far ultraviolet imaging from the IMAGE spacecraft : 3. Spectral imaging of Lyman alpha and OI 135.6 nm, Space Sci. Rev., 91, 287, 2000.
Meurant, M.;J.-C. Gérard, B. Hubert, V. Coumans, C. Blockx, N. Østgaard, S. B. Mende, Dynamics of global scale electron and proton precipitation induced by a solar wind pressure pulse, Geophys. Res. Lett., 30, 2032 10.1029/2003GL018017, 2003.
Milan, S. E., S. W. H. Cowley, M. Lester, D. M. Wright, J. A. Slavin, M. Fillingim, C. W. Carlson, and H. J. Singer, Response of the magnetotail to changes in the open flux content of the magnetosphere, J; Geophys. Res., 109, doi: 10.1029/2003JA010350, 2004. Milan, S. E., J. A. Wild, A. Grocott, and N. C. Draper, Space- and ground-based
investigations of solar wind-magnetosphere-ionosphere coupling, Adv. Space. Res., in press, 2006.
Nagai, T., I. Shinohara, M. Fujimoto, S. Machida, R. Nakamura, Y. Saito and T. Mukai, Structure of the Hall current system in the vicinity of the magnetic reconnection site, J.
Geophys. Res., 108, 1357, doi: 10;1029:2003JA009900, 2003
Ruohoniemi, J. M., and K.B. Baker, Large scale imaging of high latitude convection with Super Dual Auroral Radar Network HF radar observations, J. Geophys. Res., 103, 20797, 1998.
410 420 430 440 450 460 470 SW velocity (km/s) 0 5 10 15 20 SW P dyn (nPa) 02:00 03:00 04:00 05:00 06:00 07:00 08:00 UT -5 0 5 10 15 IMF Bz (nT)
Figure 1. Solar wind velocity (top panel), dynamic pressure (middle panel) and IMF Bz component measured with the ACE satellite, time-shifted to account for the propagation delay between the spacecraft and the Earth. The vertical lines indicate the time at which the main auroral signature is seen in the SI12 images, i.e. the development of a dayside subauroral proton flash, that proves that the dayside magnetosphere is being compressed by the solar wind discontinuity.
00 06 12 18 03:37 00 06 12 18 03:51 0 5 10 15 20 >25
Figure 2. Polar view of the proton aurora captured with IMAGE-FUV SI12 (expressed in image counts) prior to and after that an interplanetary shock did hit the Earth at 0339 UT. Concentric circles are 10 degrees of geomagnetic latitude apart. Local midnight is at the bottom and local noon at the top of each image. The overlaid white curve represents the polar cap boundary determined from these images.
0.40 0.45 0.50 0.55 Φ (Gwb) (a) -100 -50 0 50 100 Vopening (kV) Vclosing (b) (c) 03:00 04:00 05:00 06:00 07:00 08:00 UT 15 20 25 30 GOES-8 i (deg) (d)
Figure 3. Open magnetic flux of the magnetosphere (a), flux opening rate at the dayside (b) and flux closure rate in the magnetotail (c), 8 November 2000, deduced from combined ground-based and global remote sensing observations. Inclination angle of the magnetic field deduced from measurements of the GOES-8 satellite at geosynchronous altitude (d). Vertical lines indicate the arrival time of the main ramp of each interplanetary shock at the Earth magnetopause. A transpolar arc was observed between 0400 and 0530 UT that disturbed our algorithms and impaired their reliability (dotted lines in panels a, b and c).
2 2.1 2.2 2.3 2.4 2.5 2.6 2.7 2.8 2.9 3 0 2 4 6 8 pdyn at SW 10RE 2 2.1 2.2 2.3 2.4 2.5 2.6 2.7 2.8 2.9 3 30 40 50 60 Bx at lobe 10 RE 2 2.1 2.2 2.3 2.4 2.5 2.6 2.7 2.8 2.9 3 0 1 2 3 4x 10 11
Tail rec. power [W
]
(a)
(b)
(c)
Time (hours)
Figure 4. Solar wind dynamic pressure used as input of the MHD simulation (a). Computed magnetic field Bx component in the tail lobe at 10 RE (b) and computed reconnection power (c).
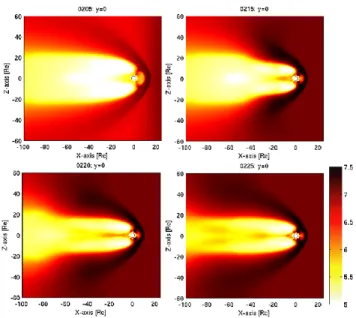
Figure 5. Plasma density (cm-3) in the XZ plane computed with the GUMICS-4 MHD model for an interplanetary shock interacting with the Earth magnetosphere during an interval of northward IMF. The images were taken in the interval from 0200 to 0225 UT.