Page 1 of 6
2015-01-XXXX
Strength Analysis of CFRP Composite Material Considering Multiple
Fracture Modes
Author, co-author (
Do NOT enter this information. It will be pulled from participant tab in
MyTechZone
)
Affiliation (
Do NOT enter this information. It will be pulled from participant tab in MyTechZone
)
Abstract
The strength characteristic of CFRP composite materials often is dependent on the internal micro-structural fracture mode. Therefore, in order to precisely predict this strength, each fracture mode and its mutual influence must be taken into account in a simulation.
In this paper, intra-ply fracture progression and load
characteristics of a cyclic loading test were analyzed, utilizing a material model proposed by Ladeveze et al. The model can evaluate different fracture modes and the stiffness degradation resulting from them. The analyzed results were compared with actual test results to confirm the validity of the analysis. Another analysis was performed without considering the mutual influence of the different fracture modes, and the results were compared to discuss the necessity of the coupling.
Introduction
Carbon fiber reinforced plastic (CFRP) composite material has a higher specific strength and stiffness than steel, so it is expected to contribute to the overall weight reduction of automobile structures. Unlike metals, CFRP tends to show micro-fractures of the resin inside the structure, and often its strength is determined by its fracture mode. Therefore, it is necessary to consider each fracture mode and its progression in order to accurately predict its strength by simulation. In one of the methods, progression of the fracture is reproduced by applying pre-defined stiffness degradation to the location where certain criteria, which are also defined for each fracture mode, are reached. The validity of this model is shown by an FEM analysis of the static and dynamic loading of automobile structure parts [1].
On the other hand, some failure models have been proposed that apply the idea of “damage” to the micro-fractures inside the composite laminate for a more clear definition of stiffness degradation [2,3]. By considering the stiffness reduction and change in stress distribution due to that reduction, an evaluation of load and strength characteristics becomes possible. But in order to appropriately model the damages, all damages and mutual influences (coupling) must be expressed in functions, which is not easily done without knowledge of the internal fracture progression.
In this paper, a numerical analysis of composite test specimens was performed by adopting the damage model proposed by Ladeveze et al. to take into account the stiffness degradation due to the damage, and mutual coupling of different damage modes. The analyzed results were then compared with coupon tests to show the necessity of
considering the coupling between different fracture modes, and how the coupling factor affects the reproducibility of the test results.
Intra-Ply Material Model
First of all, the intra-ply fracture model for composite laminate with uni-directional fiber will be described. In this paper, the model by Ladeveze et al. is applied.
Definition of Intra-ply Damage Model
Strain energy inside the ply is expressed by the following
Eq. (1). 23 2 23 13 2 13 12 2 12 33 22 2 0 23 33 11 1 0 13 22 11 1 0 12 3 2 33 2 2 22 1 2 11 3 2 2 2 2 2 2 G G G E E E E E E E D (1)
Ei and Gij are Young’s modulus and shear modulus, respectively, is stress, is Poisson’s ratio, and subscripts 1, 2, and 3 each represent the axis direction in the composite coordinate system, as shown in Fig. 1. Damage variables dij resulting from each fracture mode are introduced as in Fig. 1, and the reduction of each modulus is defined as Eq. (2).
) 1 ( ) 1 ( ) 1 ( 12 0 12 12 22 0 2 2 11 0 1 1 d G G d E E d E E (2)
and are the initial moduli before damage is applied.
Simplifying Eq. (1) into a two-dimensional form and combining it with Eq. (2) will result in two-dimensional strain energy
Page 2 of 6 ) 1 ( 2 2 ) 1 ( 2 ) 1 ( 2 12 0 12 2 12 22 11 0 1 0 12 0 2 2 22 22 0 2 2 22 11 0 1 2 11 2 d G E E d E d E E D d (3) 〈 〉 and 〈 〉 represent tensile and compressive stress, respectively. Here, thermodynamic force Yij is introduced as defined by Eq. (4). ij D d ij d E Y 2 (4) Therefore, 2 22 0 2 2 22 22 2 22 2 12 0 12 2 12 12 2 12 2 11 0 1 2 11 11 2 11 1 2 1 2 1 2 ) ( ) ( ) ( d E d E Y d G d E Y d E d E Y D d D d D d (5)
As can be seen from Eq. (5), damage variables dij can be defined as functions of thermodynamic forces Yij. These thermodynamic forces can be seen as energies impacting the different damages. When these energies increase, each related damage variable dij will also increase.
Figure 1. Schematic Drawing of Composite Coordinate System and Damage Modes
Definition of Damage Coupling Parameter
The damage d12 by shear and the damage d22 in the transverse direction with respect to the fiber are both due to the fracture of the resin. Therefore, some kind of mutual influence must be considered. An equivalent thermodynamic force Y is defined as a combination of both energies in the shear and in transverse directions, applying the coefficient b2.12 22
2Y Y
b
Y (6)
The coupling of two damage variables is defined as follows using the coefficient b3.
1 2 3 2 2 b d
d (7)
Figure 2 shows the relationship between d12 and d22. Y0 is the energy where damage is initiated, Ys is the critical energy value where damage reaches 1.
Figure 2.Comparison of Shear and Transverse Damage Characteristics
Definition of Resin Plasticity and Fiber
Non-linearity
The effect of permanent deformation due to the plastic strain of resin is accounted for in the model using following equation.
R
Kp
d
0 1 2 1 2 1 21
~
(8)̃ is equivalent shear stress, R0 is yield stress, p is
permanent strain, and K and are both material parameters. p is defined as an accumulation of plastic shear strain , using the following equation.
p p
d
d
d
p
~
12
(
1
12)
12 (9)On the other hand, the non-linearity of the fiber modulus is also taken into account using the following equation.
0
11
11
1 1E
E
(10) +and - are coefficients for tension and compression, respectively.
Damage Parameter Identification Process
In this section, the identification process for the CAE parameters regarding the definition of each damage variable will be discussed. Each parameter is identified through a series of coupon tests with different ply configurations. For the identification of these parameters, FEM analysis is not necessary.Page 3 of 6
Identification of Fiber Damage Property
The damage characteristic for the fiber tension direction is obtained from a tension test of either [0]ns or [0/90]ns coupon.Since fibers show brittle fractures, the damage evolution would look like that shown in Fig. 3. Fiber fracture stress 11max is first derived from the ultimate stress of the tension test, then the critical thermodynamic force Y11t is calculated from the following equation. 0 1 2 max 11 11 2E Y t (11)
The critical thermodynamic force Y11c in the compression direction can be obtained in a manner similar to that of the tensile test.
Figure 3. Damage Characteristic of Fiber
Identification of Shear Damage Property
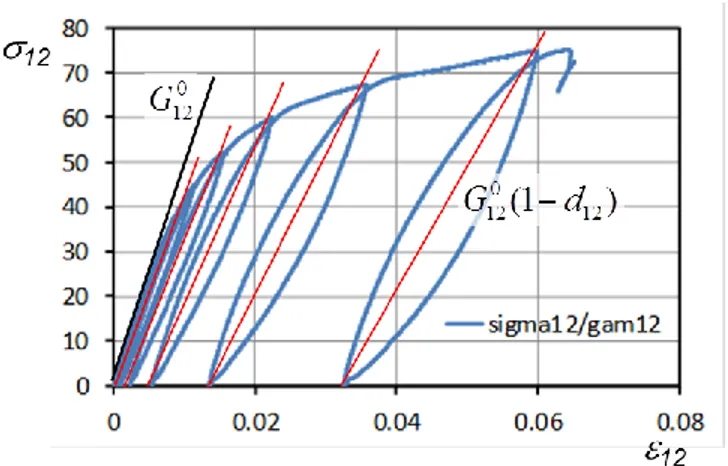
The damage characteristic in the shear direction can be derived from a cyclic tension test of [+45/-45]ns couponspecimen. In a cyclic tension test, the specimen is repeatedly loaded and unloaded with increasing load after every cycle. Then, as shown in Fig. 4, shear moduli are determined in each load cycle to obtain the damage d12 from the Eq. (2). Next, Y12 is calculated from Eq. (5) for every load cycle. Finally, calculated d12 and √ are plotted on the graph to obtain the
shear damage characteristic as shown in Fig. 5.
Figure 4. Stress-Strain Curve of [+45/-45]ns Cyclic Test
Figure 5. Shear Damage Characteristic
Identification of Transverse Damage Property
and Coupling Parameters
The damage characteristic in the fiber’s transverse direction, and the coupling coefficients with the shear damage, b2 and b3, are derived from a [+67.5/-67.5]ns cyclic test together with the
previously mentioned [+45/-45]ns cyclic test results. From the
stress-strain measured in the [+67.5/-67.5]ns test, shear
stress-strain 12-12 and transverse stress-strain 22-22 relations are
first calculated. Then using both stress-strain relations, d12, d22, Y12, and Y22 for each load cycle is derived in a way similar to that explained in the previous section.
To obtain coupling parameter b2, its value is fixed so that d12 plotted as a function of equivalent thermodynamic force √ √ , match with d12 plot in Fig. 5, which was obtained from a [+45/-45]ns test. The two functions are plotted
together with the identified value of b2 in Fig. 6.
Figure 6. Identification of b2
A similar procedure is used to define b3. Considering the relation shown in Eq. (7), the value of b3 is set so that
(√ ) derived from the [+45/-45]ns test and (√ ) from
Page 4 of 6
Figure 7 Identification of b3
FEM Model
Figure 8 shows the coupon model used for FEM analysis. The model consists of solid elements with an overall length of 200mm and a width of 25mm. The thickness of each ply is 0.227mm, and the single solid is 1.816mm, which corresponds to 8 plies. There are three-ply configurations, [+45/-45]2s,
[+67.5/-67.5]2s, and [+67.5/+22.5]2s, with 0 degree on the
loading direction. Shell elements are attached to the surface to measure the strains on loading direction and transverse direction. One end of the model is constrained and the other end is given a cyclic tension load. The damage is assumed to only act two dimensionally. The coupling parameters are b2=0.5 and b3=0.6. The implicit solver SAMCEF was used for the analysis.
Figure 8. FEM Coupon Model
Simulation Results
Using the previously identified parameters and FEM model, a cyclic tension loading test was simulated. To discuss the importance of the coupling parameters, analyses were performed both taking them into account and not taking them into account.
Results Considering the Coupling Parameter
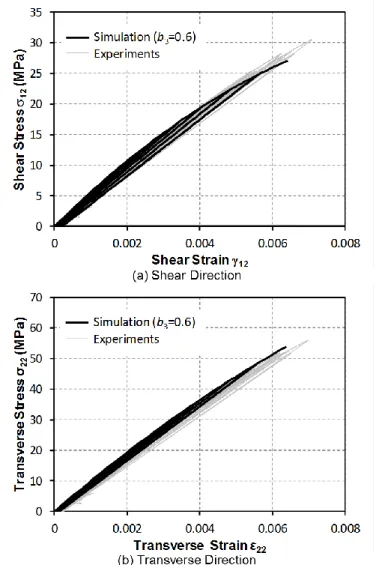
Figures 9 and 10 show the simulated and experimental results of the [+45/-45]2s and [+67.5/-67.5]2s configurations,respectively. For the [+45/-45]2s configuration, stress-strain on
the shear direction is shown, while for [+67.5/-67.5]2s,
stress-strain on both the shear and transverse directions are shown. Although an FEM analysis was not used for parameter identification, the simulated results accurately reproduce the stiffness degradation due to damage progression, and permanent deformation after unloading.
Figure 9. Shear Stress-Strain Comparison of [+45/-45]2s Lay-up
Figure 10. Stress-Strain Comparison of [+67.5/-67.5]2s Lay-up
Figure 11 shows a similar result for the [+67.5/-22.5]2s
configuration, which was not used for parameter identification. Since fibers do not intersect perpendicularly, longitudinal strain
L and transverse strain T are used for the comparison. The simulated results correlate with the experimental ones with this ply configuration also. It can be said that this damage model
Page 5 of 6
can be applied for damage evaluation for composites with any ply configuration.
Figure 11. Stress-Strain Comparison of [+67.5/+22.5]2s Lay-up
Results without the Coupling Parameter
In this section, the simulated result which did not take into account the damage coupling parameter b3 is presented. When b3 is ignored, the damage in the fiber’s transverse direction will not be taken into account. Figure 12 shows the result for the [+45/-45]2s configuration. In this lay-up, the absence of b3 has only a small influence because the stress in the transverse direction is small. The only difference is the fracture before the final load cycle. Because the damage in the transverse direction is not considered, the stress increases, resulting in a slight early increase in shear damage, and early failure.Figure 12. Shear Stress-Strain Comparison of [+45/-45]2s Lay-up with b3=0
Figure 13 shows a similar result for the [+67.5/-67.5]2s lay-up. It
can clearly be seen that there is a difference in the transverse stress and strain. This is because the damage in the
transverse direction was not considered. Therefore, no stiffness reduction occurred and the stress rose higher than in the experiment. This will result in an over-estimation of composite stress. It can be concluded that consideration of the
coupling parameter is essential to ensure the accuracy of the intra-ply fracture analysis of composites.
Figure 13. Shear Stress-Strain Comparison of [+67.5/-67.5]2s Lay-up
with b3=0
Summary/Conclusions
1. The fracture model proposed by Ladeveze et al. adopts the idea of damage variables and stiffness degradation due to damage for the analysis of uni-directional continuous fiber laminate composites.
2. A process for deriving FEM parameters from coupon tests was presented, and it was demonstrated that valid parameters can be identified without FEM analysis. 3. It was confirmed that with the identified parameters, the
damage progression in cyclic loading tests can be reproduced.
4. The importance of damage coupling between the shear and transverse directions was discussed.
References
1. Abe, D., Urushiyama, Y., “Examination on Dynamic Bending Characteristics of a CFRP Beam Using a Progressive Fracture Model,” Transactions of the Society
Page 6 of 6
of Automotive Engineers of Japan, 20094570, 40(5):1139-1144, 2009.
2. Ladeveze, P., Le Dantec, E., “Damage modeling of the
elementary ply for laminated composites,” Composites Science and Technology 43:257-267, 1992.
3. Matzenmiller, A., Lubliner, J., Taylor, R.L., “A constitutive model for anisotropic damage in fiber-composite,” Mechanics of Materials 20: 125-152, 1995.
Contact Information
Tadashi NaitoHonda R&D Co., Ltd. Automobile R&D Center 4930 Shimotakanezawa, Haga-machi, Haga-gun, Tochigi 321-3393, Japan.

![Figure 12. Shear Stress-Strain Comparison of [+45/-45] 2s Lay-up with b 3 =0](https://thumb-eu.123doks.com/thumbv2/123doknet/6064773.152780/5.918.489.861.107.667/figure-shear-stress-strain-comparison-s-lay-b.webp)
