2010 Beacon Satellite Symposium P. Doherty and M. Hernandez-Pajares (Eds.) CIMNE, Barcelona, 2009
COMPARISON OF GPS-DERIVED VTEC OVER CYPRUS WITH
NEQUICK MODEL
HARIS HARALAMBOUS * AND BENOIT BIDAINE †
*
Frederick University, Nicosia, Cyprus e-mail: [email protected]
†
University of Liège - Geomatics, Belgium e-mail: [email protected]
Key words: Ionosphere, GNSS, Vertical Total Electron Content, electron density model. Summary. This paper presents a comparison of ionospheric vertical total electron content (vTEC) values evaluated from Nicosia (35.1 N, 33.4 E) ground-based GPS station in Cyprus and the corresponding predictions with the latest version of the NeQuick model during periods of low (2008), and high (2001) solar activity for different seasons. According to the study the NeQuick predictions generally underestimate vTEC values during high solar activity periods and overestimate vTEC values during low solar activity periods.
1 INTRODUCTION
The NeQuick model is the basis of the single frequency ionospheric correction algorithm that has been adopted in the framework of GALILEO and will be integrated into a global algorithm providing users with daily updated information to mitigate the ionospheric impact on navigation signals. It belongs to the "DGR family" of ionospheric models known as "profilers" (Di Giovanni et al. 1990,Radicella et al. 1995 )1,2 which fit analytical functions on a set of anchor points, namely the E, F1 and F2 layer peaks, to represent these principal ionospheric layers and compute the electron density profile. The model has been recently upgraded to a new version, including changes in the profile formulation, both in the bottom-side and topbottom-side ionosphere (Nava et al. 2008 )3. In the context of the present study we run the model using the monthly smoothed sunspot number R12 for each hour for the coordinates of Nicosia. We therefore obtained vTEC values which were compared to the corresponding derived median vTEC from GPS measurements (Ciraolo 2000 )4.
2 RESULTS
To investigate the typical behaviour of vTEC through a high and low solar activity periods we selected representative months of winter (January), summer (June), spring (March), and fall (September). GPS TEC was derived each hour and subsequently the median, the lower and upper deciles were computed to reveal the variability of the parameter in question. Figures 1 and 2 depict the diurnal profile of the computed statistical parameters of vTEC at high and low solar activity periods respectively.
Haris Haralambous and Benoit Bidaine
2
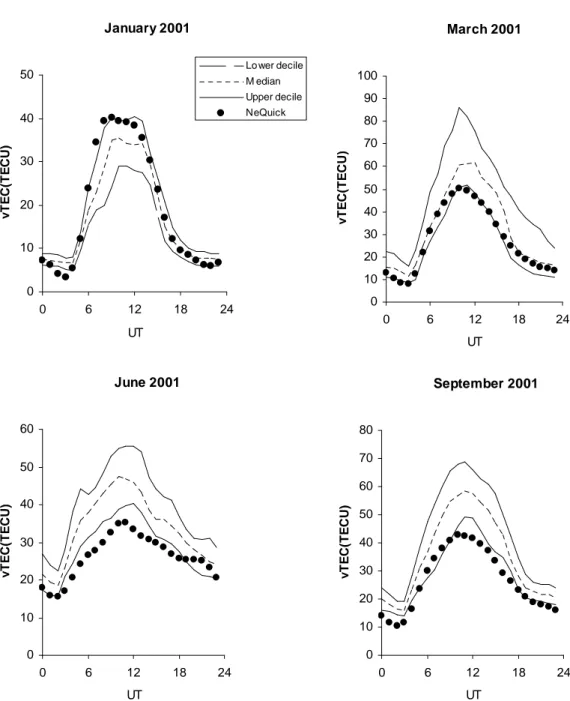
Figure 1: Median, lower and upper decile of GPS vTEC and NeQuick predictions of vTEC above Cyprus during a high solar activity period (2001).
It is evident from Figure 1 that NeQuick underestimates vTEC during high solar activity with the exception of winter (January). The diurnal vTEC profile values are particularly underestimated during the summer and fall periods. It is worth noting how closely the NeQuick diurnal profile approximates the lower decile profile during these periods and the upper decile profile for winter. The maximum difference between median and NeQuicik vTEC occurs around midday and the minimum around sunrise.
January 2001 0 10 20 30 40 50 0 6 12 18 24 UT v T E C (T E C U ) Lo wer decile M edian Upper decile NeQuick March 2001 0 10 20 30 40 50 60 70 80 90 100 0 6 12 18 24 UT v T E C (T E C U ) June 2001 0 10 20 30 40 50 60 0 6 12 18 24 UT v T E C (T E C U ) September 2001 0 10 20 30 40 50 60 70 80 0 6 12 18 24 UT v T E C (T E C U )
Haris Haralambous and Benoit Bidaine
3
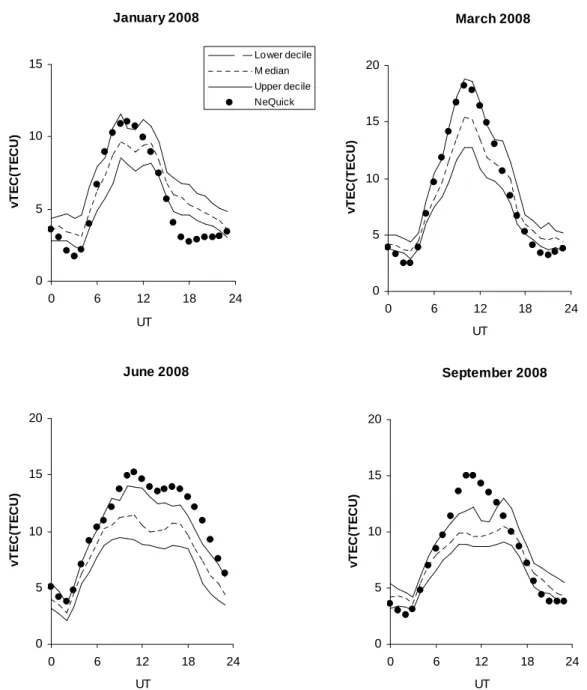
Figure 2: Median, lower and upper decile of GPS vTEC and NeQuick predictions of vTEC above Cyprus during a low solar activity period (2008).
.
As shown in Figure 2, NeQuick overestimates vTEC during low solar activity for all seasons. This overestimation is particularly noticeable during the summer (June) and less evident during the winter (January). The maximum difference between median and NeQuicik vTEC occurs (as in the high solar activity plots) around midday and the minimum around sunrise. The difference between model predictions and GPS derived vTEC is also increased during winter sunset.
January 2008 0 5 10 15 0 6 12 18 24 UT v T E C (T E C U ) Lo wer decile M edian Upper decile NeQuick March 2008 0 5 10 15 20 0 6 12 18 24 UT v T E C (T E C U ) June 2008 0 5 10 15 20 0 6 12 18 24 UT v T E C (T E C U ) September 2008 0 5 10 15 20 0 6 12 18 24 UT v T E C (T E C U )
Haris Haralambous and Benoit Bidaine
4 REFERENCES
[1] Di Giovanni, G., Radicella, S. M. An analytical model of the electron density profile in the ionosphere.Adv. Space Res., 1990, Vol. 10, No. 11, p. 27-30 (1990).
[2] Radicella, S. M., Zhang, M.-L. The improved DGR analytical model of electron density height profile and total electron content in the ionosphere. Ann. Geofis, 1995, Vol. XXXVIII, No. 1, p. 35-41(1995).
[3] B. Nava, P. Coïsson and S. M. Radicella, A new version of the NeQuick ionosphere electron density model,Journal of Atmospheric and Solar-Terrestrial Physics, Volume 70, Issue 15, December 2008, p. 1856-1862 (2008).
[4] Ciraolo, L.. Evaluation of GPS L2-L1 biases and related daily TEC profiles, Proceedings of the GPS/Ionosphere Workshop, Neustrelitz, 90-97 (1993).