COMPARISON OF DIFFERENT APPROACHES FOR LOD/LOQ : THE CASE OF
DIOXINS AND FURANS CONGENERS IN ANIMAL FEED SAMPLE
.
Gauthier Eppe, Guy Maghuin-Rogister and Edwin De Pauw
Center of Analysis of Residues in Traces (C.A.R.T), University of Liege, B6c Sart-Tilman, B-4000 Liege, Belgium
Introduction
Method validation is now a major concern for analysts and this is particularly true for trace analysis. Validation requires to evaluate numerous characteristics of the method and among these, detection and quantification limits (LOD/LOQ). These parameters are key issue for the determination of dioxin at sub-parts per trillion level in food and feed and especially since the European legislation introduced the concept of lowerbound and upperbound concentrations1. Recently, the UNEP POP workshop emphasized also the need of harmonized definitions of the detection limit and the way of reporting. Unfortunately, when the subject of LOD/LOQ is broached, definitions abound in the literature resulting in some confusion. There are several possible conceptual approaches and numerous ways to evaluate detection limits. In broad terms, the limit of detection is the smallest concentration level that can be determined statistically different from a blank at a specified level of confidence2. This corresponds to the critical value (LC) defined by Currie et al3 which is the term commonly used in analytical chemistry. The approach is based on hypothesis tests where two risks values α and β are defined as follows : α corresponds to the risk of detecting analyte although it is not present, also called a false positive. β corresponds to the risk of not detecting an analyte while it is present (false negative). At the LC level, only the decision of “detected” or “non detected” is made. The rate of false negative β is therefore of 50%. Instead of LOD, EPA preferred to use the term method detection limit (MDL) which is the minimum concentration of a substance that can be measured and reported at a level of confidence that the analyte concentration is greater than zero. It is determined from analysis of a sample in a given matrix containing the analyte. The MDL takes into account the whole analytical process. It’s important to distinguish it from the instrument detection limit (IDL) which is the smallest signal above background that an instrument can detect. IDL involves only one component of the analytical process. Keith et al2 also introduced the reliable detection limit (RDL) which is the concentration level at which a decision is extremely likely. This corresponds to the detection limits (LD) defined by Currie et al3 or the minimum detectable value (XD) defined by ISO 118434. LD, XD or RDL is established at a higher concentration where the risk of error β becomes acceptably low. For dioxin analysis, it is recommended to set α and β at 5%. Assuming a normal distribution of the data (assumption which is at least questionable at that level of concentration), LC ( MDL or LODkeith ) = 1.645 σB ( where α=5% and β= 50%) and LD (XD or RDL) = 3.29 σB ( where α=5% and β= 5%). σB being the standard deviation of the blank. This led, after rounding-off, at the famous definition of LD (or RDL) ≈ 3 σB.
The limit of quantification, frequently find also in the literature as limit of determination, is the smallest quantity or concentration that can be quantified with a given level of confidence. LOQ is different, and more difficult, than measuring the presence or absence of an analyte. It is an indicative value and it is sometimes defined at a precision level (as a percentage of RSD) arbitrarily fixed (Eurochem approach5). Keith et al2 recommended a LOQ ≈ 10 σB corresponding
Organohalogen Compounds, Volumes 60-65, Dioxin 2003 Boston, MA
to an uncertainty of ± 30% at the 99% level of confidence. Frequently, LOQ is also simply defined as a multiple of the LOD (usually by a factor between 2 and 3). For chromatographic techniques, the signal to noise ratio is still a method widespread.
Validation Guidelines are nowadays more focused on the ‘fitness for purpose’ and it is preferable to try to express the uncertainty of measurement as a function of concentration with criteria agreed by the laboratory and the end-user of the data.
More recently the European Commission laid down a decision of the commission 2002/657/EC6 regarding the performances of analytical methods and the interpretation of the results for residue analysis. Instead of LOD/LOQ, The concept of CCα and CCβ were introduced. CCα, the decision limit, is the limit at and above which it can be concluded with an error of probability of α that a sample is non-compliant. It can be compared to the critical value LC (α=5% and β= 50%). CCβ, the detection capability, is the smallest content of substance that may be detected with an error of probability β. This is comparable to the RDL or LD introduced previously (α=5% and β= 5%). Moreover, one interesting feature of the CCα and CCβ concept is that for substances for which permitted limits have been established, interpretation of the results in terms of compliance and non-compliance can be discussed. An overview of the different definitions introduced above is summarized graphically in figure 1 for PCDD/F congeners in animal feed sample. 0 0.1 0.2 0.3 0.4 0.5 0.6 0.7 0.8 0.9 1 1.1 -0.016 -0.006 0.004 0.014 0.024 0.034 0.044 0.054 0.064 0.074 0.084 ppt level (ng/kg) α=5% β=5% XD or LD DL RDL CCβ Xc or LC LODkeith MDL CCα XQ or LQ LOQ 1.64 σΒ 1.64 σD median LOD (see Table 1)
Figure 1 :graphical representation of LOD, MDL, LC,CCα, LD, RDL, DL, CCβ, LQ, XQ, LOQ. Based on the results of an interlaboratory study for dioxin analysis in animal feedingstuffs, the numerous approaches described above were evaluated and discussed. To clarify the paper, the terms LOD/LOQ used further in the text correspond to LD and LQ respectively (see figure 1).
Results and discussion
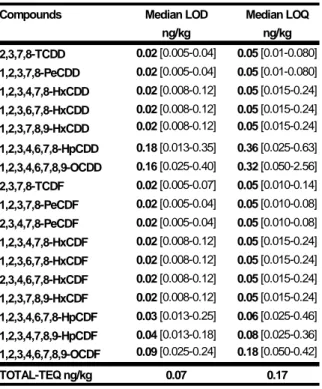
At dioxin 2002, Eppe et al7 presented the results of an interlaboratory study, grouping most of the SANCO experts laboratories, for dioxin analysis by HRMS in animal feedingstuffs. For this study, participants were asked to report their LOD and LOQ per congener. None information were collected on the way they calculated or evaluated them. It was decided to calculate the median values to represent one LOD and one LOQ per congener. Table 1 summarizes the median LOD/LOQ of the method for the PCDD and PCDF congeners. The range of LOD/LOQ reported by the laboratories is indicated in brackets. In general, for the less chlorinated congeners (tetra, penta and hexa-CDD/Fs), laboratories reported similar LOD/LOQ per congener. It has been therefore assumed that one LOD and one LOQ representing those congeners can be assessed (i.e. 0.02 ng/kg). On the other hand, the LOD/LOQ for the hepta-octa-CDD/Fs congeners were certainly penalized by their presence in blank sample and consequently higher values were
Organohalogen Compounds, Volumes 60-65, Dioxin 2003 Boston, MA
reported. The sum, expressed on TEQ, gives respectively 0.07 ng-TEQ/kg and 0.17 ng-TEQ/kg for LOD and LOQ. The directive 2002/70/EC8 specifies that the HRMS method should have a sum of LOQ on TEQ in the range of about one fifth of the maximum level allowed (i.e. 0.75 ng-TEQ/kg) in order to achieve acceptable CV at the level of interest. The values reported seem to be sufficiently low to comply with the criteria. Nevertheless, the results of the study were exploited using different approaches to make sure that those values are realistic.
Table 1 : Median LOD and median LOQ of the HRMS method for PCDD/F analysis in feed
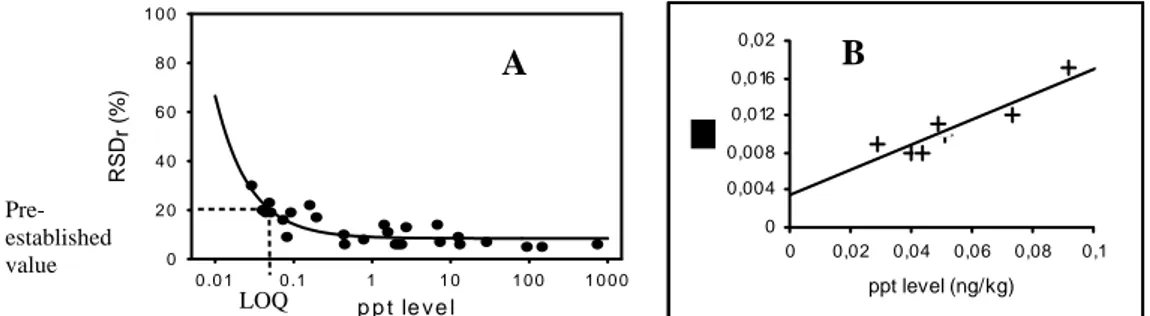
One of the main conclusions drawn from the study were, in this particular case, the performances of the HRMS method seem to be congener independent for the repeatability and the reproducibility over a range of concentration covering more than 4 orders of magnitude. The method loses precision below an individual concentration per congener of 0.1 ppt and at higher values tends asymptotically to a RSDr of 8.5% as shown in figure 2A [RSDr (%) = (0.58/level) + 8.5]. Each data point represented one of the 29 congeners (PCDD/Fs and dioxin-like PCBs) excepted for 2,3,7,8 TCDD for which the ISO 5725 procedure was not effective and 1,2,3,7,8,9 HxCDF for which too scarce results were reported. An interesting way to establish LOD is to use the calibration curve procedure according to ISO 118434 and 2002/657/EC6. In this case, it is strongly advised that levels are chosen in the range of LOD/LOQ. The procedure recommend to use blank samples matrix fortified at and above LOD/LOQ. To fortify animal feed solid matrix is not an easy task and problems of homogeneity can be encountered. However, the test material used during the collaborative study was naturally contaminated with PCDD/Fs and dioxin-like PCBs. Among the congeners, 7 PCDD/Fs (PeCDD, PeCDFs and HxCDFs) have consensus mean values below 0.1 ppt (see figure 2A). The information follow from the data in that range are extremely important. Figure 2B shows the linear dependency (SD= 0.0034+0.135*level) of the standard deviation (SDr) on the congener level, known as heteroscedasticity. The y-intercept represents the estimation of the standard deviation of the blank (σB=0.0034 ng/kg). The corresponding critical level LC is therefore equal to 1.645*σB = 0.0056 ng/kg at the 95% confidence level. The detection limit LD = 1.645*σB + 1.645*σD (where σD= σB + 0.135 LD). Thus LD = 4.23*σB= 0.0144 ng/kg at the 95% confidence level. This value can be compared to the median value of 0.02 ng/kg per congener (table 1) reported by the laboratories. Unfortunately, the standard deviation increases too sharply to estimate the LOQ by this approach. The results of the interlaboratory study showed, in this case, that the Eurachem3 approach, based on the lowest concentration of analyte that can be determined with an acceptable level of precision and trueness, is certainly the best way to evaluate the LOQ. Commonly a RSD of 10% is used in the chemical
Compounds Median LOD Median LOQ
ng/kg ng/kg 2,3,7,8-TCDD 0.02 [0.005-0.04] 0.05 [0.01-0.080] 1,2,3,7,8-PeCDD 0.02 [0.005-0.04] 0.05 [0.01-0.080] 1,2,3,4,7,8-HxCDD 0.02 [0.008-0.12] 0.05 [0.015-0.24] 1,2,3,6,7,8-HxCDD 0.02 [0.008-0.12] 0.05 [0.015-0.24] 1,2,3,7,8,9-HxCDD 0.02 [0.008-0.12] 0.05 [0.015-0.24] 1,2,3,4,6,7,8-HpCDD 0.18 [0.013-0.35] 0.36 [0.025-0.63] 1,2,3,4,6,7,8,9-OCDD 0.16 [0.025-0.40] 0.32 [0.050-2.56] 2,3,7,8-TCDF 0.02 [0.005-0.07] 0.05 [0.010-0.14] 1,2,3,7,8-PeCDF 0.02 [0.005-0.04] 0.05 [0.010-0.08] 2,3,4,7,8-PeCDF 0.02 [0.005-0.04] 0.05 [0.010-0.08] 1,2,3,4,7,8-HxCDF 0.02 [0.008-0.12] 0.05 [0.015-0.24] 1,2,3,6,7,8-HxCDF 0.02 [0.008-0.12] 0.05 [0.015-0.24] 2,3,4,6,7,8-HxCDF 0.02 [0.008-0.12] 0.05 [0.015-0.24] 1,2,3,7,8,9-HxCDF 0.02 [0.008-0.12] 0.05 [0.015-0.24] 1,2,3,4,6,7,8-HpCDF 0.03 [0.013-0.25] 0.06 [0.025-0.46] 1,2,3,4,7,8,9-HpCDF 0.04 [0.013-0.18] 0.08 [0.025-0.36] 1,2,3,4,6,7,8,9-OCDF 0.09 [0.025-0.24] 0.18 [0.050-0.42] TOTAL-TEQ ng/kg 0.07 0.17
Organohalogen Compounds, Volumes 60-65, Dioxin 2003 Boston, MA
literature. A pre-established value of 20% is certainly more realistic for dioxin analysis in feedingstuffs. A corresponding LOQ of 0.05 ng/kg per congener can thus be estimated (figure 2A). The value is also represented in figure 1 with its Gaussian distribution characterized by σQ.
p p t le v e l 0 .0 1 0 .1 1 1 0 1 0 0 1 0 0 0 RS Dr (%) 0 2 0 4 0 6 0 8 0 1 0 0 LOQ 0 0,004 0,008 0,012 0,016 0,02 0 0,02 0,04 0,06 0,08 0,1 ppt level (ng/kg)
B
A
Pre- established valueFigure 2 : (A) : RSDr (%) versus level of the PCDD/Fs and dioxin-like PCBs congeners.
(B): Linear dependency of the standard deviation on the PCDD/F congeners.
The signal to noise (S/N) approach is still widely used for chromatographic techniques. The S/N ratios were calculated using the results of the homogeneity test of the material. 14 tests portions were analyzed in repeatability conditions for PCDD/Fs. The S/N ratios were calculated for the 7 congeners below 0.1 ppt and the corresponding mean S/N values with their associated SD are graphically represented in figure 3. The regression line gives at a S/N ratio of 3 (generally defined as LOD) a level of 0.02 ng/kg. At LOQ (S/N ratio of 10) a corresponding level slightly below 0.06 ng/kg was found. 0 3 6 9 12 15 18 2 1 2 4 0.00 0.02 0.04 0.06 0.08 0.10 0.12 ppt level (ng/kg) S/N
Figure 3 : Mean S/N ratios (n=14) versus level in the range of between 0.03 and 0.1 ppt Conclusions
In this study, the different approaches used for LOD/LOQ gave comparable results. We proved that medians LOD/LOQ reported by laboratories are realistic and can certainly comply with the actual legislation. Nevertheless, laboratories should focused their efforts, in a near future, to achieve detection limits close to 0.01 ng/kg per congener and quantification limits close to 0.03 ng/kg per congener. Furthermore, there is clearly a need for harmonization of the definitions and the way to use them.
References
[1] JECFA recommendations. Joint FAO/WHO Expert Committee on Food Additive, 57th meeting, WHO Food Additives Series 48
[2] L.H Keith, Environmental sampling and analysis, a practical guide, CRC 1991. [3] L.A. Currie , IUPAC recommendation, Pure Appl. Chem. 67,1699-1723 (1995).
[4] ISO 11843, Capability of detection : part1 and part 2, International Standard Organisation, Geneva.
[5] Eurachem guide, The fitness for purpose of analytical methods. A laboratory guide to method validation and related topics, LGC, Teddington, 1998
[6] Commission Decision 2002/657/EC of 12 August 2002 Official Journal of the European Communities, 17.08.2002,L221/8-36. [7] G. Eppe and E De Pauw, organohalogen compounds, vol 59, 2002, 407-410.
[8] Commission Directive 2002/70/EC of 26 July 2002, Official Journal of the European Communities, 6.8.2002, 15-21.
Organohalogen Compounds, Volumes 60-65, Dioxin 2003 Boston, MA Organohalogen Compounds, Volume 60, Pages 99-102 (2003)