NAFEMS World Congress, June 2015, San Diego
COMPOSITE
STRUCTURES
OPTIMIZATION
INCLUDING NON-LINEAR ANALYSIS, DESIGN
AND MANUFACTURING CONSIDERATIONS
Prof. Dr. M. Bruyneel, Dr. P. Morelle (SAMTECH s.a., A Siemens Company, Belgium);
Ing. L. Hudson (Siemens PLM Software, Waltham);
Dr. S. Grihon (Airbus Civil Aircraft, France);
1. Introduction
Composite structure optimization is a very complicated task. Let’s consider the wing skin illustrated in Figure 1. The plies are laid down on the structure, defining zones of different thickness. Usually, conventional orientations are used (0°, 45°, -45°, 90° plies). In each zone the optimal stacking sequence must be defined. This sequence must satisfy some design rules.
Figure 1: Definition of the plies onto the wing structure
The usual design rules require that the laminate must be balanced (i.e. the number of plies at -45° is equal to the number of plies at 45°), the laminate must be symmetric, there must be no more than Nmax
are not local, and the ply continuity constraint across the zones must be taken into account in order to produce a composite structure with ply drops between the regions of different thickness that can be manufactured. Besides these considerations, accurate fibre trajectories, as for instance related to the fibre placement technique, should be considered in the design stage when the surfaces are non-developable, in order to take into account deviations and to provide a design as close as possible to the as-manufactured component. In this case, there is therefore a need for advanced draping simulations.
In this paper, we propose a solution taking into account these different aspects, relying on an accurate draping simulation with the Fibersim software, non-linear geometric and material structural analyses with SAMCEF, and non-linear optimization based on the algorithms available in the BOSS Quattro software. The approach is demonstrated on an academic application and on two industrial use cases. The first industrial application is from Airbus; since the considered surface is developable, a simple projection method is used in the CAE to get the local fibre orientation. In the second industrial application, a tail cone is studied; here, since it involves non-developable surfaces, it is used to demonstrate the full solution procedure including the advanced draping simulation in the CAD.
2. Structural optimization procedure
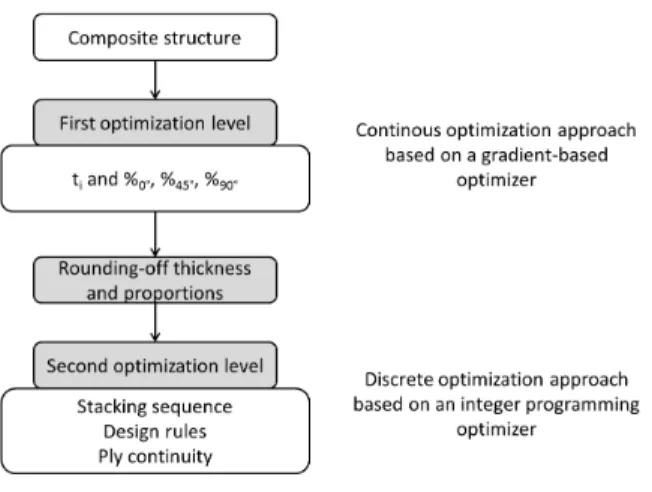
In this work, a bi-level solution procedure is proposed to solve the composite structure optimization problem.
As depicted in Figure 2, the first level addresses the optimization problem with a gradient-based optimizer and continuous design variables [1,2]. At that stage, the structure is divided in different regions, and the goal is to determine in each region the optimal thickness of the plies at 0°, 90°, and 45°, assuming that the laminate is balanced (the thickness of plies at -45 is identical to the thickness for the 45° orientation) and homogenized:
0 26 16 = A = A 12 2 t A Dij = ij Bij =0 (1) The optimization problem consists in minimizing the weight of the whole structure, with restrictions on the buckling load factors. These factors are determined with a linear buckling analysis (eigen-value problem).
COMPOSITE STRUCTURES OPTIMIZATION INCLUDING NON-LINEAR ANALYSIS, DESIGN AND MANUFACTURING
CONSIDERATIONS
Figure 2: The two-step optimization process
It is also possible to include a non-linear static analysis (based on the arc-length method) in the optimization loop, in order to control the collapse load. It was demonstrated in [2] that using such a non-linear analysis is beneficial for weight saving, as the stability behaviour of the structure is better represented compared to a solution where linear buckling only is considered. The optimization problem is given in (2), where n is the number of regions:
) ( min t t w λ λj(t)≥ j=1,...,m collapse collapse λ λ (t)≥ i i i t t t ≤ ≤ i=1,...,3n (2)
{
= = ° ° °}
= tθi ,i 1,...,n;θ 0 ,90 ,45 tIn (2), w is the structural weight to be minimized, λj is the jth buckling load, λcollapse is the collapse load, and t is the set of ply thicknesses, which must satisfy the side constraints. At the optimum, the buckling and collapse loads must be larger than the prescribed values λ and
collapse
λ , respectively.
Before entering step 2, a rounding-off is done, in order to translate the optimal thicknesses to an equivalent number of plies.
In step 2, a specific integer programming approach is used, together with a particular parameterization of the optimization problem. It determines in each region the optimal stacking sequence satisfying some design rules and the ply continuity constraint.
enumerating all the sequence candidates and checking for each one its admissibility. The main disadvantage of this method is that its computational cost grows exponentially with the number of plies. For example, for 16 plies there are 416= 4294967296 candidates to be checked and for N=32 plies there are 4^32 ~1.844×10¹⁹ possibilities. In this paper, the enumeration is based on a truncated tree, where branches satisfy the different design rules [3].
3. Academic application
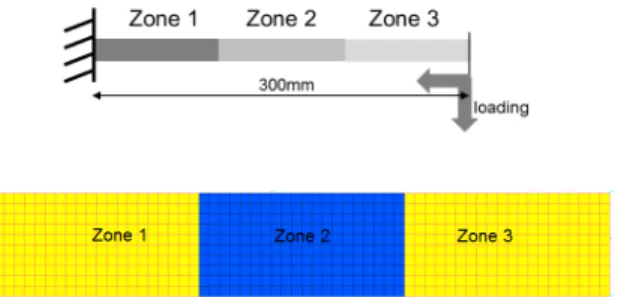
In this section, we consider the simple problem of a cantilever beam divided in 3 regions. The goal is to determine for the structure with a minimum weight the optimal stacking sequences in each region, while satisfying the design rules, the ply continuity constraint, as well as some mechanical restrictions on buckling, compliance and ply strength (Tsai-Wu criterion). The structure is submitted to compression and bending. The corresponding finite element mesh made of multi-layer shell elements, is depicted in Figure 3.
Figure 3: Description of the academic use case
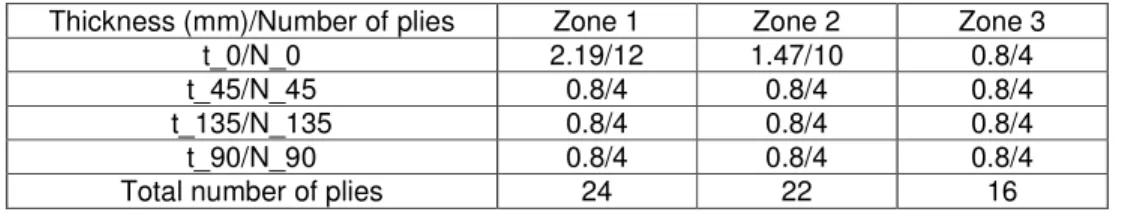
In the first step of the optimization problem, 3 design variables are defined in each zone, for a total of 9 design variables. The weight is minimized, and the first 20 buckling loads are required to be larger than 1.5, with an additional limitation on the displacement at the tip (stiffness constraint). The design variables take their value between 0.8mm and 4mm, and so all the orientations will be present at the solution, even if intuitively only 0° plies are relevant in the structure. The evolution of the weight and the buckling loads over the iterative process is illustrated in Figure 4. The optimal thicknesses and the corresponding number of plies in each region are reported in Table 1. It is assumed that the ply thickness is equal to 0.2mm. From the results, it is seen that there is a variation of the total thickness along the beam which is in agreement
COMPOSITE STRUCTURES OPTIMIZATION INCLUDING NON-LINEAR ANALYSIS, DESIGN AND MANUFACTURING
CONSIDERATIONS
with what was expected: larger thickness at the clamping zone, and lowest value at the tip. The thickness for the plies at 90°, 45° and -45° reaches its lower bound.
Figure 4: Convergence history for step 1
Thickness (mm)/Number of plies Zone 1 Zone 2 Zone 3
t_0/N_0 2.19/12 1.47/10 0.8/4
t_45/N_45 0.8/4 0.8/4 0.8/4
t_135/N_135 0.8/4 0.8/4 0.8/4
t_90/N_90 0.8/4 0.8/4 0.8/4
Total number of plies 24 22 16
Table 1: Solution of the first step optimization process.
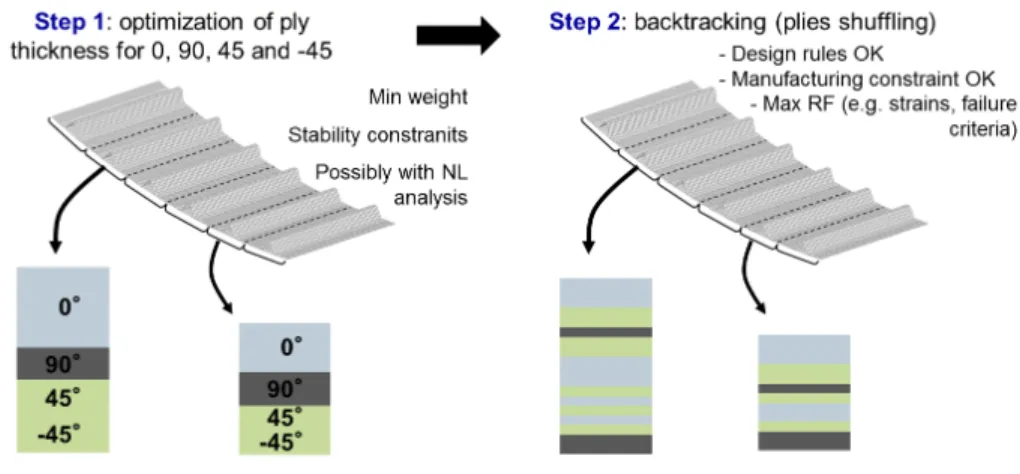
In the second step of the optimization process, some reserve factors are maximized. They impact the ply strength, the stiffness and the buckling loads. The weight is fixed, as determined in the first step (after the rounding-off of the continuous ply thicknesses). The sum of the reserve factors is maximized. It is checked that their value is larger than 1 at the solution. The initial lay-up for each region is illustrated in Figure 5. The laminate is symmetric, and the reference lay-up includes 24 plies. The pyramidal scheme is used for the stacking sequence table, and the initial orientations (in the first column) take initial arbitrary values in the set of conventional orientations. The goal of the optimization will be to permute the lines of the stacking sequence table, and determine for each line the optimal fibre orientation.
algorithm. At the solution, the Tsai-Wu criterion is satisfied in each ply, what was not the case in the initial design of Figure 5.
Figure 6: Optimal solution for step 2 4. First industrial application: Airbus use case
The structure depicted in Figure 7 is studied. It is a portion a curved composite fuselage, made of 6 super-stiffeners. Each super-stiffener is built with a portion of panel and its corresponding hat stiffener. The structure is submitted to shear and compression, and is then sensitive to geometrical instabilities. Figure 7 illustrates the application of the two-step optimization procedure. In the first two-step, the optimal proportions of plies at 0°, 90° and 45° is determined in each super-stiffener (panel and stiffeners). In the second step, the backtracking algorithm is used and the optimal stacking sequences are obtained (in the panels only).
COMPOSITE STRUCTURES OPTIMIZATION INCLUDING NON-LINEAR ANALYSIS, DESIGN AND MANUFACTURING
CONSIDERATIONS
In Figure 8, the convergence history for the step 1 is provided [2]. The weight is minimized, and constraints are defined on the buckling and collapse loads. For linear buckling, an eigen-value analysis is conducted, while a non-linear static analysis is run with the arc-length method to determine the full non-linear equilibrium path, including post-buckling and collapse. Semi-analytical sensitivies for linear and non-linear responses available in SAMCEF are used. The solution is obtained in 9 iterations, and the non-linear equilibrium path is tuned thanks to optimization, meaning that the prescribed values of the buckling and collapse loads are reached at the solution. The solution is translated to a discrete number of plies.
Figure 8: Solution of step 1: non-linear analysis in the optimization loop In step 2, the backtracking algorithm is used. The optimal stacking sequences satisfying the design rules and the ply continuity constraints are illustrated in Figure 9.
in 3 regions [4].
Figure 10: Second industrial application
Each region can have a different thickness. Here, only half the structure is studied. In each region, a simple projection method is used for the draping of the laminates during the optimization process. As the geometry is non developable, the fibre trajectories are not accurately represented by the projection method, which leads finally to some theoretical fibres orientations. Specific draping methods, like the ones available in Fibersim, are used to provide more accurate fibres trajectories and deviations, as illustrated in Figure 11.
Figure 11: Comparison between the projection method and the Fibersim advanced draping method
It is indeed essential to deal with a correct representation of the local fibre orientation, seeing the big influence this information has on the
COMPOSITE STRUCTURES OPTIMIZATION INCLUDING NON-LINEAR ANALYSIS, DESIGN AND MANUFACTURING
CONSIDERATIONS
stiffness and strength of the composite structure. For this application, the two-step optimization process is used, as described in the previous sections, with the projection draping method. The results of the first step are provided in Figure 12. The second optimization step is then applied, in order to determine the optimal stacking sequence satisfying the design rules and the ply continuity constraints.
Figure 12: Results of the first step
The optimal solution obtained with this solution procedure based on the simple projection method is then corrected using Fibersim, as depicted in Figures 11 and 13, in order to get accurate fibre orientations, based on the previous optimal solution.
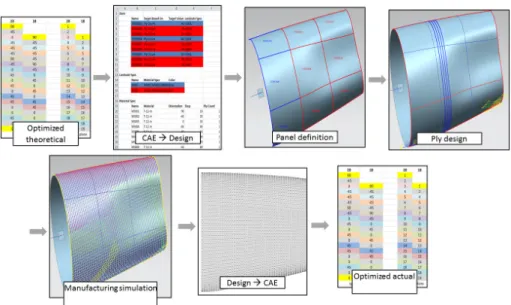
Figure 13: CAE -> CAD -> CAE for the corrected fibre orientation Finally, a non-linear analysis addressing the damage tolerance of the composite structure is conducted on the final optimized design of Figure 13. The shell model is locally replaced by solid elements, and cohesive
Figure 14: Results of the validation non-linear analysis and occurrence of delamination
6. Conclusions
A two-step optimization procedure for composite structures optimization was presented. It is based on the chaining of a continuous optimization step and a specific integer programming approach. It provides, in each region of the structure, optimal stacking sequences satisfying the design rules, and a solution that can be manufactured. It was shown how the optimal sizing can deal with the definition of accurate fiber orientations from the CAD phase. The methodology was demonstrated on academic and industrial use cases.
7. References
[1] M. Bruyneel (2006). A general and effective approach for the optimal design of fiber reinforced composite structures, Compos Sci Technol, 66, pp 1303–1314.
[2] M. Bruyneel, B. Colson, JP Delsemme, P. Jetteur, S. Grihon and A. Remouchamps (2010). Exploiting semi-analytical sensitivities from linear and non-linear finite element analyses for composite panel optimisation. Int. J. of Struct. Stability & Dynamics, 10(4), pp 885-903. [3] Zein S. and Bruyneel M. (2012). "A primal-dual backtracking optimization method for blended composite structures", 15th European Conference on Composite Materials ECCM15, June 24-28, 2012, Venice, Italy.
[4] L. Hudson and M. Bruyneel (2014). Reducing overdesign with predictive performance and producibility simulation of composite structures, 2014 ASC 29/US-Japan 16 ASTM D30 Conference, September 2014, UC, San Diego, USA.