article (e.g. in Word or Tex form) to their personal website or
institutional repository. Authors requiring further information
regarding Elsevier’s archiving and manuscript policies are
encouraged to visit:
Reproduction of European eel jeopardised by high levels of dioxins and
dioxin-like PCBs?
C. Geeraerts
a,⁎
, J.-F. Focant
b, G. Eppe
b, E. De Pauw
b, C. Belpaire
caResearch Institute for Nature and Forest (INBO), Gaverstraat 4, B-9500 Geraardsbergen, Belgium
bCART Mass Spectrometry Laboratory, Chemistry Department, University of Liège, Allée de la Chimie 3, B-6c Sart-Tilman, B-4000 Liège, Belgium c
Research Institute for Nature and Forest (INBO), Duboislaan 14, B-1560 Groenendaal-Hoeilaart, Belgium
a b s t r a c t
a r t i c l e i n f o
Article history: Received 15 March 2011
Received in revised form 25 May 2011 Accepted 26 May 2011
Available online 28 June 2011 Keywords:
Dioxins Furans
Dioxin-like polychlorinated biphenyls Human intake
Anguilla anguilla
Dioxins, furans and dioxin-like polychlorinated biphenyls (PCBs) were analysed in muscle tissue from yellow phased European eel (Anguilla anguilla) from 38 sites in Belgium. Dioxin concentrations in eel vary considerably between sampling locations, indicating that yellow eel is a good indicator of local pollution levels. Measured levels of dioxin-like PCBs are much higher than those of the dioxins and furans. In the majority of the sites, eel has levels considered to be detrimental for their reproduction. Field levels of dioxin and dioxin-like PCBs are therefore suggested as an additional causal factor contributing to the decline of the European eel. 42% of the sampling sites show especially dioxin-like PCB levels exceeding the European consumption level (with a factor 3 on average). Human consumption of eel, especially in these highly contaminated sites, seems unjustified.
© 2011 Elsevier B.V. All rights reserved.
1. Introduction
Polychlorinated dibenzo-p-dioxins (PCDDs), and polychlorinated dibenzofurans (PCDFs) are highly toxic persistent environmental contaminants, which influence the health and reproductive success of many species, including freshwaterfish and eel (Palstra et al., 2006). PCDDs, PCDFs, and dioxin-like PCBs (DL-PCBs) have comparable chemical structures and toxicological characteristics. PCB mixtures have been used for a variety of applications largely based on their chemical stability and physical properties (Bhavsar et al., 2007).De
Boer et al. (1994, 2010)demonstrated that elimination half-lives of
PCBs are in the order of years. They found half-lives of some organochlorine pesticides and tri-pentachlorobiphenyls to be ca. 300–1500 days, whereas for hexa-octachlorinated biphenyls no apparent elimination was found. Their stability is also responsible for their continued presence in the environment, even decades after extensive regulatory actions and an effective ban from the EU in 1985. Although, long time series of PCB monitoring in eel illustrate a decreasing trend, these series clearly show that PCBs are still ubiquitous in our aquatic ecosystems (De Boer et al., 1994; Maes et
al., 2008). The situation is similar for dioxins, furans and DL-PCBs. The
half-lives of 2,3,7,8-substituted tetrachlorinated dibenzo-p-dioxin (2,3,7,8-TetraCDD) in rodents, for example, is usually 2–4 weeks but
in humans it has been estimated to be 7–11 years, although, with wide individual variation. The half-lives of other PCDD/Fs may vary between six months and 20 years (Srogi, 2008). DL-PCBs are a group of 12 PCBs that share a common toxic mechanism, with the most toxic dioxin compound 2,3,7,8-TetraCDD and, generally are among the most toxic PCB congeners as they incur toxic effects at relatively lower concentrations than those of non-DL-PCBs (NDL-PCBs) (Giesy and
Kannan, 1998; McFarland and Clarke, 1989). Environmental hazards
associated with the DL-PCBs are generally assessed separately from the NDL-PCBs.
Recent studies pointed out that PCBs and other dioxin-like chemicals play an important role in the actual decline of the European eel (Belpaire et al., 2009, 2011; Geeraerts and Belpaire, 2010; Palstra
et al., 2006; Van Ginneken et al., 2009), although causative
relation-ships between PCB exposure and effects on population level are difficult to demonstrate, considering the complex life cycle of this panmictic catadromous species. Palstra et al. (2006) artificially stimulated female and male silver eel to maturation and reproduction and studied the effects of dioxin-like compounds in muscle and gonad tissues on embryonic development. They reported large differences in embryonic development of eel eggs. The observed correlation between embryo survival time and 2,3,7,8-TetraCDD toxic equivalent (TEQ) levels (EC, 2006) in the gonads implied TEQ-induced teratogenic effects. The disrupting effects occurred at levels below 4 ng TEQ kg− 1 gonad, which is below the EU eel consumption standard.
Eel is particularly prone to bioaccumulating hazardous substances (such as polychlorinated biphenyls (PCBs;Belpaire et al., 2011; Maes
⁎ Corresponding author. Tel.: +32 54 43 71 36; fax: +32 54 43 61 60. E-mail addresses:caroline.geeraerts@inbo.be(C. Geeraerts),JF.Focant@ulg.ac.be
(J.-F. Focant),G.Eppe@ulg.ac.be(G. Eppe),E.DePauw@ulg.ac.be(E. De Pauw),
claude.belpaire@inbo.be(C. Belpaire).
0048-9697/$– see front matter © 2011 Elsevier B.V. All rights reserved. doi:10.1016/j.scitotenv.2011.05.046
Contents lists available atScienceDirect
Science of the Total Environment
yellow eel phase (Belpaire and Goemans, 2007; De Boer and Hagel, 1994). Moreover, the eel is a popular human food in many European countries, and therefore represents a potential health hazard to consumers.
In order to gain insight in the current status of pollution by dioxins and related compounds in Flanders– the northern part of Belgium – a baseline spatial analysis was conducted in yellow eel from different Flemish locations. Spatial variation in the level of dioxin pollution might indicate areas of concern for these substances. We anticipate that the levels in eel might be of toxicological relevance, potentially causing effects on the eel and putting additional pressure on the state of the already imperilled eel stock. Results also may indicate if the current dioxin concentrations in Belgian wild eel exceed the international food safety standards.
closed water bodies (n = 6). To avoid effects of possible variation in body burden of individual eel from a particular site due to variation in size, sex or age, we aimed to analyse pooled samples from 10 individuals per site. But, this objective could not be met at all sites due to low abundances. On each locality 4–10 yellow eel were captured and live transported to the laboratory. Again low abundances did not allow sampling for a standardised eel length, so eel were of variable length (range 33.9–64.1 cm) and weight range (59.7–566.4 g). At the lab,fish were measured, weighed, skinned and samples of muscle tissue (10 g fresh weight each) were removed, labelled and stored at −20 °C. From each sampling location, tissues from individual eel were pooled prior to homogenisation and analysis (5.0 g).
All samples were processed in our ISO17025 BELAC accredited laboratory successfully participating in relevant inter-calibration
Table 1
Overview of the pool samples with the description of the sampling sites and year, number of eel in the sample (N) and mean parameters of eel (mean length (LM), mean weight (WM) and the muscle lipid content of the pooled sample (Fat%)). For each sample the absolute dioxin concentrations (ΣPCDD/Fs), the sum of dioxin-like PCB concentration (ΣDL-PCBs), the sum of both (ΣPCDD/F+DL-PCBs) expressed as pg g− 1fresh weight, and the body burden (ng g− 1fresh weight) are given. Minimum, maximum, mean, standard
deviation (SD) and median are also given. NA = not available. Site code Water body Water course
type Sampling year N LM (cm) WM (g) Fat% ΣPCDD/Fs ΣDL-PCBs ΣDL-PCBs+ PCDD/Fs Body burden ΣPCDD/F+DL PCBs KND Canal Nieuwpoort-Duinkerke Canal 2005 10 39.
4 133. 0 11. 6 1. 7 9879. 5 9881. 2 1314. 2 KNN Creek of Nieuwendamme Polder 2002 5 35.3 77.8 10. 2.4 5384.6 5387.0 419.1 YZ Yser River 2000 5 43.2 201.7 15.6 5.2 29,960.3 29,965.5 6044.0 IK Iepercanal Canal 2002 10 37.4 93.7 10.6 2.0 11,426.3 11,428.4 1070.8 HV Handzamevaart Polder 2002 10 33.9 59.7 0.7 110.5 18,089.9 18,200.4 1086.6 LE Leie River 2001 6 56.5 466.1 3.2 10.4 45,917.4 45,927.7 21,406.9 BBV Blankenbergse Vaart Polder 2003 10 37.2 99.7 9.2 2.1 2418.9 2421.0 241.4 BK Boudewijncanal Canal 2006 4 64.1 566.4 7.8 2.4 25,027.0 25,029.3 14,176.6 DAV Damse vaart Canal 2006 9 39.9 109.0 17.6 14.0 53,743.2 53,757.2 5859.5 DGH Gavers Closed waterbody 2000 5 60.5 388.3 16.4 7.6 40,387.9 40,395.5 15,685.6 LEO Leopoldcanal Canal 2003 9 36.3 78.0 7.9 2.2 5101.2 5103.4 398.1 KGO Canal Ghent-Oostend Canal 2004 6 40.6 126.0 6.9 8.0 41,696.1 41,704.1 5254.7 BGG Oude Leie Bourgoyen Closed waterbody 2000 10 39.0 96.0 14.3 5.1 38,051.7 38,056.8 3653.5 DE1 Dender River 2006 7 53.5 253.5 4.8 1.7 8600.4 8602.1 2180.6 DE2 Dender River 2006 9 49.6 202.8 3.6 1.5 20,098.5 20,100.0 4076.3 DE3 Dender River 2002 8 42.1 141.3 10.6 4.3 48,447.0 48,451.3 6846.2 ODU Oude Durme Closed waterbody 2002 5 38.6 99.6 8.9 3.6 17,643.3 17,646.9 1757.6 KZ Klein Zuunbekken Closed waterbody 2002 5 39.6 107.0 15.0 7.1 87,641.2 87,648.3 9378.4 WBV1 Willebroekse vaart Canal 2002 10 36.3 84.8 12.3 5.2 107,734.9 107,740.1 9136.4 WBV2 Willebroekse vaart Canal 2002 5 39.7 103.1 10.1 3.7 113,685.9 113,689.6 11,721.4 KDS1 Canal Dessel-Schoten Canal 2003 10 48.1 181.9 10.6 6.5 124,752.3 124,758.8 22,693.6 KDS2 Canal Dessel-Schoten Canal 2003 10 40.4 126.0 2.3 1.8 23,399.3 23,401.1 2948.5 DIJ Dijle River 2006 3 52.1 296.6 27.4 6.1 19,682.0 196,88.2 5839.5 KN Kleine Nete River 2003 10 40.4 110.1 11.7 3.6 13,157.8 1,3161.4 1449.1 RM Rotselaar lake Closed waterbody 2007 10 37.9 94.9 3.7 1.1 3036.1 3037.1 288.2 KBH1 Canal Bocholt-Herentals Canal 2002 5 41.3 115.1 10.2 7.9 264,843.7 264,851.5 30,484.4 DEM Demer River 2003 3 50.6 308.0 4.8 1.6 6745.2 6746.8 2078.0 COM Congovaart Canal 2001 5 43.2 162.3 10.6 10.3 409,151.8 409,162.0 66,407.0 GN Grote Nete River 2000 7 39.4 101.2 13.4 4.6 9097.4 9101.9 921.1 KB1 Canal of Beverlo Canal 2005 5 41.2 110.1 3.6 1.6 5428.1 5429.7 597.8 KB2 Canal of Beverlo Canal 2005 10 49.9 244.3 7.9 5.6 33,628.3 33,633.9 8216.8 DO Dommel River 2006 9 43.1 154.2 7.1 2.1 4940.6 4942.8 762.2 AK Albertcanal Canal 2000 8 45.2 157.8 12.7 10.0 110,113.9 110,123.9 17,377.6 KBH2 Canal Bocholt-Herentals Canal 2002 10 40.4 110.5 3.1 2.1 35,390.6 35,392.7 3910.9 IB Itterbeek River 2005 9 38.3 109.3 5.5 1.8 3031.2 3033.0 331.5 AB Abeek River 2004 6 42.1 116.5 4.4 1.5 13,689.1 13,690.6 1595.0 OMS Old Meuse Closed waterbody 2002 10 40.9 109.5 1.7 31.7 NA NA NA MA Grensmaas River 2002 10 44.6 159.4 6.5 2.7 45,061.3 45,064.0 7183.2 Minimum 2000 3 33.9 59.7 0.7 1.1 2,418.9 2,421.0 241.4 Maximum 2007 10 64.1 566.4 27.4 110.5 409,151.8 409,162.0 66,407.0 Mean 43.2 164.6 9.1 8.0 48,859.0 48,867.0 7,759.4 SD 6.9 110.5 5.3 17.9 78,453.9 78,454.0 12,145.6 Median 40.8 115.8 9.1 3.7 21,748.9 21,750.6 3,782.2
exercises on a regular basis. All samples were homogenised using dissecting and mortar equipment and frozen in liquid nitrogen before freeze-drying prior extraction. Freeze-dried homogenised samples were mixed with sodium sulphate and extracted twice with 20 ml of hexane at a pressure of 1500 psi. Extractions were carried out using pressurised liquid extraction (PLE) with either a PLE-6 system (Fluid Management Systems Inc, Boston, MA, USA) or an ASE 300 extractor (Dionex, Sunnyvale, CA, USA). The fat extracts were dried on sodium sulphate. The fat was redissolved in 50 ml of hexane before further clean-up. All samples were spiked with internal isotope dilution standards prior to extraction. All details regarding the use of standard solutions are available in a previous report (Focant et al., 2005). The first step of sample clean-up was a multilayer silica gel column in a disposable glass column plugged with glass wool. From bottom to top, it contained 5 g of sodium sulphate, 5 g of silica gel, 20 g of 44% sulphuric acid silica gel, and 20 g of 22% sulphuric acid silica gel. It was washed with 150 ml of hexane before use. The fat sample was applied on the column and eluted by 150 ml of hexane. The volume of the eluate was reduced to 20 ml before the next step. Further sample clean-up was achieved using an automated system (Power-Prep™, Fluid Management Systems Inc.) (Focant et al., 2001, 2004). In order to ensure high quality standard performance of the methods, matrix specific QC samples were monitored. The PCDD/F TEQs and DL-PCB TEQs of those QC samples were calculated and plotted against reference values obtained from validation replicates. Both instrumen-tal and procedural blanks (BCs) were also monitored. Sensitivity check of the instrument was carried out on a daily basis.
Measurements of mono-ortho (MO)-PCBs and NDL-PCBs were carried out on a MAT95, a XL high resolution sector instrument (HRMS) (ThermoFinniganMAT, Bremen, Germany), connected to an Agilent 6890 Series (Palo Alto, CA, USA) gas chromatograph equipped with a A200S autosampler (Thermo). The column was an HT-8 (25 m×0.22 mm ID×0.25μm df) (SGE, Villebon, France). The HRMS instrument was operated in selected ion monitoring (SIM) mode. A complete calibration was carried out every month (200 unknown samples) and instrumental blanks were measured for every series of samples. Additional GC and HRMS parameters were described previously (Focant et al., 2006). Measurements of PCDDs, PCDFs, and non-ortho (NO)-PCBs were carried out on an Autospec Ultima HRMS (Micromass, Manchester, United Kingdom) connected to an Agilent 6890 Series (Palo Alto, CA, USA) gas chromatograph equipped with a A200SE autosampler. The column was a VF-5MS (50 m×0.2 mm ID×0.33μm df) (Varian Inc., Sint-Katelijne-Waver, Belgium). The HRMS instrument was operated in selected ion monitoring (SIM) mode. A complete calibration was carried out twice a month (100 unknown samples) and instrumental blanks were measured for every series of samples. Additional GC and HRMS parameters were described previously (Focant et al., 2006).
In muscle tissue of all pool samples 17 PCDD/Fs and 12 DL-PCBs were analysed: Hepta-chlorodibenzodioxin (CDD), 1,2,3,4,6,7,8-Hepta-chlorodibenzofuran (CDF), 1,2,3,4,7,8,9-HeptaCDF, 1,2,3,4,7,8-HexaCDD, 1,2,3,4,7,8-HexaCDF, 1,2,3,6,7,8-1,2,3,4,7,8-HexaCDD, 1,2,3,6,7,8-Hex-aCDF, 1,2,3,7,8,9-HexaCDD, 1,2,3,7,8,9-Hex1,2,3,6,7,8-Hex-aCDF, 1,2,3,7,8-PentaCDD, 1,PentaCDF, 2,3,4,6,7,8-HexaCDF, 2,3,4,7,8-PentaCDF, 2,3,7,8-TetraCDD, 2,3,7,8-TetraCDF, octochlorodubenzodioxins (OCDD) and K N D K N N HV IK LE DGH B B V LEO DAV B K K G O B G G ODU DE3 DE2 DE1 K Z WBV1 WBV2 K D S 2 K N DIJ R M DEM AK OMS MA AB IB1 K B H1 DO K B1 K B 2 C O M K B H2 G N K D S 1 Y Z 6°0'0"E 6°0'0"E 5°0'0"E 5°0'0"E 4°0'0"E 4°0'0"E 3°0'0"E 3°0'0"E 51°0'0"N 51°0'0"N 1 0 55 10 Km
Flanders
Sum DL-PC
(pg g-1 fresh weight)
< 10,000 10,000- 25,000 25,000- 50,000 50,000- 125,000 > 125,000N
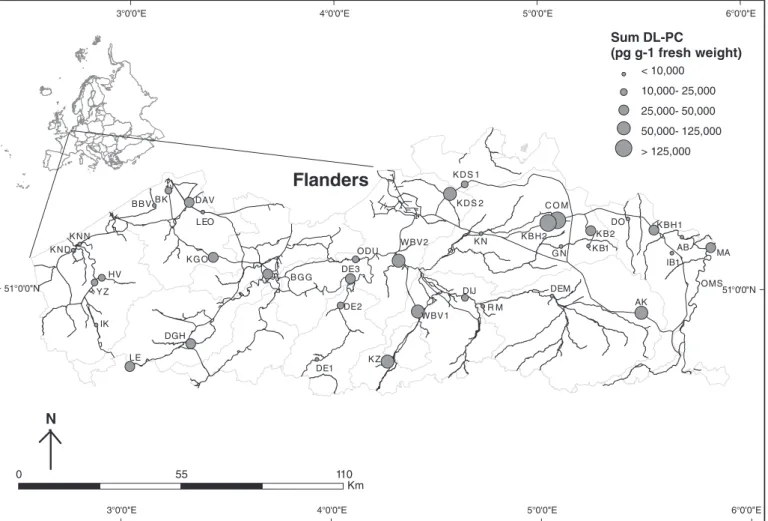
Fig. 1. Geographic position of Flanders in Europe and spatial distribution of the 38 studied sampling sites. Levels of DL-PCBs (pg g− 1fresh weight) in pooled samples of yellow eel collected between 2000 and 2007 are shown. The OMS sample has been excluded from thefigure because of non available MO-PCB data.
PCB 118, PCB 138, PCB 153, and PCB 180).
Results are expressed as pg g− 1fresh weight for spatial analyses. To estimate health risks from human consumption and effects on eel, results are expressed in pg WHO1998TEQ g− 1(lower bound) on fresh
weight basis. Individual dioxins, furans and DL-PCBs have substantial variation in toxicity, and toxicity equivalence factors (TEFs) have been assigned to each congener deduced from a combination of unweighted distribution of in vivo and in vitro relative effect potency distributions, expert judgment, and point estimates (Van den Berg et
al., 2006). Toxicity may be different dependent of the species, so, it
would be appropriate to use specific eel-TEFs, however to date these are not available. In the eel related literature, mostly TEQ-based values are given, rather than absolute concentrations. However, great care must be taken when comparing literature data on TEQ values between authors, as they are time bounded. Measurements below limits of quantification (LOQ) were treated as half the LOQ value of the congener considered. LOQ values are given in Tables 1, 2, and SI-3 on a congener and sample basis.
A Spearman correlation analysis of the congener PCB 126 with the ΣDL-PCBs is done with the statistical software R (R Development Core
Team, 2010).
3. Results and discussion 3.1. Levels
Table 1gives an overview of the sites, the biometric characteristics
and the absolute concentrations of the sum of 17 dioxins and furans (ΣPCDD/Fs), the sum of 12 DL-PCBs (ΣDL-PCBs) and the total sum of dioxins, furans and DL-PCBs (ΣPCDD/Fs+ΣDL-PCBs) of the pooled samples of eel for each site. Levels of individual compounds per site are presented in Supporting Information Tables SI-1, SI-2 and SI-3. This study is basically designed as a spatial analysis of contaminant levels in Flanders at a certain time, although one has to consider that the sampling period spans a rather extended period (2000–2007). During these eight years, changes in pollution pressure might have occurred. Another weakness is the quite large variation in mean length of the eel (33.9–64.1 cm) which might — to some extent have biased the results, as longer eel are older and contaminant and lipid levels are expected to increase with age. Mean lipid levels from our samples varied between 0.7 and 27.4% (mean 9.1%), indicating a large variation in fat content between (Belgian) sites which also was reported byBelpaire et al. (2009); and may be linked to variations in environmental conditions (temperature and salinity,Andersson et al., 1991),fish assemblages, eel density (Svedäng and Wickström, 1997), water typology (Piatek, 1970), or trophic status (Svedäng et al., 1996) or pollution (Geeraerts and Belpaire, 2010). In one much polluted site (Handzamevaart, HV) the pooled eel muscle sample had an extreme low lipid level (0.7%), suggesting an impact of PCDD/Fs on the fat levels. Overall, with more than half of the (pooled) samples having muscle lipid levelsb10% energetic condition of the eel is regarded as very low. Only one sample had a lipid level above 20%. Reported lipid levels concern yellow eel but, assuming that they are indicative of those in silver eel, migration and successful reproduction is jeopardised as 20% fat is the minimum limit required (Belpaire
et al., 2009).
To easily compare concentrations from our study with literature, WHO1998TEQ values are used as most eel related literature is reported
in TEQ values. Concentrations of dioxins and furans (ΣPCDD/Fs) in the current study, vary between 0.2 (Rotselaar lake, RM) and 9.8 pg WHO1998TEQ g− 1 (Handzamevaart, HV; mean 1.2). This is
2010) and higher concentrations are noted in the Grenland Fjords in southern Norway (5–23 pg WHO TEQ g− 1;Knutzen et al., 2003), and
in the Elbe River and its tributaries (0.5 to 22 pg WHO1998TEQ g− 1;
Stachel et al., 2007). The European maximum consumption level for
PCDD/Fs (4 pg WHO1998TEQ g− 1fresh weight) is exceeded at 2.6% of
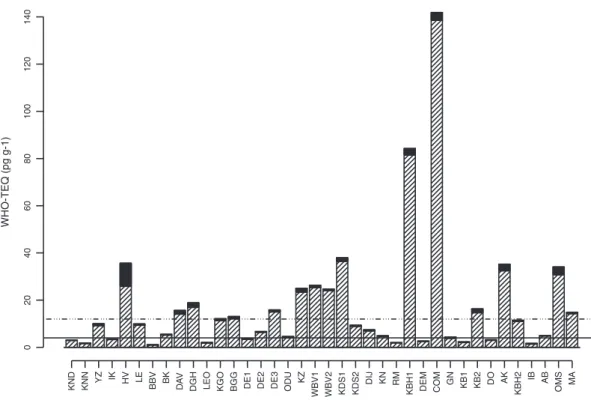
the sampled locations (Fig. 2). TEQ values forΣDL-PCBs lie in the range of 1 (Blankenbergse Vaart, BBV) to 139 pg WHO1998TEQ g− 1
fresh weight (Congovaart, COM) (mean 16.2) and, are about 15 times higher thanΣPCDD/Fs (Fig. 2). Compared to the countries mentioned above, Belgian eel are most polluted with DL-PCBs. On average, the TEQ values for the four NO-PCBs are about 47% of the total TEQ (ΣPCDD/Fs+ΣDL-PCBs), so are the eight MO-PCB TEQ values with 47%. The PCDD/Fs-TEQ only contributes 6% to the total TEQ.
DL-PCBs accounted for the highest percentage (mean 91%, range 72.5–97.7%) to the total-TEQ value, regardless of the sampling site. In the Congovaart, the contribution of DL-PCBs to the total-TEQ is as high as 97% while the lowest contribution is found in the Handzamevaart with 72.5%. This is in agreement with results from German eel
(Stachel et al., 2007) and, with data from the UK, which showed that
for all type of fish – wild, farmed or processed – the major contribution to the total-TEQ can be attributed to PCBs (Fernandes
et al., 2009). But, the percentage is high, compared to results from a
Swedish study by Ankarberg et al. (2004) who found PCB levels ranging from 31 to 86% of the total-TEQ value in eel, salmon (Salmo salar), brown trout (Salmo trutta), whitefish (Coregonus lavaretus), herring (Clupea harengus), sprat (Sprattus sprattus), cod (Gadus morhua callarias) and vendace (roe) (from Coregonus albula) from several locations in the Baltic Sea. DL-PCBs also were the most important contributors to total-TEQ (60% and 84%, respectively) in edible fish species in Catalonia (Spain; Bocio et al., 2007). In our study, concentrations of DL-PCBs are high (1–139 pg WHO1998TEQ g−1)
com-pared to other European studies. In a Polish study, concentrations in the lagoons ranged from 1.6 to 7.1 pg WHO1998TEQ g−1(Szlinder-Richert
et al., 2010), while in eel from the Elbe River and its tributaries these
concentrations ranged between 8.5 and 59 pg WHO1998TEQ g−1(Stachel
et al., 2007) and, 28 eel samples from the Western Baltic Sea, sampled
between 2005 and 2006, ranged from 1 to 15.3 pg WHO1998TEQ g−1
(Karl et al., 2010).
Due to its high toxicity, the DL-PCB congener 126 contributes most to the TEQ-ΣDL-PCBs (mean 52%) in all samples, with also notable contributions of PCB 156 (mean 18%) and PCB 118 (mean 16%). The correlation between congener PCB 126 and theΣDL-PCBs is strong (Spearman, r = 0.97, p = 0) and consistent over the sites. Results from fattyfish in Sweden, also showed a dominant contribution of PCB 126 to the TEQ-ΣDL-PCBs with 71% on average (range 53–81%,Ankarberg
et al., 2004). A French study in several wild and cultured marine and
freshwater species linked up with this (Cariou et al., 2010). In eel from the Camargue (France), on the other hand, the congeners PCB 126 and PCB 169 were not detected, as reported byOliveiro Ribeiro et al.
(2007). Further,Szlinder-Richert et al. (2010)reported the
contribu-tion of NO-PCBs in total toxicity (TEQ values) as the highest. PCB 126 also predominated and its share to the sum of the NO-PCB TEQ oncentration was 70–80%. Results from 14 fish and seafood species widely consumed by the population of Catalonia, showed PCBs 138 and 153 being the dominant congeners (Bocio et al., 2007). Overall, DL-PCB TEQ concentrations were under the EU maximum permissible level (Bocio et al., 2007).
In this study the levels ofΣPCDD/Fs+ΣDL-PCBs varied between 1.1 and 141.9 pg WHO1998TEQ g− 1 (mean 17.4). The highest
con-centration was found in eel from the Congovaart (Table 1,Fig. 1). Generally, in 42% of the sites the maximum consumption limit
(12 pg WHO1998TEQ g− 1fresh weight forΣPCDD/Fs+ΣDL-PCBs) is
exceeded. Total-TEQ concentrations are even higher compared to levels in eel from the coastline of the Western Baltic Sea, which varied between 1.4 and 16.8 pg WHO1998TEQ g− 1fresh weight (Karl et al., 2010). In general, total-TEQ levels in eel from marine environments are low compared to concentrations found in eel from European rivers in the catchment area of industrial zones. But, for the Baltic Sea it is well known that fish and other seafood show habitually higher concentrations of environmental pollutants than species collected in other less contaminated places (Bocio et al., 2007).Fernandes et al.
(2009)reported that none of the concentrations observed in any of
the samples fromfish and shellfish available on the UK market, was above the maximum consumption limit forΣPCDD/Fs and for ΣPCDD/ Fs +ΣDL-PCBs.
In absolute concentrations, PCB 118 is the most dominant MO-PCB (levels ranging between 1.311 and 196,136 pg g− 1 fresh weight) followed by PCB 105 (569–31,538 pg g− 1 fresh weight), while
concentrations of PCB 126 ranged from 6 to 602 pg g− 1fresh weight.
McHugh et al. (2010)reported concentrations in Irish eel, with PCB
118 levels ranging between 230 and 2.783 pg g− 1fresh weight and PCB 126 ranging from not detected to 6.3 pg g− 1fresh weight which are dozens lower than the Flemish concentrations. Results from a study byBhavsar et al. (2007)about the distribution of the DL-PCB congeners (absolute concentrations) in different fish species from 1700 locations in Ontario's inland lakes/rivers and the Great Lakes (Canada) are similar as our results. They reported the two MO-PCBs 118 and 105 as the most abundant DL-PCB congeners while the most toxic DL-PCB congeners, PCBs 126 and 169 contributed on average only 0.027% and 0.004% of total-PCBs, respectively (Bhavsar et al.,
2007).Bhavsar et al. (2007)also reported that all NO-PCBs (i.e. PCB
77, PCB 81, PCB 126, and PCB 169) are the lowest DL-PCB contributors to total-PCBs levels infish. Also followingBhavsar et al. (2007), the abundance of DL-PCBs in fish is generally in the order of PCB-118N105N156N167N123N157≈114N189N77N126N81≈169.
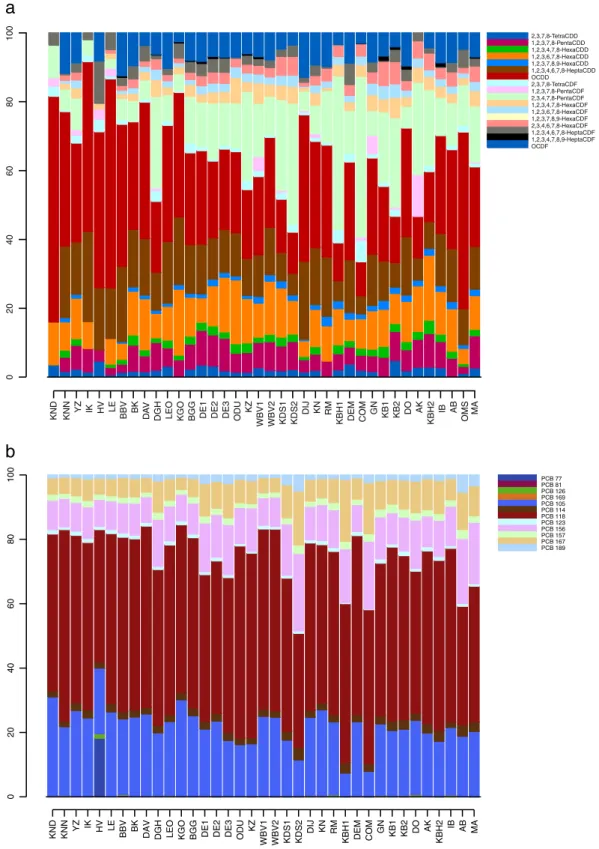
In our study the 1,2,3,7,8-PentaCDD and the 2,3,4,7,8-PentaCDF congeners accounted for 35% and 38% respectively of the total PCDD/
Fs congeners (expressed as pg WHO1998TEQ g− 1(lower bound) on
fresh weight basis;Fig. 3A). The contribution of 2,3,7,8-TetraCDD, which is known as the most toxic dioxin, to the ΣPCDD/Fs is on average 14% (range 6–53%). For dioxins and furans, the congeners 2,3,4,7,8-PentaCDF, 2,3,7,8-TetraCDD and 1,2,3,7,8-PentaCDD pre-dominate. In a study carried out in Canada in 2002 in eight aquatic wild and cultured species (Arctic char (Salvelinus alpinus), crab, mussels, oysters, salmon, shrimp, tilapia (Oreochromis mossambicus), trout),Rawn et al. (2006)found that 1,2,3,7,8-PentaCDD and TetraCDF were the major contributors to ΣPCDD/Fs concentrations. Also in herring from the Baltic Sea (Karl and Ruoff, 2007) and in Polish eel
(Szlinder-Richert et al., 2010), total toxicity is mainly determined by
the 2,3,4,7,8-PentaCDF congener. Results from the Elbe in Germany, reported by Stachel et al. (2006)revealed a predominance of the congeners 2,3,4,7,8-PentaCDF, 1,2,3,4,7,8-HexaCDF and 1,2,3,6,7,8-HexaCDF. In our study, OCDD was only detected in 5 of the 38 sites, similar as in Ireland (McHugh et al., 2010). OCDD belongs to the group of super-hydrophobic or super-lipophilic compounds and has a high bioaccumulation factor (Geyer et al., 2000). This substance often is the most prevalent polychlorinated PCDD found in pentachlorophenol (PCP), a persistent halogenated compound, which has primarily been utilised in the timber industry (McHugh et al., 2010). The occurrence of OCDD may indicate local use but the authors are not aware of the application of PCP or any other dioxin containing substance nor in Ireland– as reported byMcHugh et al. (2010)– nor in Flanders. 3.2. Spatial variation
A maximum concentration ofΣDL-PCBs is reached in Mid-Flanders in the basin of the river Nete where an absolute concentration of 409,152 pg g− 1fresh weight was measured in the Congovaart (COM)
(Table 1). The broad range inΣDL-PCBs and ΣPCDD/Fs concentrations
monitored in the current study is likely due to the large variety in environmental pressure at sampling locations, from large rivers or canals in highly industrialised areas to small rural creeks. This is in agreement withFernandes et al. (2009)who mentioned that actual
WHO-TEQ (pg g-1) 0 2 0 4 0 6 0 8 0 100 120 140 KND KNN YZ IK HV LE BBV BK DA V
DGH LEO KGO BGG DE1 DE2 DE
3 ODU KZ WBV1 WBV2 KD S 1 KD S 2 DI J KN RM KBH1 DEM COM GN KB1 KB2 DO AK KBH2 IB AB OM S MA
Fig. 2. Concentrations of DL-PCBs-TEQ (white striped) and PCDD/Fs-TEQ (black) in eel muscle tissue from pool samples in Flanders. For comparison, the permitted maximum levels of the EC Regulation (EC, 2006) are drawn parallel to the X-axis: (—) maximum level PCDD/Fs=4 pg WHO1998TEQ g− 1fresh weight, (−···−) maximum level PCDD/Fs and
concentrations are dependent, not only on the species but also on the geographical location.
DL-PCBs profiles (pg g− 1fresh weight) are dominated by PCB 118
and PCB 105 concentrations. The Handzamevaart (HV) has a high PCB 77 concentration compared to the other sites (Fig. 3B). Old Meuse (OMS) samples are not analysed for MO-PCBs, and therefore are not included in the DL-PCB analyses.
PCDD/Fs profiles show some peculiar patterns. 1,2,3,7,8,9-HexaCDF was detected nowhere while 1,2,3,7,8-PentaCDF and 1,2,3,4,7,8,9-HeptaCDF are rare. Most profiles show high contributions from OCDD, 2,3,4,7,8-PentaCDF, 1,2,3,4,6,7,8-HeptaCDD and 1,2,3,6,7,8-HexaCDD (ex-cept for the Handzamevaart). OCDF is quite common (mean 2.9 pg g−1 fresh weight) in most profiles, except for the Canal Nieuwpoort-Duinkerke (KND), Iepercanal (IK), Leie (LE) and Albertcanal (AK) where
KND KNN YZ IK HV LE BBV BK DA
V
DGH LEO KGO BGG DE1 DE2 DE3 ODU
KZ WBV1 WBV2 KDS1 KDS2 DIJ KN RM KBH1 DEM COM GN KB1 KB2 DO AK KBH2 IB AB OMS MA 1,2,3,7,8-PentaCDF 2,3,4,7,8-PentaCDF 1,2,3,4,7,8-HexaCDF 1,2,3,6,7,8-HexaCDF 1,2,3,7,8,9-HexaCDF 2,3,4,6,7,8-HexaCDF 1,2,3,4,6,7,8-HeptaCDF 1,2,3,4,7,8,9-HeptaCDF OCDF 02 0 4 0 6 0 8 0 02 0 4 0 6 0 8 0 100 KND KNN YZ IK HV LE
BBV BK DAV DGH LEO KGO BGG DE1 DE2 DE3 ODU
KZ WBV1 WBV2 KDS1 KDS2 DIJ KN RM KBH1 DEM COM GN KB1 KB2 DO AK KBH2 IB AB MA PCB 77 PCB 81 PCB 126 PCB 169 PCB 105 PCB 114 PCB 118 PCB 123 PCB 156 PCB 157 PCB 167 PCB 189
b
Fig. 3. a: Distributions of the PCDD/F congeners (pg g− 1fresh weight) in the eel muscle (pooled samples) in Flanders. For site abbreviations seeTable 1. b: Distributions of the DL-PCB congeners (pg g− 1fresh weight) in the eel muscle (pooled samples) in Flanders. For site abbreviations seeTable 1. The Old Meuse (OMS) sample has been excluded from thefigure because of non available MO-PCB data.
this compound is not detected. Also in the Canal Nieuwpoort-Duinkerke (KND), 1,2,3,7,8-PentaCDD is not detected. In the PCDD/Fs profiles from the Canal Ghent-Ostend (KGO), Canal of Beverlo (KB1) and from the Abeek (AB) 1,2,3,4,6,7,8-HeptaCDF is not detected (Fig. 3A, Table SI-3). The Handzamevaart stands out with high levels of ΣPCDD/Fs (110.5 pg g−1fresh weight) which is surprising as it is situated in an agrarian area, known for its strong pesticide pollution. A possible source is unclear. The Handzamevaart, compared to the other sites, also shows a different PCDD/Fs profile (Fig. 3A). 2,3,4,7,8-PentaCDF and 1,2,3,6,7,8-HexaCDD are not detected while 1,2,3,4,6,7,8-HeptaCDF is detected in a relatively high concentration (13.6 pg g−1fresh weight) compared to the other sites (mean 0.5 pg g−1fresh weight). Sediment analysis in the Handzamevaart confirmed the high levels of PCDD/Fs, suggesting a local pollution source (Sanctorum et al., 2007). High concentrations of NO-PCBs in the Old Meuse (OMS) can be dedicated to the presence of the river Meuse, well-known for its high PCB load (Belpaire et al., 2011; Maes et al., 2008), although its specific DL-PCB profile may suggest a specific local source. The profiles of the Congovaart (COM) and Canal Bocholt-Herentals (KBH1) are similar but distinct from the common profiles, suggesting a common pollution source: both sites have the highest values of 2,3,4,7,8-PentaCDF. Both canals are part of the canal system in the north of Flanders, fed by the river Meuse. They run through an important industrial area including energy production and power transformation industries, which are possible historical sources of PCB contamination. Similar reasons lay at the basis of high levels in the Albertcanal (AK), Canal Dessel-Schoten (KDS) and Old Meuse (OMS).
Dioxin profiles seem to differ from catchment to catchment and probably will depend of local pollution sources. Many questions arise of what the causes of these specific contamination profiles are. Apparently, local specific sources with typical profiles are responsible for this variation in pollution profiles in the eel. Further research is required to identify these local sources. McHugh et al. (2010)
suggested point source influences of PCDDs at the Burrishoole catchment (Ireland) because eel showed more elevated PCDD levels than at four other catchments (Waterford, Mayo, Galway and Monaghan) where similar PCDD/Fs TEQ ratios were calculated. In a Japanese study on crucian carp (Carassius auratus (gibelio) langsdorfii) notable differences in the congener distribution ratios between different sampling areas were seen which could be dedicated to different sources of dioxin contamination (Kajiwara et al., 2007).
3.3. Effects on the eel
Dioxins, furans and PCBs are reported as toxic and bioaccumulative, and thus pose risks to both eel and human health (Geeraerts and Belpaire,
2010; Giesy and Kannan, 1998; Van den Berg et al., 2006).
2,3,7,8-TetraCDD is one of the most toxic and extensively investigated chemical of this type and it is used as a reference for all other related chemicals
(Stachel et al., 2007). The other PCDD/F congeners have similar effects,
but they are less toxic than 2,3,7,8-TetraCDD. NDL-PCBs do not exert their toxicological effects via binding to the Ah receptor– as PCDD/Fs do – but nonetheless are associated with a wide spectrum of toxic responses
(Giesy and Kannan, 1998). Generally, dioxin-type chemicals produce a
wide variety of species specific effects including immunotoxicity, hepatotoxicity, birth defects, endocrine disruption, and the induction of numerous enzymes, most notably that of microsomal cytochrome P4501A1 (CYP1A1) and its associated mono-oxygenase activity, aryl hydrocarbon hydroxylase (Srogi, 2008). In humans and other vertebrates dioxins have been shown to be the risk factors for cancer, immune deficiency, central and peripheral nervous system pathology, endocrine disruption— and many other diseases, as listed bySrogi (2008).
Toxic effects are dependent of the animal species or strain, their age, and sex. In 1991,Spitsbergen et al. (1991)mentioned a disturbed reproduction in lake trout (Salvelinus namaycush) due to the presence of PCBs and dioxins. An investigation into the impact of genotoxins released into the aquatic environment on the level of DNA strand
breakage in erythrocytes of the European eel, revealed an induction of DNA strand breakage after exposure to 2,3,7,8-TetraCDD. However, apoptotic effects of 2,3,7,8-TetraCDD were difficult to interpret, with only the highest (50 mg kg− 1) and lowest (0.1 mg kg− 1) doses being effective (Nigro et al., 2002).
3.3.1. Transfer of contaminants to eel eggs
Palstra et al. (2006) suggested that dioxin-like contaminants
(including some PCBs) are capable of “devastating effects” on the development and survival of eel embryos. They observed a correlation between embryo survival time and TEQ levels in the gonads — implying TEQ-induced teratogenic effects. Palstra et al. (2006)
reported these disrupting effects occurring at levels below 4 pg WHO1998TEQ kg− 1gonad. Together with the fat metabolisation
during the migration, persistent organic pollutants such as DL-PCBs are metabolised too. While the lipid reserves are depleted during migration, contaminants are released into the blood and may damage reproductive organs and affect embryogenesis (Geeraerts and
Belpaire, 2010). This suggests that such contaminants may have
contributed directly to the observed decline in populations (Van
Ginneken et al., 2009). However, Walker et al. (1994) measured
translocation of 2,3,7,8-TetraCDD from adult female trout to oocytes and assessed mortality in fry. If we compare our 2,3,7,8-TetraCDD values in eel muscle and use their conversion factors for oocytes, this gives levels typically in the range of 0.01 to 0.15 pg g− 1in eggs (with one exception of 2.2 for the Handzamevaart), which is not high enough to induce mortality in trout fry (Walker et al., 1994). In a Japanese study it was determined that about 20% of the dioxins in adult female crucian carp were transferred to the eggs (Kajiwara et al., 2007). Applying this conversion rate to eel, by calculating the mass of eggs which could be produced by using all available lipids through a conversion factor of 1.7 g eggs g− 1fat (as used invan Ginneken and
van den Thillart, 2000), ΣPCDD/Fs+DL PCBs levels in eggs would
range between 1.4 and 593 pg WHO1 9 9 8TEQ g− 1 (mean
42.0 pg WHO1998TEQ g− 1), which – compared to thePalstra et al.
(2006)benchmark of 4 pg WHO1998TEQ g− 1– suggests that in 79% of
the sites, levels are high enough to induce disrupting effects in eel eggs. As arguably, the semelparous eel will use a larger proportion of her body lipids to form eggs, compared to an iteroparous species such as the crucian carp, these data may be an underestimation. However, considering the uncertainties associated with comparing with the aforementioned studies, sound conclusions on the impact of field levels of dioxin related compounds on the stock are, at the time being, difficult to draw, underlining the need for the set up of well designed dose–effect experimental studies.
3.4. Human exposure through eel consumption
Due to their high toxicity, dioxins are also considered hazardous chemicals for human health. Recreationalfishermen consuming fish from highly contaminated areas can be exposed to very high levels of dioxins and related compounds (Belpaire et al., 2011). Harmonised EU maximum levels of 4 pg WHO1998TEQ g− 1fresh weight for the sum
ofΣPCDD/Fs and 12 pg WHO1998TEQ g− 1fresh weight for the sum of
dioxins, furans and dioxin-like PCBs (ΣPCDD/Fs +ΣDL-PCBs) in muscle meat of eel and products thereof, have been established (EC, 2006). Our study showed that in 58% of the sites, eel have PCDD/F-DL-PCB TEQ levels higher than the European consumption limit.
Exposure risks increase considerably in cases where consumers eat wildfish species prone to bioaccumulation, such as eel and other fish caught at highly contaminated locations. Although there is no commercial fishery on eel in Flanders, it was estimated that 33.6 tons of eel is taken home by recreationalfishermen for consumption (Vlietinck, 2010). We calculated the mean weekly intake of ΣPCDD/Fs+DL-PCBs for a fisherman with a body weight of 70 kg, consuming weekly 300 g of eel from a highly polluted site, a lowly polluted site, and a median and average
polluted site (Table 2). For the highest polluted site (Congovaart, COM), eating self-caught eel exceeds man's Tolerable Weekly Intake (TWI; 14 pg TEQ kg−1body weight ; European Commission, 2001a) with a factor 43 and multiplies the average Belgian intake with a factor 120. Therefore, levels of PCDD/Fs and DL-PCBs from Belgian eel are of serious concern, and particularly a small group of recreationalfishermen regularly consuming their catch, are at risk. Many other studies (e.g.Bocio et al.,
2007; Domingo and Bocio, 2007; Usydus et al., 2009) have illustrated
increased exposure to environmental contaminants throughfish con-sumption, however, seldom at similar level as in our study. Hence, especially for highly polluted rivers, it is important to closely follow up the contamination levels infish and take all management measures needed in order to avoid consumption of those eel.
4. Recommendations
Monitoring of dioxins plays an important role in public and sanitary decisions. Here, we recommend setting up, continuing, or optimising these monitoring actions on both national and interna-tional levels. For example, it seems appropriate to determine how far contaminated areas extend over the river, in order to trace possible sources and take adequate measures.
Besides, our study suggests that the levels of dioxins and related compounds in eel put additional pressure on the waning eel stock; hence, further work is urgently needed to better understand the impact of these substances on the eel's health and reproduction potential.
This study warrants for a better protection of human health by taking all appropriate measures to limit consumption of eel, and by extension all species, from the most polluted areas. In the Netherlands, from 1st April 2011, a ban on catching eel in PCB-polluted waters has been imposed due to high concentrations of dioxins in eel.
Acknowledgements
The authors gratefully acknowledge Yves Maes, Isabel Lambeens and Linde Galle for sample preparation and technical support, and Pieter Verschelde for statistical advice. We thank the Groenendaal team involved infield sampling of the eel.
Appendix A. Supplementary data
Supplementary data to this article can be found online atdoi:10.
1016/j.scitotenv.2011.05.046.
References
Andersson J, Sandstrom O, Hansen HJM. Elver (Anguilla anguilla l) stockings in a Swedish thermal effluent recaptures, growth and body condition. J Appl Ichthyol-Zeitschrift fur Angewandte Ichthyologie 1991;7:78–89.
Ankarberg E, Bjerselius R, Aune M, Damerud PO, Larsson L, Andersson A, et al. Study of dioxin and dioxin-like PCB levels in fatty fish from Sweden 2000–2002. Organohalogen Compd 2004;66:2061–5.
Belpaire C, Geeraerts C, Roosens L, Neels H, Covaci A. What can we learn from monitoring PCBs in the European eel? A Belgian experience. Environ Int 2011;37: 354–64.
Belpaire C, Goemans G. Eels: contaminant cocktails pinpointing environmental contamination. ICES J Mar Sci 2007;67:1423–36.
Belpaire C, Goemans G, Geeraerts C, Quataert P, Parmentier K. Decreasing eel stocks: survival of the fattest? Ecol Freshw Fish 2009;18:197–214.
Bhavsar SP, Fletcher R, Hayton A, Reiner EJ, Jackson DA. Composition of dioxin-like PCBs infish: an application for risk assessment. Environ Sci Technol 2007;41:3096–102. Bocio A, Domingo JL, Falco G, Llobet JM. Concentrations of PCDD/PCDFs and PCBs infish and seafood from the Catalan (Spain) market: estimated human intake. Environ Int 2007;33:170–5.
Cariou R, Marchand P, Vénisseau A, Brosseaud A, Bertrand D, Qannari El M, Antignac J-P, Le Bizec B. Prediction of the PCDD/F and dl-PCB 2005-WHO-TEQ content based on the contribution of six congeners: toward a new screening approach forfish samples. Environ Pollut 2010;158:941–7.
De Boer J, Dao QT, van Leeuwen SPJ, Kotterman MJJ, Schobben JHM. Thirty year monitoring of PCBs, organochlorine pesticides and tetrabromodiphenylether in eel from The Netherlands. Environ Pollut 2010;158:1228–36.
De Boer J, Hagel P. Spatial differences and temporal trends of chlorobiphenyls in yellow eel (Anguilla anguilla) from inland waters of the Netherlands. Sci Total Environ 1994;141:155–74.
De Boer J, van der Valk F, Kerkhoff MAT, Hagel P. 8-year study on the elimination of PCBs and other organochlorine compounds from eel (Anguilla anguilla) under natural conditions. Environ Sci Technol 1994;28:2242–8.
Domingo JL, Bocio A. Levels of PCDD/PCDFs and PCBs in edible marine species and human intake: a literature review. Environ Int 2007;33:397–405.
European Commission. Commission Regulation (EC) No 1881/2006 of 19 December 2006 setting maximum levels for certain contaminants in foodstuffs. Off J Eur Union 2006:5–24.
European Commission. Opinion of the Scientific Committee on Food on the risk assessment of dioxins and dioxin-like PCBs in food. Update based on new scientific information available since the adoption of the SCF opinion of 22nd November 2000; 2001a. p. 1–29.. CS/CNTM/DIOXIN/20 final.
European Commission. COUNCIL REGULATION (EC) No 2375/2001 of 29 November 2001 amending Commission Regulation (EC) No 466/2001 setting maximum levels for certain contaminants in foodstuffs. 2375/2001; 2001b.. L 321/1-L 321/5. Fernandes AR, Mortimer DN, Rose M, Knowles TG, White S, Gem M. Occurrence of
dioxins (PCDDs, PCDFs) and polychlorinated biphenyls (PCBs) in wild, farmed and processedfish, and shellfish. Food Addit Contam Part B 2009;2:15–20.
Focant JF, Eppe G, Massart AC, Scholl G, Pirard C, De Pauw E. High-throughput biomonitoring of dioxins and polychlorinated biphenyls at the sub-picogram level in human serum. J Chromatogr A 2006;1130:97–107.
Focant JF, Eppe G, Pirard C, De Pauw E. Fast clean-up for polychlorinated dibenzo-p-dioxins, dibenzofurans and coplanar polychlorinated biphenyls analysis of high-fat-content biological samples. J Chromatogr A 2001;925:207–21.
Focant JF, Eppe G, Scippo ML, Massart AC, Pirard C, Maghuin-Rogister G, et al. Comprehensive two-dimensional gas chromatography with isotope dilution time-of-flight mass spectrometry for the measurement of dioxins and polychlorinated biphenyls in foodstuffs — comparison with other methods. J Chromatogr A 2005;1086:45–60.
Focant JF, Pirard C, De Pauw E. Automated sample preparation–fractionation for the measurement of dioxins and related compounds in biological matrices: a review. Talanta 2004;63:1101–13.
Geeraerts C, Belpaire C. The effects of contaminants in European eel: a review. Ecotoxicology 2010;19:239–66.
Geyer HJ, Rimkus GG, Scheunert I, Kaune A, Schramm K-W, Kettrup A, et al. bioaccumulation and occurrence of endocrine-disrupting chemicals (EDCs), persistent organic pollutants (POPs), and other organic compounds infish and other organisms including humans. In: Beek B, editor. The handbook of environmental chemistry. Berlin Heidelberg: Springer-Verlag; 2000. p. 1–166. Giesy JP, Kannan K. Dioxin-like and non-dioxin-like toxic effects of polychlorinated
biphenyls (PCBs): implications for risk assessment. Crit Rev Toxicol 1998;28:511–69. Kajiwara Y, Kashiwagi N, Kadokami K. Nationwide study of dioxins in the freshwater fish Carassius auratus (Gibelio) Langsdorfii (crucian carp) in Japan: concentrations and estimation of source contribution ratios. Chemosphere 2007;69:1177–87. Karl H, Bladt A, Rottler H, Ludwigs R, Mathar W. Temporal trends of PCDD, PCDF and
PCB levels in muscle meat of herring from differentfishing grounds of the Baltic Sea and actual data of differentfish species from the Western Baltic Sea. Chemosphere 2010;78:106–12.
Max 141.9 42,558 43.4 120.6
Min 1.1 342 0.3 1.0
Mean 17.4 5,205 5.3 14.8
Karl H, Ruoff U. Dioxins, dioxinlike PCBs and chloroorganic contaminants in herring, Clupea harengus, from differentfishing grounds in the Baltic Sea. Chemosphere 2007;37:90–5.
Knutzen J, Bjerkeng B, Naes K, Schlabach M. Polychlorinated dibenzofurans/dibenzo-p-dioxins (PCDF/PCDDs) and other dioxin-like substances in marine organisms from the Grenland fjords, S. Norway, 1975–2001: present contamination levels, trends and species specific accumulation of PCDF/PCDD congeners. Chemosphere 2003;52:745–60.
Maes J, Belpaire C, Goemans G. Spatial variations and temporal trends between 1994 and 2005 in polychlorinated biphenyls, organochlorine pesticides and heavy metals in European eel (Anguilla anguilla L.) in Flanders, Belgium. Environ Pollut 2008;153:223–37.
McFarland VA, Clarke JU. Environmental occurrence, abundance, and potential toxicity of polychlorinated biphenyl congeners. Considerations for a congener-specific analysis. Environ Health Perspect 1989;81:225–39.
McHugh B, Poole WR, Corcoran J, Anninou P, Boyle B, Joyce E, et al. The occurrence of persistent chlorinated and brominated organic contaminants in the European eel (Anguilla anguilla) in Irish waters. Chemosphere 2010;79:305–13.
Nigro M, Frenzilli G, Scarcelli V, Gorbi S, Regoli F. Induction of DNA strand breakage and apoptosis in the eel Anguilla anguilla. Mar Environ Res 2002;54:517–20. Oliveiro Ribeiro CA, Vollaire Y, Coulet E, Roche H. Bioaccumulation of polychlorinated
biphenyls in the eel (Anguilla anguilla) at the Camargue Nature Reserve— France. Environ Pollut 2007;153:1–8.
Palstra AP, van Ginneken VJT, Murk AJ, van den Thillart GEEJM. Are dioxin-like contaminants responsible for the eel (Anguilla anguilla) drama? Naturwissenschaf-ten 2006;93:145–8.
Piatek M. Age, growth and changes of weight proportions and of chemical composition of eel during its life in Polish waters. Acta Ichthyol Pisc 1970;1:73–96. R Development Core Team. R: a language and environment for statistical computing.
Vienna, Austria: R Foundation for Statistical Computing; 2010.
Rawn DF, Forsyth DS, Ryan JJ, Breakell K, Verigin G, Nicolidakis H, et al. PCB, PCDD and PCDF residues infin and non-fin fish products from the Canadian retail market 2002. Sci Total Environ 2006;359:101–10.
Roosens L, Geeraerts C, Belpaire C, Van Pelt I, Neels H, Covaci A. Spatial variations in the levels and isomeric patterns of PBDEs and HBCDs in the European eel in Flanders. Environ Int 2010;36:415–23.
Sanctorum H, Windal I, Hanot V, Goeyens L, Baeyens W. Dioxin and dioxin-like activity in sediments of the Belgian coastal area (Southern north sea). Arch Environ Contam Toxicol 2007;52:317–25.
Spitsbergen JM, Walker MK, Olson JR, Peterson RE. Pathological alterations in early life stages of lake trout, Salvelinus namaycush, exposed to 2,3,7,8-tetrachlorodibenzo-p-dioxin as fertilized eggs. Aquat Toxicol 1991;19:41–72.
Srogi K. Levels and congener distributions of PCDDs, PCDFs and dioxin-like PCBs in environmental and human samples: a review. Environ Chem Lett 2008;6:1–28. Stachel B, Christoph E-H, Götz R, Herrmann T, Krüger F, Kühn T, et al. Dioxins and
dioxin-like PCBs in differentfish from the river Elbe and its tributaries, Germany. J Hazard Mater 2007;148:199–209.
Stachel B, Kühn T, Reincke H, Schröter-Kermani C, Uhlig S. Statistical evaluation with dioxin patterns in differentfish species from the River Elbe, Germany. Fresenius Environ Bull 2006;15:1624–31.
Svedäng H, Neuman E, Wickström H. Maturation patterns in female European eel: age and size at the silver eel stage. J Fish Biol 1996;48:342–51.
Svedäng H, Wickström H. Low fat contents in female silver eels: indications of insufficient energetic stores for migration and gonadal development. J Fish Biol 1997;50:475–86.
Szlinder-Richert J, Usydus Z, Pelczarski W. Organochlorine pollutants in European eel (Anguilla anguilla L.) from Poland. Chemosphere 2010;80:93–9.
Usydus Z, Szlinder-Richert J, Polak-Juszczak L, Komar K, Adamczyk M, Malesa-Ciecwierz M, et al. Fish products available in Polish market— assessment of the nutritive value and human exposure to dioxins and other contaminants. Chemosphere 2009;74:1420–8.
Van den Berg M, Birnbaum LS, Denison M, De Vito M, Farland W, Feeley M, et al. The 2005 World Health Organization re-evaluation of human and mammalian toxic equivalency factors for dioxins and dioxin-like compounds. Toxicol Sci 2006;93:223–41. Van Ginneken L, Palstra AP, Leonards P, Nieveen M, van den Berg H, Flik G, et al. PCBs
and the energy cost of migration in the European eel (Anguilla anguilla L.). Aquat Toxicol 2009;92:213–20.
van Ginneken VJT, van den Thillart GEEJM. Eel fat stores are enough to reach the Sargasso. Nature 2000;403:156–7.
Vlietinck K. Enquête bij vissers op openbaar water in Vlaanderen. Vislijn 2010:23–4. Jaargang 2010.
Walker MK, Cook PM, Batterman AR, Butterworth BC, Berini C, Libal JJ, et al. Translocation of 2,3,7,8-Tetrachlorodibenzo-P-dioxin from adult female lake trout (Salvelinus namaycush) to oocytes— effects on early-life stage development and sac fry survival. Can J Fish Aquat Sci 1994;51:1410–9.
Windal I, Vandevijvere S, Maleki M, Goscinny S, Vinckx C, Focant J-F, et al. Dietary intake of PCDD/Fs and dioxin-like PCBs of the Belgian population. Chemosphere 2010;79: 334–40.