Data Entry Errors and Design for Model-Based Tight
Glycemic Control in Critical Care
Logan Ward1, BEng; James Steel1, BEng; Aaron Le Compte1, PhD; Alicia Evans1, BEng; Chia-Siong Tan1, BEng; Sophie Penning2, MS; Geoffrey M Shaw3, MBChB; Thomas
Desaive2, PhD; J. Geoffrey Chase1, PhD
1
Department of Mechanical Engineering, Centre for Bio-Engineering, University of Canterbury, Christchurch, New Zealand
2
Cardiovascular Research Centre, University of Liege, Liege, Belgium
3
Department of Intensive Care, Christchurch Hospital, Christchurch School of Medicine, University of Otago, Christchurch, New Zealand
Work performed at:
- Christchurch Hospital, Christchurch, NZ
- Dept of Mechanical Engineering, Centre for Bio-Engineering, Univ of Canterbury - University of Liege, Liege, Belgium
Address for Reprints: Available from Corresponding Author:
Prof J. Geoffrey Chase,
Department of Mechanical Engineering University of Canterbury,
Private Bag 4800 Christchurch New Zealand
Email: geoff.chase@canterbury.ac.nz
Financial Support: NZ Foundation for Research Science and Technology (FRST). Fonds
National de la Recherche Scientifique (FNRS).
Keywords: critical care, user interface, data entry, error, human factors, glycemic
control, ICU, intensive care, intensive insulin therapy, STAR, TGC
Disclosure and Conflict of Interest: None
List of Abbreviations / Acronyms:
Blood Glucose (BG)
Graphical User Interface (GUI)
Human Computer Interaction (HCI)
Intensive Care Unit (ICU)
Stochastic Targeted (STAR)
ABSTRACT:
Introduction: Tight glycemic control (TGC) has shown benefits, but been difficult to
achieve consistently. Model-based methods and computerized protocols offer the opportunity to improve TGC quality but require human data entry, particularly of blood glucose (BG) values, which can be significantly error prone. This study presents the design and optimisation of data entry methods to minimize error for a computerized and model-based TGC method prior to pilot clinical trials.
Method: To minimize data entry error, two tests are carried out to optimize a method
with errors less than the 5%-plus reported in other studies. Four initial methods are tested on 40 subjects in random order, and the best two are tested more rigorously on 34 subjects. The tests measure entry speed and accuracy. Errors are reported as corrected and uncorrected errors, with the sum comprising a total error rate. The first set of tests uses randomly selected values, while the second set uses the same values for all subjects to allow comparisons across users and the magnitude of errors to be directly assessed. These research tests were approved by the University of Canterbury Ethics Committee.
Results: The final data entry method tested reduced errors to less than 1-2%, a 60-80%
reduction from reported values. The magnitude of errors was clinically significant and typically by 10.0 mmol/L or an order of magnitude, but only for extreme values of BG < 2.0 mmol/L or BG > 15.0-20.0 mmol/L, both of which could be easily corrected with automated checking of extreme values for safety.
Conclusion: The data entry method selected significantly reduced data entry errors in the
limited design tests presented, and is in use on a clinical pilot TGC study. The overall approach and testing methods are easily performed and generalisable to other applications and protocols.
1.0 Introduction
Hyperglycemia and glycemic variability increase the risk of negative outcomes [1-3], as well as cost [4, 5], in critical care. Tight glycemic control (TGC) can mitigate these issues [6-9]. However, consistent, effective TGC remains elusive [10]. Computerized and model-based methods [11-13] have been mooted as an effective solution that can best address the inter- and intra- patient variability that exacerbates the problem [14]. However, a computer-based system may also introduce added sources of error.
This study explores one aspect of user interface design in the clinical context of TGC. In particular, model-based protocols use measurements to identify and track patient-specific metabolic status and thus offer significant potential [15-17]. However, these advantages come at a cost of potentially maximising the impact of errors from data entry error. Additionally, the potential burden of time-consuming data entry to run a model-based system may increase resistance to adoption in large-scale clinical usage, despite any promising simulation or pilot trial results supporting its use. Hence, accuracy, ease, and speed of use of data entry are important considerations.
Current glycemic control systems or protocols are semi-automated with a “human in the loop” for safety and regulatory reasons, and/or for ease of implementation. Data entry errors can lead to problems such as:
o Poor/mis-entry of data or/and transcription errors
o Poor/mis-entry of the control input suggested to the clinical staff o Incomplete data entered or available
All of these errors can influence the performance of a computer-based TGC protocol. Campion [18] for example found that the mis-entry of blood glucose measurements had a significant impact on the insulin dose, with a transcription error rate of 5.3%, of which a significant fraction were possibly deliberate. Model-based systems using measurements to identify patient-specific status may inadvertently amplify these errors. Even the blood glucose concentration units used can have an impact [18].
Human computer interaction (HCI) is well studied in other fields and industries, but is an emerging topic in medicine, which presents its own application-specific features. In particular, most protocols for TGC and other therapeutics in critical care are designed by doctors, nurses and/or clinical researchers, and applied using standard medical devices. This approach creates a significant disconnect between engineers and designers skilled and trained in Human Factors and those who are creating such systems for use. The regulatory requirements around medical devices and therapeutic decision support can reinforce this barrier in many cases. As a result, clinical protocols often have variable ergonomics and they are given little or no consideration in their design.
More importantly, in TGC, data entry error can be a major source of error in TGC protocols [18, 19]. It is also a primary source of perceived clinical effort [20, 21]. Hence, targeting new approaches that minimize error, thus increasing patient safety and quality of care, also present the opportunity to impact on real and perceived clinical effort.
A standard computer keyboard is used almost universally as the entry method for this critical data (e.g. [18, 19]). However, despite its status as the default entry method, it may not necessarily be the most efficient or accurate mode of interaction. Touch-screen tablet
devices allow a ‘virtual keyboard’ to be created to easily alter the design and geometry of the numerical entry system to evaluate any potential benefits of a different design. Additionally, context-sensitive methods can be used to actively correct errors (for example, entered BG values that are outside general physiologic ranges).
As a case study, this paper presents the basic development and testing of different data entry methods to minimize errors. There are three overall goals. First, to how slightly modified methods of numerical entry can significantly reduce errors that could pose significant risks to patients in altering model-based treatment suggestions. Second, to show the range of errors that can occur across a range of numerical entry methods. Finally, to present a simplified ergonomic design and analysis as a framework for clinically focused individuals who design and implement such protocols.
2.0 Methods
2.1 STAR TGC system:
STAR (Stochastic TARgeted), is a model-based and computerized TGC protocol that uses probabilistic methods [15, 16, 22] to determine the optimum combination of dextrose (nutrition) and insulin administration to ensure tight control and safety from hypoglycemia in the presence of significant, clinically observed intra- and inter- patient variability [14, 23]. A version of STAR is currently in use in Liege, Belgium [22] and Christchurch, New Zealand. Nurses measure BG manually at the bedside every 1-3 hours (per the protocol) using a hand-held glucometer and input this measurement into a computer. The model-based treatment suggests an insulin and nutrition intervention to maximize time in clinically specified glycemic bounds and a specified 5% or lower hypoglycemic risk (BG < 4.4 mmol/L). Nurses select the measurement interval to self-manage workload within the protocol. A touch-screen tablet was selected as the implementation platform for STAR, primarily for size, portability and hygiene reasons.
2.2 Data Entry Methods and Design:
A touch-screen interface provides a unique opportunity to test different keypad layouts for the entry of blood glucose values to assess potential error rates. Four proposed entry methods were tested:
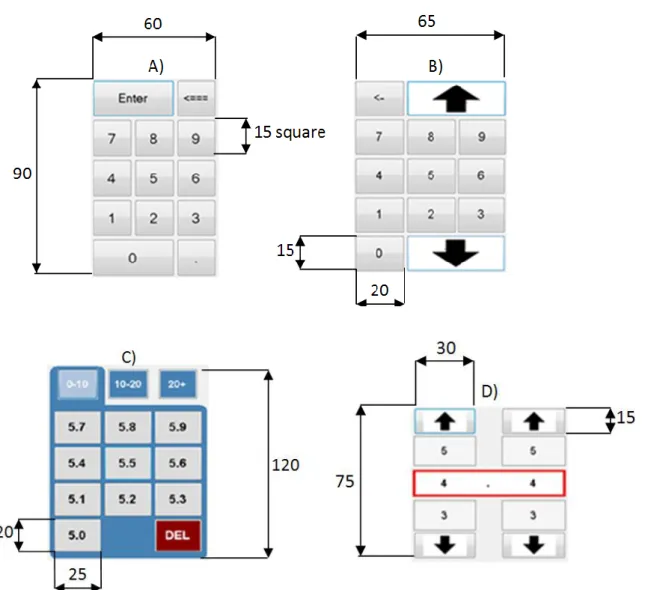
A) Number Pad: An ordinary number pad with decimal point, this is the familiar computer keyboard style system (Figure 1A). Then number 7.8 is entered by pressing the number 7, followed by the decimal point and then the number 8. B) Cash Register: A number pad without the decimal point, similar to a cash
register, to improve speed and avoid errors with missed decimal points (Figure 1B). The number 7.8 is entered by pressing the number 7 and then the number 8. The large arrows offer an option for numbers over 10.0, which can be entered as either “1-0-0”, or via the “arrow-10-0”
C) Modified Number Pad: where the exact number is touched, designed to reduce data entry error and increase speed (Figure 1C). The number 7.8 is entered by pressing the number 7 (in 1-10), and then pressing 7.8 (of 7.0 – 7.9)
D) Number Scroller: A number scrolling system to reduce data entry errors (Figure 1D). The number 7.8 is entered by pressing the up and down arrows until the number 7.8 is displayed within the red box.
All four methods are displayed in Figure 1, where the Modified Number Pad (C) screen shown requires a prior touch to the number 5 on a panel similar to Figures 1A,B, and different ranges (0-10, 10-20, 20-30 mmol/L) require an extra touch if the default range (0-10 mmol/L) is not valid. Hence, the Modified Number Pad is a hybrid approach and not a pure number pad that would show all possible values that in this case would be too large for easy use. Dimensions are shown for reference, where relatively large button sizes and similarly large spacing were chosen empirically to minimize accidental mistyping errors even with relatively large hands, for ease of use and in an attempt to eliminate any impact of hand size on error.
Two sets of tests were run. The first is to evaluate the four methods. The second takes the best two based on error rate, speed and user feedback, and optimizes them for a further, more detailed comparison. It is thus an engineered approach, rather than a pure human factors analysis.
2.2.1 Initial Tests:
A program was developed to test the entry methods. Tests were conducted on (N=40) volunteers from the University of Canterbury Department of Mechanical Engineering, with the software running on the same tablet PC and interface. Approval for this study was granted by the University of Canterbury Human Ethics Committee.
Figure 1: Input tester methods, clockwise from top left: A) Number pad, B) Cash
Register, C) Modified Number Pad, D) Number Scroller. Dimensions are shown to indicate size on the touch pad where the larger sizes used here should be less error prone (to a point). All dimensions are in mm.
For the first stage, each user was presented with each entry method in a random order (N=24 permutations) and personally instructed on how to use each method, as well as given written instructions. Randomisation was done by the testing program based on a list of all possible permutations, which were selected (and eliminated) in random order until all possibilities were used once. The process was then restarted for the remaining candidates. They were then prompted to enter a series of 10 randomly selected BG values in mmol/L taken from clinical data [6]. Random sequences are used to avoid users
“training” on the first methods and learning the number sequences, which can skew results. However, random sequences are also not the same, so each user received a different set of values and direct comparison across users is thus not possible.
The overall goal is to assess the error rate and speed, along with user preference, before the further intensive testing round where comparison across users is possible. Thus, the number of errors (not magnitude) and the time taken for each entry method were recorded. In particular, there are two kinds of errors, one where users note it and correct that input by re-entering it, and the second where the error goes unnoticed. Corrections are included in the time to enter one number and thus the speed of entry will also reflect the number of errors as well as usability. Only the time taken from the first click to input a number was recorded so that any reading time is not included. Thus, these entry times are strictly a function only of the data entry element of the interface. Finally, users were also asked about their preferred entry method afterward for subjective feedback, and as a surrogate for perceived effort.
2.2.2 Intensive Tests:
A new set of (N=34) users were presented each final interface in random order, and given instruction on how to use the entry method. To allow the user to become familiar with each entry method, a series of 5 unrecorded practice numbers were given before data was recorded for each method. Practice numbers were selected to cover the particularities of each entry method. For example, the way in which a number larger than 10 is entered by the Modified Number Pad (C) requires an extra touch, and is different to the way a whole number smaller than 10 is entered for the Cash Register (B).
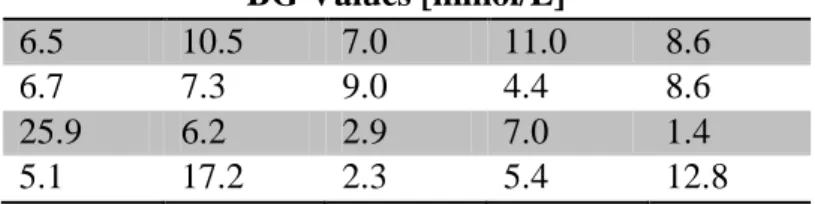
The number of blood glucose concentration values to input was increased to twenty (5 practice, 15 recorded), giving more data and allowing per-number trends to be shown. To enable direct comparison between the two methods, the same set of numbers was used for each entry method, and for each user. The test numbers are shown in Table 1.
Table 1: Selected clinical blood glucose values used for data-entry testing. Order is
left-right and rows one through four, with the first row being the 5 practice numbers.
BG Values [mmol/L]
6.5 10.5 7.0 11.0 8.6
6.7 7.3 9.0 4.4 8.6
25.9 6.2 2.9 7.0 1.4
5.1 17.2 2.3 5.4 12.8
The values in Table 1 are selected to test the specific aspects of each number entry method. Hence, there are 4 whole number occurrences (e.g. 7.0, 9.0) and 5 values over 9.9. Equally, they test the range of common BG values (4.0-9.0, 12 occurrences) and extreme values of BG < 3.0 and BG > 15.0 (2 occurrences each). The relatively short test minimizes issues with tester fatigue and may more accurately mimics a rushed clinical situation, but this approach thus does not equally cover all possible values or decimal places.
Both forms of entry error are counted. In addition, the number suggested and number actually entered are recorded to assess the magnitude of error and thus their potential impact. Note that only the final corrected (or erroneous) value entered is retained. Using only these erroneous values should show both errors that might be made and are likely to be missed by the user. Error rates are presented for the 15 test set values, however, the magnitude of errors recorded are shown for all 20 values due to limited numbers of errors and to show the range of possible errors for each method. The total time taken to
complete the 15 test numbers is recorded for analysis of overall speed of entry. Finally, both the number of clicks and the speed per entry of each number were assessed as measures of effort required.
2.3 Analyses:
All tests were run with university students in a large 60-100 seat computer suite that has several distractions and background noise, to best mimic the clinical situation. The short fast tests were also designed to mimic the rushed clinical situation. Each participant’s accuracy and speed were assessed in general and for each method. Results are presented by method for all participants using non-parametric statistics (median, IQR).
3.0 Results
3.1 Initial Entry Test Results:
Figure 2 presents errors categorized by whether the error was noticed and corrected, or missed. These values are plotted against total entry time. In both cases, errors decrease with time taken. Fewer errors went unnoticed (35 of 2000 possible) than were corrected (49 of 2000). Table 2 summarizes these results, where corrections refer to using the ‘Delete’ button during number entry, and uncorrected errors occur where the final number entered differs from the number prescribed. Notably, the Number Pad (A) error rate is of similar magnitude to the 5.3% of Campion et al [18], validating the test approach.
Figure 2: Entry error by type for initial test. Left: Errors made and corrected. Right:
errors made and entered. Each marker represents one user test (of 40 users).
Table 2: Time taken to complete 10 entries, across all participants for initial tests
A) Number Pad B) Cash Register C) Modified Number Pad D) Number Scroller Min [s] 15 14 15 23 Median [s] 23 20.5 32.4 47.5 IQR [s] [20, 25.25] [17.75, 27] [22, 39] [37.5, 59.5] Max [s] 40 49 77 107
Correction rate [%] 5.00 3.00 2.10 N/A
Error rate (uncorrected) [%] 2.75 1.25 0.25 4.25
Total error rate [%] 7.75 4.25 2.35 4.25
0 20 40 60 80 100 0 1 2 3 4 5 6 7 8
Time for 10 entries [s]
C o rr e c ti o n s p e r 1 0 e n tr ie s Number Pad Cash Register Modified Number Pad Number Scroller 0 20 40 60 80 100 0 1 2 3 4 5 6 7 8
Time for 10 entries [s]
E rr o rs p e r 1 0 e n tr ie s Number Pad Cash Register Modified Number Pad Number Scroller
The Number Scroller (D) consistently took the longest time to enter numbers in comparison to other methods by ~38-70% in comparing minimum, maximum, median and IQR values in Table 2 to the next longest values for the other methods (p < 0.05, Mann-Whitney test). The Modified Number Pad (C) is the next slowest method. The traditional Number Pad (A) had the highest error rates, both corrected and uncorrected. In addition, subjective feedback for the Number Scroller (D) was negative. Thus, the Cash Register (B) and Modified Number Pad (C) were selected for the second test based on speed, accuracy and user preference.
3.2 Intensive Entry Test Results:
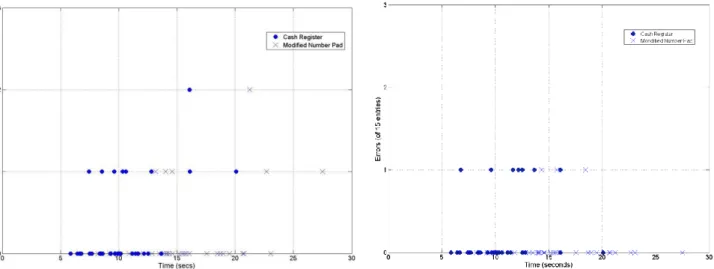
The total error rate was reduced to less than 1% for the Modified Number Pad (C) and less than 2% for the Cash Register (B). Figure 3 splits the data according to the type of error made. Table 3 shows the average time to complete a set of 15 numbers across all participants.
Figure 3: Errors corrected by the user (Left) and errors that were left uncorrected (Right)
Table 3: Time (secs) to complete 15 test entries for all participants.
Min Median [IQR] Max
Cash Register 12.7 19.6 [16.0, 22.6] 31.3
Modified Number Pad 15.8 27.2 [23.1, 32.8] 43.5
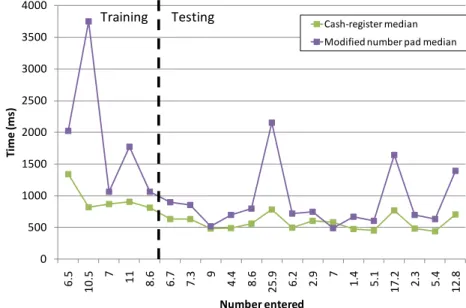
Figure 4 shows the time to enter each individual number, where the first 5 are training set numbers not counted in Figure 3 and Table 3. It is clear that the 5 initial training samples helped get users familiar, and relatively equally so. The spikes for numbers 11, 17 and 20 correspond in Table 1 to entry values >10 (25.9, 17.2 and 12.8 mmol/L). In all cases the Cash Register (B) was significantly quicker than the Modified Number Pad (C) (p<0.05).
Figure 4: Mean total time (seconds) required to enter each number for Cash Register
(Squares) and Modified Number Pad (Crosses “X”) methods in the second test.
Figure 5 shows the combined total of corrections and errors entered for each number, showing which numbers posed the biggest problem. For the first 5 training numbers the error rate is high, but drops rapidly once the user became familiar with the method.
0 500 1000 1500 2000 2500 3000 3500 4000 6 .5 1 0 .5 7 11 8.6 6.7 7.3 9 4.4 8.6 2 5 .9 6.2 2.9 7 1.4 5.1 1 7 .2 2.3 5.4 1 2 .8 Ti me (ms ) Number entered Cash-register median Modified number pad median Testing
Figure 5: Total corrections and errors entered per entry for cash register and modified
number pad in the second round of testing
Based on data used to create Figure 5, the numbers 25.9 and 17.2 (Table 1) were the most likely to be corrected for both methods. However, they occur very infrequently for TGC due to their very high values compared to normal TGC levels of 4.0-8.0 mmol/L. For the modified number pad the most common errors were made on numbers above 10 and for the cash register the most common errors occurs for whole numbers (e.g. 7.0) where the magnitude of the error was a factor of 10 as users forgot to press the “0”. The magnitude of erroneous and uncorrected entered values is given in Table 4.
0 1 2 3 4 5 6 7 8 9 10 1 2 3 4 5 6 7 8 9 10 11 12 13 14 15 16 17 18 19 20 To ta l n u m b er o f err o rs
Blood glucose entry (order as listed in Table 1)
Cash Register Modified Pad
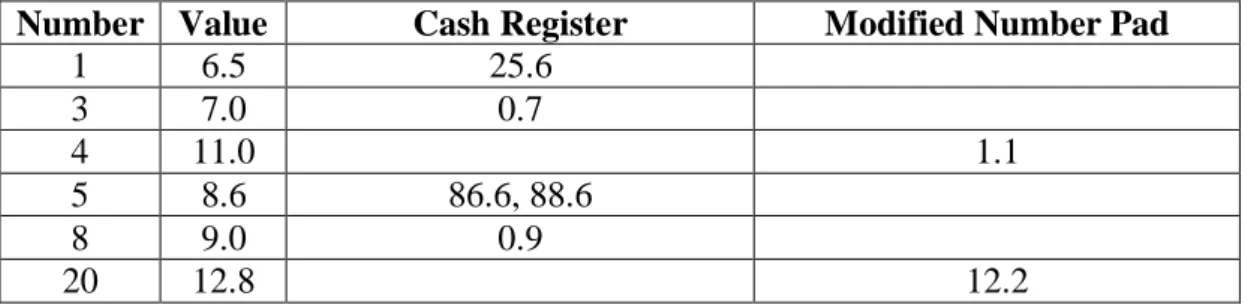
Table 4: Magnitude of errors for all 20 (5 training + 15 test) values in Intensive Tests.
Only those values that had uncorrected errors are shown. Number is the number of the value in the 20 number sequence.
Number Value Cash Register Modified Number Pad
1 6.5 25.6 3 7.0 0.7 4 11.0 1.1 5 8.6 86.6, 88.6 8 9.0 0.9 20 12.8 12.2
Based on the magnitude of errors for the Cash Register Method, additional active safety checks were added to the final version. BG values are only very infrequently (< 0.1%) greater than 25.0 mmol/L in TGC, so larger values must be confirmed by the user (e.g. 86.6 instead of 8.6 for the fifth tested number). BG < 1.0-2.0 mmol/L is also extremely unlikely, and should always be checked due to the severity of such a low value, so any value between 0-2 mmol/L (e.g. 0.9 versus 9.0) must also be confirmed via an automated prompt. These checks would eliminate the observed forms of error for the Cash Register method. The Modified Number Pad errors were either not significant with respect to risk in changing therapy (12.2 vs. 12.8) or highly significant (1.1 severe hypoglycemia vs. 11.0, misread apparently) but would be caught by extreme value error checking. Hence, the Cash Register method had more errors that were not detected and corrected, but those errors lead to unrealistic values minimising some of the inherent risk.
Finally, the number of clicks per entry in the 15 tested values shows the same trend of results. Specifically both methods required 2-3 touches or clicks per number. Thus, the median [IQR; 90%CI] should equal 2 clicks [2-2; 2-3]. For the Cash Register (B) the values were median 2 clicks [2-2; 2-3] with a maximum of 5 where a user made errors and corrected them. However, for the Modified Number Pad (C) the results were median
2 clicks [2-2; 1-5] with a maximum of 9 clicks. Hence, there were far more, and larger, outliers in the clicks and effort required for the Modified Number Pad than for the Cash Register in this test.
When each participant finished using both entry methods they were asked to choose their preferred method. Here, 91% of users selected the Cash Register (B), despite it being the less accurate method with slightly more errors. However, it significantly reduced both the errors entered and corrections that needed to be made (reducing user effort) compared to the original 4 methods and reported values as high as 10% [18]. Higher user preference and overall faster interaction speed were also favourable factors reported.
4.0 Discussion
Computerized medical decision support protocols have potential to be more efficient than paper-based protocols in achieving compliance to protocol suggested interventions [11, 24, 25]. Achieving a high level of compliance is vital to the success of a clinical protocol [26, 27]. Hence, the interface design and human factors are a critical link in developing successful TGC protocols.
The testing of data entry methods showed that overall speed and accuracy are only two of a number of important factors. Perceived effort required in using each method is also an important factor to consider. One of the most accurate entry methods, the Number Scroller (Figure 1D), lacked speed and the associated perceived effort was therefore larger, meaning that it was not well liked. It should be noted that this number scroller was implemented to mimic that of the popular Apple I-Phone(TM) interface in speed and ease of use, so the authors felt that its lack of speed had more to do with its usability rather than the specific software implementation. In particular, user feedback was that it was simply slower than the direct number typing based methods. Intentional errors by the user, some of which were observed in these tests, show that perceived effort and speed are just as important to entry method, as accuracy. Hence, preference was a good surrogate for perceived effort.
The Number Pad data entry method produced a total error rate of 7.75% (2.75% missed and 5.0% corrected). This result is similar to a report by Campion et al. [18] where an error rate of 5.3% was recorded for BG values entered into a computer with a similar system but different units (mmol/L here vs mg/dL for Campion et al). Equally, for this
short test, the test subjects could have been paying greater attention and thus less errors are missed. However, in sum, the overall broad agreement provides some fundamental validation of the testing methods used to reflect clinical scenarios.
One potential limitation is that test numbers were limited in both sets of tests to 10-15 (plus practice values). This choice was made to minimize tester fatigue and non-compliance. Equally, the goal was a short, fast, easy test that would best mimic the rapid, sometimes inattentive, pace seen clinically. However, short tests limit the numbers of errors that might be seen, where a longer test with more values may have been able to include more particular or problematic values.
A further limitation that should be noted is that the errors reported here are those made by this test group and for this test. It thus cannot show any errors that could occur in use due to deliberate non-compliance with the protocol using the data entry method. Equally, while we tried to mimic the rushed pace seen clinically, no test situation can truly replicate this situation, and thus further non-deliberate errors may appear when implemented that will have to be analysed in a separate study similar to that in [18].
Finally, these tests were run using university students in a distraction filled environment with background noise and activity to best match the clinical situation. We were unable to test ICU nurses in the actual setting as it would interfere with care. Hence, further testing with the final system in pilot trials will offer data for comparison of entry error as all values must also be charted manually at this time.
Point of care blood glucose sensors that can directly upload measurements are currently available, and are one logical next step for computerising TGC. Such automated data entry would remove much of the current potential for data entry errors, as well as removing a step from each interaction with the computer. However, regulatory issues and ensuring the fidelity of this transmission make this level of automation problematic at this time.
Computerized systems offer many other possibilities not addressed in this design. In particular, a great deal more data entry could be included for other uses, such as tracking organ failure as a response to TGC [9], monitoring the impact of drug therapy [28], or using model-based metabolic markers in sepsis or other diagnostics [29, 30]. Such possible additions were not in the focus of this case study, but their addition or use could be included using a similar design approach.
In summary, this article focused on the use of basic design to minimize effort and error in data entry for a computerized TGC protocol. The results show a clear potential to reduce significant data entry errors that can lead to significant differences in recommended therapy in a model-based system by using a simple design approach to data entry. It should be noted that the preferred data entry approach chosen here may not be the same as that chosen elsewhere, where a different balance of accuracy and data entry speed might be preferred. However, the overall approach presented provides a simple, replicable means of designing and testing such methods for any given application.
5.0 Conclusions
Poor interface design and/or complexity can result in significant errors in providing care in the intensive care unit. This case study focuses on the design and development of data entry methods for the new STAR glycemic control protocol. Data entry was optimized via rigorous testing to reduce errors approximately 350% over prior reports to 1-2% or less. The overall approach and methods are easily generalisable and can serve as a template for clinicians and researchers creating protocols that are more human factors centered.
REFERENCES:
1. Egi M, Bellomo R, Stachowski E, French CJ, Hart G: Variability of blood
glucose concentration and short-term mortality in critically ill patients.
Anesthesiology 2006, 105(2):244-252.
2. Egi M, Bellomo R, Stachowski E, French CJ, Hart G, Stow P: Circadian rhythm
of blood glucose values in critically ill patients. Crit Care Med 2007,
35(2):416-421.
3. Krinsley JS: Association between hyperglycemia and increased hospital
mortality in a heterogeneous population of critically ill patients. Mayo Clin
Proc 2003, 78(12):1471-1478.
4. Krinsley JS: Decreased mortality of critically ill patients with the use of an
intensive glycemic management protocol. Crit Care Med 2003, 31:A19.
5. Van den Berghe G, Wouters PJ, Kesteloot K, Hilleman DE: Analysis of
healthcare resource utilization with intensive insulin therapy in critically ill patients. Crit Care Med 2006, 34(3):612-616.
6. Chase JG, Shaw G, Le Compte A, Lonergan T, Willacy M, Wong XW, Lin J, Lotz T, Lee D, Hann C: Implementation and evaluation of the SPRINT
protocol for tight glycaemic control in critically ill patients: a clinical practice change. Crit Care 2008, 12(2):R49.
7. Van den Berghe G, Wouters P, Weekers F, Verwaest C, Bruyninckx F, Schetz M, Vlasselaers D, Ferdinande P, Lauwers P, Bouillon R: Intensive insulin therapy
in the critically ill patients. N Engl J Med 2001, 345(19):1359-1367.
8. Krinsley JS: Effect of an intensive glucose management protocol on the
mortality of critically ill adult patients. Mayo Clin Proc 2004, 79(8):992-1000.
9. Chase JG, Pretty CG, Pfeifer L, Shaw GM, Preiser JC, Le Compte AJ, Lin J, Hewett D, Moorhead KT, Desaive T: Organ failure and tight glycemic control
in the SPRINT study. Crit Care 2010, 14(4):R154.
10. Griesdale DE, de Souza RJ, van Dam RM, Heyland DK, Cook DJ, Malhotra A, Dhaliwal R, Henderson WR, Chittock DR, Finfer S et al: Intensive insulin
therapy and mortality among critically ill patients: a meta-analysis including NICE-SUGAR study data. Cmaj 2009.
11. Morris AH, Orme J, Jr., Truwit JD, Steingrub J, Grissom C, Lee KH, Li GL, Thompson BT, Brower R, Tidswell M et al: A replicable method for blood
glucose control in critically Ill patients. Crit Care Med 2008, 36(6):1787-1795.
12. Chase J, Shaw GM, Wong XW, Lotz T, Lin J, Hann CE: Model-based
Glycaemic Control in Critical Care - A review of the state of the possible.
Biomedical Signal Processing and Control 2006, 1(1):3-21.
13. Chase J, LeCompte A, Preiser JC, Shaw G, Penning S, Desaive T: Physiological
Modelling, Tight Glycemic Control and the ICU Clinician: What are models and how can they affect practice? Annals of Intensive Care 2011, in-press.
14. Chase JG, Le Compte AJ, Suhaimi F, Shaw GM, Lynn A, Lin J, Pretty CG, Razak N, Parente JD, Hann CE et al: Tight glycemic control in critical care - The
leading role of insulin sensitivity and patient variability: A review and model-based analysis. Comput Methods Programs Biomed 2011, 102(2):156-171.
15. Lin J, Lee D, Chase JG, Shaw GM, Le Compte A, Lotz T, Wong J, Lonergan T, Hann CE: Stochastic modelling of insulin sensitivity and adaptive glycemic
control for critical care. Comput Methods Programs Biomed 2008,
16. Le Compte A, Chase J, Lynn A, Hann C, Shaw G, Wong X, Lin J: Blood Glucose
Controller for Neonatal Intensive Care: Virtual trials development and 1st clinical trials. Journal of Diabetes Science and Technology (JoDST) 2009, 3(5):1066-1081.
17. Hovorka R, Kremen J, Blaha J, Matias M, Anderlova K, Bosanska L, Roubicek T, Wilinska ME, Chassin LJ, Svacina S et al: Blood glucose control by a model
predictive control algorithm with variable sampling rate versus a routine glucose management protocol in cardiac surgery patients: a randomized controlled trial. J Clin Endocrinol Metab 2007, 92(8):2960-2964.
18. Campion TR, Jr., May AK, Waitman LR, Ozdas A, Gadd CS: Effects of blood
glucose transcription mismatches on a computer-based intensive insulin therapy protocol. Intensive Care Med 2010, 36(9):1566-1570.
19. Thomas AN, Marchant AE, Ogden MC, Collin S: Implementation of a tight
glycaemic control protocol using a web-based insulin dose calculator.
Anaesthesia 2005, 60(11):1093-1100.
20. Aragon D: Evaluation of nursing work effort and perceptions about blood
glucose testing in tight glycemic control. Am J Crit Care 2006, 15(4):370-377.
21. Mackenzie I, Ingle S, Zaidi S, Buczaski S: Tight glycaemic control: a survey of
intensive care practice in large English hospitals. Intensive Care Med 2005, 31(8):1136.
22. Penning S, LeCompte A, Moorhead K, Desaive T, Massion P, Preiser JC, Shaw G, Chase J: First Pilot Trial of the STAR-Liege Protocol for Tight Glycemic
Control in Critically Ill Patients. Computer Methods and Programs in
Biomedicine 2011, in-press.
23. Lin J, Lee, DS, Chase, JG, Hann, CE, Lotz, T and Wong, XW: Stochastic
Modelling of Insulin Sensitivity Variability in Critical Care. Biomedical
Signal Processing & Control 2006, 1:229-242.
24. Haynes RB, Yao X, Degani A, Kripalani S, Garg A, McDonald HP:
Interventions to enhance medication adherence. Cochrane Database Syst Rev
2005(4):CD000011.
25. Rood E, Bosman RJ, van der Spoel JI, Taylor P, Zandstra DF: Use of a
computerized guideline for glucose regulation in the intensive care unit improved both guideline adherence and glucose regulation. J Am Med Inform
Assoc 2005, 12(2):172-180.
26. Preiser JC, Devos P, Ruiz-Santana S, Melot C, Annane D, Groeneveld J, Iapichino G, Leverve X, Nitenberg G, Singer P et al: A prospective randomised
multi-centre controlled trial on tight glucose control by intensive insulin therapy in adult intensive care units: the Glucontrol study. Intensive Care Med 2009, 35(10):1738 - 1748.
27. Chase JG, Suhaimi F, Penning S, Preiser JC, Le Compte AJ, Lin J, Pretty CG, Shaw GM, Moorhead KT, Desaive T: Validation of a model-based virtual trials
method for tight glycemic control in intensive care. Biomed Eng Online 2010, 9:84.
28. Pretty C, Chase JG, Lin J, Shaw GM, Le Compte A, Razak N, Parente JD: Impact
of glucocorticoids on insulin resistance in the critically ill. Comput Methods
Programs Biomed 2011, 102(2):172-180.
29. Blakemore A, Wang S, LeCompte A, Wong X, Shaw G, Lin J, Lotz T, Hann C, Chase J: Model-based Insulin Sensitivity as a Sepsis Diagnostic in Critical
30. Lin J, Parente JD, Chase JG, Shaw GM, Blakemore AJ, Lecompte AJ, Pretty C, Razak NN, Lee DS, Hann CE et al: Development of a model-based clinical
sepsis biomarker for critically ill patients. Comput Methods Programs Biomed