O R I G I N A L A R T I C L E
The Right Dorsal Premotor Mosaic: Organization,
Functions, and Connectivity
Sarah Genon
1,2
, Hai Li
5,6
, Lingzhong Fan
5,6
, Veronika I. Müller
1,2
, Edna
C. Cieslik
1,2
, Felix Hoffstaedter
1
, Andrew T. Reid
1
, Robert Langner
1,2
,
Christian Grefkes
1,4
, Peter T. Fox
3
, Susanne Moebus
8
, Svenja Caspers
1
,
Katrin Amunts
1
, Tianzi Jiang
5,6,7
and Simon B. Eickhoff
1,2
1
Institute of Neuroscience and Medicine (INM-1, INM-3), Research Centre Jülich, Jülich, Germany,
2Institute
of Clinical Neuroscience and Medical Psychology, Heinrich Heine University, Düsseldorf, Germany,
3Research
Imaging Institute, University of Texas Health Science Center at San Antonio, TX, USA,
4Department of Neurology,
Cologne University Hospital, Cologne, Germany,
5Brainnetome Center, Institute of Automation and,
6National
Laboratory of Pattern Recognition, Institute of Automation, Chinese Academy of Sciences, Beijing 100190, China,
7
Key Laboratory for NeuroInformation of the Ministry of Education, School of Life Science and Technology,
University of Electronic Science and Technology of China, Chengdu 625014, China and
8Centre for Urban
Epidemiology (CUE), Universitätsklinikum Essen, University of Duisburg-Essen, Essen, Germany
Address correspondence to Simon B. Eickhoff, Institut für Neurowissenschaften und Medizin (INM-1), Forschungszentrum Jülich GmbH, D-52425 Jülich, Germany. Email: s.eickhoff@fz-juelich.de
Abstract
The right dorsal premotor cortex (PMd) of humans has been reported to be involved in a broad range of motor and cognitive functions. We explored the basis of this behavioral heterogeneity by performing a connectivity-based parcellation using meta-analytic approach applied to PMd coactivations. We compared our connectivity-based parcellation result with parcellations obtained through resting-state functional connectivity and probabilistic diffusion tractography. Functional connectivity profiles and behavioral decoding of the resulting PMd subregions allowed characterizing their respective behavior profile. These procedures divided the right PMd into 5 distinct subregions that formed a cognitive-motor gradient along a rostro-caudal axis. In particular, we found 1) a rostral subregion functionally connected with prefrontal cortex, which likely supports high-level cognitive processes, such as working memory, 2) a central subregion showing a mixed behavioral profile and functional connectivity to parietal regions of the dorsal attention network, and 3) a caudal subregion closely integrated with the motor system. Additionally, we found 4) a dorsal subregion, preferentially related to hand movements and connected to both cognitive and motor regions, and 5) a ventral subregion, whose functional profile fits the concept of an eye movement-related field. In conclusion, right PMd may be considered a functional mosaic formed by 5 subregions.
Key words: activation likelihood estimation, clustering, functional connectivity, parcellation, premotor cortex
Introduction
The premotor cortex (PM) has been defined as a distinct cortical region within the frontal agranular cortex (Wise 1985). The PM
is located in the lateral portion of Brodmann’s area 6 (BA; Brod-mann 1909) on the precentral gyrus, just rostral to the primary
Q2
motor cortex (M1, BA 4/Area 4;Geyer et al. 2000). However, the© The Author 2016. Published by Oxford University Press. All rights reserved. For Permissions, please e-mail: journals.permissions@oup.com doi: 10.1093/cercor/bhw065 Original Article 1 5 10 15 20 25 30 35 40 45 50 55 60 70 75 80 85 90 95 100 105 110 115 120 125
PM is not necessarily equivalent to BA 6, since the region defined as the PM is based on functional criteria, whereas BA 6 is identi-fied by cytoarchitectonic criteria (Brodmann 1909;Geyer et al. 2000). In nonhuman primates, the PM has been anatomically subdivided into a dorsal part (PMd) and a ventral part (PMv) (for a review, seeRizzolatti et al. 1998). In primates, the PMd has been further divided into rostral and caudal subregions based on dif-ferences in connectivity (Abe and Hanakawa 2009) and histology (i.e., cytoarchitecture and cytochrome C staining). The rostral subregion, termed F7 (Matelli et al. 1985,1991), is mainly con-nected to prefrontal regions, while the caudal subregion, termed F2 (Matelli et al 1991) is connected to the primary motor cortex and spinal cord (Boussaoud et al. 1995;Rizzolatti and Luppino 2001).
The dorso-ventral distinction in nonhuman primates shows correspondence with the subdivision of the human PM into PMd and PMv based on structural connectivity (Tomassini et al. 2007). A broad range of motor and cognitive functions, such as movement preparation, action selection, motor learning, goal sa-lience maintenance, visuospatial imagery, visual attention, and working memory, have been ascribed to the PMd in humans (for reviews, seeBoussaoud 2001;Schubotz and von Cramon 2003;Chouinard and Paus 2006;Hoshi and Tanji 2007;Abe and Hanakawa 2009;Kantak et al. 2012;Hoshi 2013). In conjunction with previously identified PMd subregions in nonhuman pri-mates (i.e., F2, F7), such behavioral heterogeneity suggests that the human PMd may not be a uniform region, but rather one com-prised several distinct subdivisions with specialized function and connectivity.
Several studies have suggested a rostro-caudal organization cor-responding to a cognitive-motor gradient within the frontal regions including the PMd (Yeo et al. 2011;Choi et al. 2012;Orban et al. 2014). Furthermore, several fMRI experiments have been performed to disentangle PMd activity related to cognitive versus motor pro-cessing, or hand versus eye movements by contrasting experimen-tal conditions in rather small samples of subjects (Hanakawa et al. 2002;Amiez et al. 2006). Finally, 1 study has suggested a ventrodor-sal organization within the superior part of precentral gyrus based on structural connectivity (Schubotz et al. 2010). However, neither these putative anatomical gradients nor their corresponding be-havioural and functional attributes have been directly investigated in the PMd, that is, using a quantitative data-driven approach. Fur-thermore, to date, no study has examined the connectivity profile of distinct modules within the PMd in humans at rest or challenged with a wide range of task demands.
Using a model-free, multimodal, connectivity-based approach, we sought in the current study to provide a robust, data-driven subdivision of the right PMd, as well as a meta-analytic functional characterization of the resulting subdivisions. Our work may thus provide independent support for the idea of a rostro-caudal organ-ization of the PMd, with rostral parts more strongly associated with cognitive functions, and caudal regions with motor functions and/or for the hypothesis of a ventrodorsal distinction. Our object-ive was to integrate previous work and hypotheses on the PMd. To best incorporate the findings of previous research lines, we opted for a broad definition of the right PMd, ensuring a maximal cover-age of previous activations attributed to this region. Importantly, the issue of the functional heterogeneity of the PMd is further complicated by indirect evidence of functional hemispheric differ-ences (Smith and Jonides 1999;Schubotz and von Cramon 2003), which might be based on differential subdivisions within the right and left PMd. Therefore, in the present study, we focused on the right PMd, while the organization of the left PMd will be addressed in a future study.
We performed connectivity-based parcellation (CBP) based on each voxel’s co-activation pattern across a wide range of active tasks (MACM-CBP;Eickhoff et al. 2011). Our objective was not so much to define a rigid set of borders for subregions within the right PMd, but rather to provide an integrative guide of the topo-graphical organization of this region. Accordingly, to ensure that the resulting general topographical pattern was not an artifact of the CBP modality, we performed additional CBP analyses based on the structural connectivity profile of the voxels, as measured by probabilistic diffusion tractography (PDT-CBP;Behrens et al. 2003;Johansen-Berg et al. 2004), and the functional connectivity profile, as measured during the resting state fMRI (RSFC-CBP). We next characterized the functional connectivity profile of the clus-ters obtained by MACM-CBP by combining resting-state functional connectivity (RSFC) analysis and MACM. Finally, quantitative func-tional decoding (Amft et al. 2014;Nickl-Jockschat et al. 2014) was performed to robustly characterize the profile of behavioral func-tions associated with each cluster obtained by MACM-CBP.
Methods
Volume of Interest
In the absence of precise landmarks of the borders of PMd, we based our volume of interest (VOI) definition on several meta-analyses that localized functions commonly attributed to the PMd. Our VOI was defined by merging PMd activation sites from published meta-analyses on action observation (Caspers et al. 2010), motor learning (Hardwick et al. 2013), movement perception (Grosbras et al. 2012), sustained attention (Langner and Eickhoff 2013), and working memory (Rottschy et al. 2012) using an or combination. The ensuing VOI was symmetrized to yield left and right PMd VOIs. Some activation clusters provided by the meta-analyses to some extend overlapped with primary motor cortex (M1) and pri-mary somatosensory cortex (S1). These areas were excluded based on their cytoarchitectonic definition (BA4a, 4p 3a, 3b, 1, 2) by using the SPM Anatomy Toolbox (Eickhoff et al. 2005). Thus, this procedure ensures that our VOI does not overlap with primary motor cortex on the caudal border as illustrated in Figure1. In contrast and import-antly, our VOI was not restricted to Area 6 on the rostral border.
Finally, white matter voxels were removed from VOI based on the International Consortium on Brain Mapping (ICBM) tissue probability maps (Mazziotta et al. 2001). This procedure yielded a
Figure 1.VOI definition. Rendering of sensorimotor areas (areas 1, 2, 3, and 4;
Q11
green) according to cytoarchitecture (Geyer et al. 1996,1999, available in the SPM anatomy toolbox) and our PMd VOI(red) in the right hemisphere.Q12
130 135 140 145 150 155 160 165 170 175 180 185 190 195 200 205 210 215 220 225 230 235 240 245 250 255right and a left PMd VOI, comprising 4143 voxels each (voxels size = 1 × 1 × 1) whose inferior and caudal borders are in agreement with previous definition of the PMd (seeSupplementary Methods I.1.). The following parcellation procedure was focused on the right PMd VOI.
Connectivity-Based Parcellation
We first performed CBP based on the co-activation profiles of our VOI’s voxels by using MACM. The most stable cluster solution (k solution) was chosen based on several criteria in a data-driven approach. To ensure that the revealed topographical organiza-tion was not an artifact of our methods based on activaorganiza-tion data (cf. discussion), we then searched for a similar k solution based on the structural connectivity profiles of the voxels by using CBP based on PDT (PDT-CBP) and based on the uncon-strained functional connectivity profiles of the voxels by using CBP based on RSFC (RSFC-CBP).
Parcellation Based on Co-activation (MACM-CBP). Meta-Analytic Con-nectivity Modeling. Whole-brain co-activation patterns for each voxel within the right PMd were determined by using the Brain-Map database (seeSupplementary Methods I.2. for a description of the criteria of inclusion of experiments). The experiments asso-ciated with each seed voxel were then defined by activation at, or in the immediate vicinity of, this particular voxel. This was per-formed by calculating the Euclidean distances between a given seed voxel and the individual foci of all experiments. Based on these distances, the extent of a spatial filter was systematically varied from including the closest 20 to 200 experiments in steps of 5. That is, we selected the 20, 25, 30, 35, . . . , 200 experiments re-porting activation closest to a given seed voxel. Combining the dif-ferent filter sizes allowed generating a highly robust co-activation map for every seed voxel independently of subjective choices about the number of associated experiments. This procedure, hence, provided a reliable basis for MACM-CBP, as shown in previ-ous studies (Cieslik et al. 2013;Clos et al. 2013).
The brain-wide co-activation profile for each seed voxel given each of the 37 filter sizes was then computed by a meta-analysis over the associated experiments. This meta-analysis was per-formed using the revised ALE algorithm (Eickhoff et al. 2012; seeSupplementary Methods I.3.for a description of the use of ALE for MACM). All resulting ALE scores were recorded. To take into account the complete brain-wide pattern of co-activation likelihood of each seed voxel, no height threshold was set at this point of analysis.
Connectivity-Based Parcellation Using Co-activation Patterns. The brain-wide co-activation profiles for all seed voxels were com-bined into a NS× NBconnectivity matrix. NSis the number of
seed voxels (i.e., 4143 voxels) and NBthe number of target voxels
in the reference brain volume at 4 × 4 × 4 mm3resolution (26 459
gray matter voxels). Altogether, 37 individual connectivity matri-ces were computed, each representing the connectivity of the seed voxels for a given filter size.
- . In line with previous parcellation studies (Klein et al. 2007; Kelly et al. 2012; Clos et al. 2013), the parcellation was performed using k-means clustering (see
Supplementary Methods I.4.for a description of k-means). In line with previous parcellation studies of multifunctional regions, we addressed a wide range of potential subdivisions (Kelly et al. 2010,2012;Kahnt et al. 2012). That is, we searched
for 2–11 different clustering solutions by making k ranging from 2 to 11, yielding 10 different clustering solutions within the right PMd (a 2-cluster solution, a 3-cluster solution, and so on, up to an 11-cluster solution). For each of the 370 (10 × 37) individual parcellations, the best solutions from 500 replications with a randomly placed initial centroid were computed.
Q3
. Like in a previous study (Clos et al. 2013), the optimal filter range was chosen based on the consistency of each voxel’s cluster assignment across the different filter sizes. Those analyses are reported in Supplementary Methods I.5. In all subsequent steps, the analysis was restricted to the parcellations based on co-activations as estimated from the nearest 85 to 145 experiments.- . In the next step, we determined the optimal clustering solution, that is, the parcellation that was most supported by the data. This choice was based on 3 criteria: 1) variation of information, 2) percentage of deviants, and 3) silhouette value. The full description of these criteria is provided in Supplementary Methods I.6. The above criteria identified a 5k solution as the most stable parcellation of the right PMd.
Parcellation Based on Probabilistic Diffusion Tractography (PDT-CBP). Data Acquisition and Preprocessing. Diffusion weighted imaging (DWI) data of 20 healthy adults were acquired using a 3.0 T GE MR Scanner (seeWang et al. 2015for a full description of the data sample and acquisition parameters). The data were prepro-cessed using FMRIB’s Diffusion Toolbox (FSL 4.0;http://www. fmrib.ox.ac.uk/fsl). The T1images obtained in diffusion space
were transformed to the ICBM-152 brain template while an in-verse transformation was performed to transform the VOI masks of the right PMd into the diffusion space for each subject. Diffusion probabilistic tractography was performed using the FSL package for each voxel in the PMd seed VOI to estimate the connectivity probability as described inWang et al. (2015). Cross-Correlation Matrix, Parcellation, and Maximum Probability Map of the k Solution. Cross-correlations (dimensions: number of seeds × number of seeds) between the connectivity patterns of all vox-els in the PMd seed VOI were calculated. The cross-correlation matrix was then permutated using spectral clustering (not spec-tral reordering). An edge-weighted centroidal Voronoi tessella-tions method for automated clustering was applied to define 5 clusters as revealed as the most stable cluster solution for MACM-CBP. Then, the maximum probability maps were created for each k solution across all the subjects (seeWang et al. 2015
for a full description of the CBP pipeline).
Parcellation Based on RSFC (RSFC-CBP). Data Acquisition and Prepro-cessing. EPI resting state data from 124 healthy subjects (age range: 18–59, mean ± standard deviation: 39.5 ± 11.5, 66 males) were acquired as part of the 1000 brains study (Caspers et al. 2014). A description of acquisition parameters is provided in
Supplementary Methods I.7. Functional image processing was performed using SPM8 (Wellcome Trust Centre for Neuroima-ging, London,http://www.fil.ion.ucl.ac.uk/spm/software/spm8). Prior to further analyses, the first 4 scans were discarded. Then, preprocessing of the EPI images included affine registration and normalization to MNI space using unified segmentation approach. A more comprehensive description of this procedure is available inSupplementary Methods I.7.
260 265 270 275 280 285 290 295 300 305 310 315 320 325 330 335 340 345 350 355 360 365 370 375 380
Cross-Correlation Matrix, Parcellation, and Maximum Probability Map of the k Solution. The time series were computed for each voxels when removing potentially noisy variance (seeSupplementary Methods I.7.for a description of the procedure). Linear (Pearson) correlations between the time series of each seed voxels (cluster) and all other gray matter voxels were computed and z-transform to quantify RSFC. The individual connectivity matrices of the seeds voxels with the whole-brain gray matter voxels. k-Means (with k ranging from 2 to 9) was then performed on the individual connectivity matrices. Finally, the maximum probability maps were created for each k solution across all the subjects.
Multimodal Functional Connectivity of the
MACM-CBP-Derived Clusters
Following the parcellations of the seed region, we examined the functional connectivity profile of each cluster by performing add-itional MACM and RSFC analyses of the obtained clusters. While MACM provides the co-activation pattern of the clusters across a wide range of active tasks, RSFC provides the complementary, task-free measure of functional connectivity of these clusters (Eickhoff et al. 2011).
We first computed the whole-brain connectivity pattern of each cluster and then examined the commonalities among clusters as well as the differences between them. In other words, for each modality (MACM and RSFC), we statistically tested both the conjunction of all clusters and the contrasts between them.
Task-Related Functional Connectivity (MACM).Main Effects. For each obtained PMd subregion, an ALE meta-analysis was performed across all BrainMap experiments featuring at least one focus of activation within each of the derived clusters using the same approach as described above. In contrast to the MACM underlying CBP, where ALE maps were not thresholded to retain the com-plete pattern of co-activation likelihoods, we now performed statistical inference by testing the observed ALE scores from the actual meta-analysis against ALE scores obtained under the null distribution of random association of foci between experiments. A full description of this procedure is provided inSupplementary Methods I.8. This test yielded a P value based on the proportion of equal or higher random values. The resulting nonparametric P values were transformed into z-scores and thresholded at a cluster level with family-wise error rate (FWE)-corrected P < 0.05 (cluster-forming threshold at voxel level: P < 0.001).
To identify task-related co-activation common to all clusters, we computed the overlap between the brain-wide co-activation patterns of all MACM-CBP-derived clusters using a minimum-statistic conjunction (Nichols et al. 2005).
Contrasts. To compare the brain-wide co-activation pattern between clusters, we first computed the voxel-wise differences between the ensuing ALE maps. Each of these difference scores was then compared with a null distribution. A full description of this procedure is provided inSupplementary Methods I.8. This test yielded a posterior probability P testing that the differ-ence was not due to random noise in an exchangeable set of labels based on the proportion of lower differences in the random exchange. The resulting probability values were then thre-sholded at P > 0.95 (95% chance for true difference) and masked by the respective main effects, that is, the significant effects of the MACM for the minuend (e.g., the difference “Cluster 1− Cluster 2” was inclusively masked by the main effect of Cluster 1).
Finally, we computed the specific co-activation pattern for all derived clusters, that is, brain regions significantly more co-activated with a given cluster than with any of the other clusters. This was achieved by performing a minimum-statistic conjunc-tion across the results of the 4 contrasts between a given cluster and the remaining others.
RSFC for Each Cluster
RSFC analyses were performed on the normalized resting-state fMRI images as described at 2.2.3.1. and in Supplementary Methods I.7. These latter were first smoothed by a 5-mm full-width at half-maximum (FWHM) Gaussian kernel to improve signal-to-noise ratio and to compensate for residual anatomical variations.
Time series of the seed region were extracted for all gray mat-ter voxels. The clusmat-ter time course was then expressed as the first eigen variate of these voxels’ time courses. Linear (Pearson) cor-relations between the time series of each seed region (cluster) and all other gray matter voxels were computed to quantify RSFC. These voxel-wise correlation coefficients were then trans-formed into Fisher’s z-scores. These Fisher’s z-scores were entered into a flexible factorial model to test for consistency across subjects, testing for the significance of the main effects of connectivity for each cluster as well as the differences between the clusters.
The CBP-derived clusters were used as seeds for the RSFC ana-lyses. In correspondence with the MACM analyses described above and in line with previous studies (Clos et al. 2013), we first calculated RSFC shared by all MACM-CBP-derived clusters. This was achieved by computing a conjunction across the main effect of positive connectivity of all clusters. Second, we exam-ined the specific co-activation pattern of each cluster. These pat-terns were obtained by performing a conjunction analysis, for each cluster, across the contrasts between the main effect of a given cluster and all other clusters. All analyses were thresholded at P < 0.05 (cluster FWE-corrected, cluster-forming threshold: P < 0.001).
Shared Task-Related and RSFC: Conjunction Across MACM and RSFC Results
For cross-validation, the results shared between both MACM and RSFC analyses were then examined for each cluster using a min-imum-statistic conjunction. This procedure aimed to character-ize the whole-brain connectivity pattern that is similar in resting state and in MACM (cf.Bzdok et al. 2013;Cieslik et al. 2013;Clos et al. 2013). We performed the conjunction between RSFC and MACM for 1) Common pattern for all clusters and 2) Specific pattern of each cluster (i.e., differences between clus-ters). For all these conjunction analyses, only cluster extend ≥10 voxels were further reported.
Functional Characterization of the MACM-CBP-Derived
Clusters
Forward and Reverse Inference on BrainMap Meta-data
Functional characterization of the right PMd clusters revealed by MACM-CBP was performed using the “behavioral domain” (BD) and “paradigm class” (PC) meta-data of the included experiments as assigned in the BrainMap database (Laird et al. 2009). A de-scription of the behavioral processes covered by the Brainmap paradigm class taxonomy may be found athttp://brainmap.org/ taxonomy/paradigms.html. BDs include the main categories “cognition, action, perception, emotion, interoception,” as well as their respective subcategories. In turn, PCs categorize the 385 390 395 400 405 410 415 420 425 430 435 440 445 450 455 460 465 470 475 480 485 490 495 500 505 510
specific task employed. To characterize the individual functional profile of each cluster, we performed quantitative “forward inference” and “reverse inference” as has been done in previous parcellation studies (Bzdok et al. 2013;Cieslik et al. 2013;Clos et al. 2013). In the forward inference approach, a cluster’s func-tional profile is assessed by identifying taxonomic labels for which the probability of finding activation in the respective clus-ter is significantly higher than finding activation for that label across the whole database by chance. Significance was deter-mined using a binomial test (P < 0.05 corrected for multiple comparisons using Bonferroni’s method; Clos et al. 2013;
Rottschy et al. 2013). That is, we tested whether the conditional probability of activation in a particular region given a particular label [P(Activation|Task)] was higher than the baseline probabil-ity of activating this particular region [P(Activation)]. In the reverse inference approach, a cluster’s functional profile was determined by identifying the most likely BDs and PCs given ac-tivation in a particular cluster, that is, the likelihood P(Task|Acti-vation). This likelihood can be derived from P(Activation|Task) as well as P(Task) and P(Activation) using Bayes’ rule. Significance (at P < 0.05, corrected for multiple comparisons) was then as-sessed by means of a χ2test. In sum, forward inference assessed
the probability of activation given a behavioral label, whereas reverse inference assessed the probability of each behavioral label given an activation.
As done previously, we also performed contrast analyses between the different clusters’ functional profiles. These con-trasts were, in turn, constrained to those experiments in Brain-Map activating either cluster. From this pool of experiments, the base rate is the a priori probability of any focus to lie in either of the 2 compared clusters given that it is located in any of them. Forward inference here compared the activation probabilities between the 2 clusters given a task compared with the a priori base rate. This was again achieved by means of a binomial test (P < 0.05, corrected for multiple comparisons). In the reverse in-ference approach, we compared the occurrence probabilities of the tasks given activation in 1 cluster (rather than in the other). This probability comparison was again achieved by means of a χ2test (P < 0.05, corrected for multiple comparisons).
Results
Cortical Parcellation Based on Connectivity Pattern
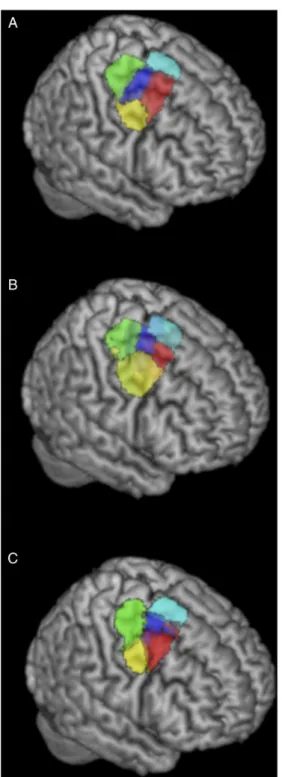
As our study aimed to distinguish functional subregions (i.e., clusters) in the right PMd, we first examined the most stable clus-ter solution obtained with CBP based on MACM across a wide range of k-solutions (from k = 2 to k = 11). We then investigated whether the topographical organization revealed by the ensuing solution could be supported by CBP based on other modalities. In particular, we performed PDT-CBP and RSFC-CBP, again evaluat-ing different cluster solutions (in the vicinity of the k = 5 solution found for MACM) based on their inter-subject stability. Cortical Parcellation Based on Co-activation Pattern (MACM-CBP) The information, separation, and consistency criteria jointly identified the 5-cluster (5k) solution as the best among the 10 k-means clustering solutions. The splitting of the 5 clusters into functional space is illustrated inSupplementary Figure 3and described inSupplementary Results II.1while the resulting 5 clusters are illustrated in Figure2A.The rendering of the 5 clusters separately on coronal plans with the respective number of voxels and MNI coordinates of their respective center of gravity are illustrated inSupplementary
Figure 3B. In addition, MNI coordinates of their borders are listed inSupplementary Results II.2,and the derived subregions in MNI volume space are available athttp://anima.fz-juelich.de/studies/ Genon_CBPrightPMd_2016. The location of the clusters high-lights a rostro-caudal organization along the superior and middle frontal gyri. This organization includes a rostral cluster that lies anteriorly to the precentral gyrus; a central cluster that lies at the intersection of the precentral sulcus and the superior/middle frontal gyri; and a caudal cluster that is located at the posterior Figure 2. Rendering of the 5k solution yielded by different CBP modalities in the right PMd. (A) 5k solution yielded by MACM-CBP. (B) 5k solution yielded by PDT-CBP. (C) 5k solution yielded by RSFC-PDT-CBP. 515 520 525 530 535 540 545 550 555 560 565 570 575 580 585 590 595 600 605 610 615 620 625 630 635 640
part of the precentral gyrus. The location of the clusters further suggests a ventrodorsal organization with a ventral cluster adja-cent to ventral PM and mainly overlapping with the preadja-central gyrus; the previously mentioned central cluster; and a dorsal cluster adjacent to inter-hemispheric premotor areas. For con-venience, hereafter the clusters are labeled according to their anatomical location (i.e., rostral, caudal, central, ventral, and dorsal).
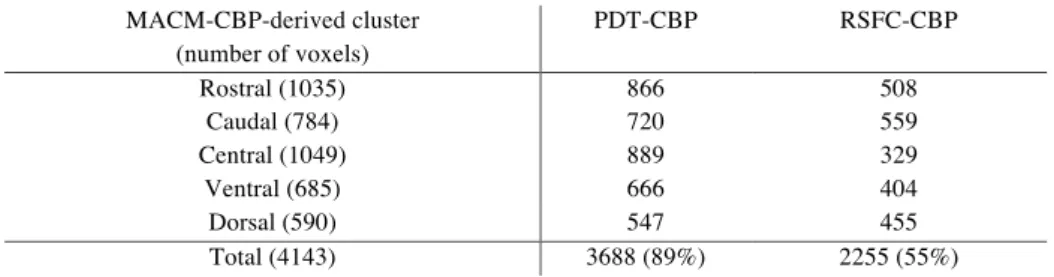
5-Cluster (5k) Solution Revealed by Structural Connectivity Pattern (PDT-CBP) and Unconstrained Functional Connectivity (RSFC-CBP) The 5k solution identified by PDT-CBP showed good correspond-ence with the 5k solution identified by MACM-CBP with both ros-tro-caudal and ventrodorsal differentiation and a centrally located cluster (Fig.2B). Based on the topographical similarities between the 5 MACM-CBP-derived cluster and the 5 PDT-CBP clusters, we computed the percentage of overlap between each pair of corresponding cluster. Those results are available in Sup-plementary Table 1.
The 5k solution yielded by RSFC-CBP is illustrated in Figure2C. Matching MACM-CBP and PDT-CBP, it revealed a rostro-caudal or-ganization and a ventrodorsal oror-ganization including and a cen-trally located cluster on the superior posterior frontal sulcus. We nevertheless note that the rostral and central border are less dif-ferentiated at the location of the superior frontal sulcus empha-sizing that the rostro-caudal organization should be considered in term of gradient and not as spatially segregated subregions.
Examination of the stability of PDT-CBP-derived parcellation across resampling (half split) revealed that several k solutions show good stability. In particular, stability significantly increases (as reflected by both Cramer V and Normalized Mutual Informa-tion) from k = 3 to k = 4 and from this latter k solution to k = 5. In contrast, stability does not increase from k = 5 to k = 6 suggesting that we reach a local optimum at k = 5. Thus, the 5k solution is relatively well supported by DWI data. In contrast, examination of percentage of deviants and silhouette value across subjects in-dicated a general pattern of slightly linearly decrease of stability/ consistency as k increases in RSFC-CBP. Nevertheless, examin-ation of VI between subjects across k solutions showed that while VI tends to decrease from k = 4 to k = 5, it significantly increase from k = 5 to k = 6 suggesting that we also reach a local optimum at k = 5 with RSFC-CBP.
The overlap in term of number of voxels in the voxels between the 5k parcellation revealed by MACM-CBP and the 5k parcella-tion revealed by the 2 other CBP modalities is described in
Supplementary Results III.3.
Functional Connectivity of the Clusters Yielded by
MACM-CBP
Common Functional Connectivity Patterns
The functional connectivity profile common to all clusters across both MACM and RSFC as well as functional connectivity profile common to all clusters only revealed by MACM are detailed in Table1.
The results of the conjunction across the functional connect-ivity patterns of all 5 clusters across both MACM and RSFC analyses identified 2 regions common to all 5 clusters: postero-medial frontal cortex (SMA/pre-SMA) and the central cluster. That is, aside from common local connectivity with the central cluster, the postero-medial frontal cortex was the only brain re-gion that showed consistent functional coupling with all identi-fied clusters. Nevertheless, examination of the connectivity profile only observed by MACM additionally revealed that all
clusters were co-activated with the bilateral IPS [Area hlP2/hlP3 (Choi et al. 2006)], the bilateral Area 44 (Amunts et al. 1999), the bilateral anterior insula, the bilateral prefrontal thalamus ( Beh-rens et al. 2003), and the right pallidum. In contrast, RSFC re-vealed that all clusters were commonly coupled with the right rostral and ventral clusters and the primary somatosensory cor-tex [Area 2; (Grefkes et al. 2001)] extending to supramarginal gyrus [Area PFt (Casper et al. 2006,2008)].
Cluster-Specific Functional Connectivity Patterns
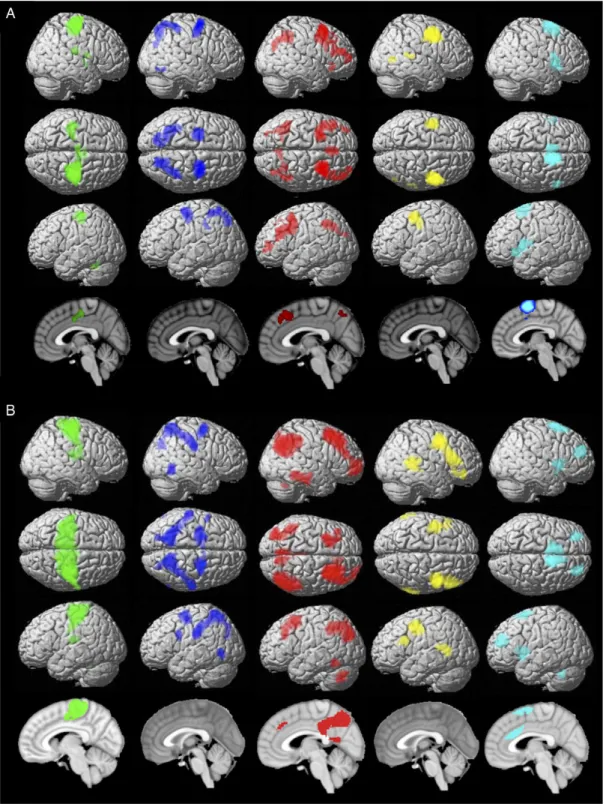
Contrasting each cluster’s functional connectivity patterns with those of all 4 other clusters identified each cluster’s specific func-tional connectivity pattern. These findings are detailed in Table1
and illustrated in Figure3. For the sake of robustness of the high-lighted functional connectivity profile, we mainly relied on the conjunction of unconstrained specific functional connectivity (as assessed with RSFC) and task functional connectivity (as as-sessed with MACM) as illustrated in Figure3C. However, for the sake of completeness, we additionally examined the pattern yielded by RSFC (Fig.3A) and the pattern yielded by MACM (Fig.3B) separately. Nevertheless, the divergence between both approaches is discussed inSupplementary Discussion III.1.1.
Both approaches (RSFC and MACM) indicated specific con-nectivity of each cluster with a homotopic cluster in the left hemisphere. Each cluster showed additional specific connectiv-ity profile reposted below.
Rostral Cluster. Both approaches showed that the rostral cluster was specifically connected to bilateral intraparietal sulcus [IPS: areas hIP1/hIP2 (Scheperjans et al. 2008)], lateral prefrontal cortex LPFC, midcingulate cortex and the right precuneus.
MACM further revealed that the rostral cluster was function-ally coupled with the left ventral LPFC and the dorsomedial pre-frontal cortex (DMPFC) while RSFC additionally revealed that it was functionally connected to the bilateral cerebellum lobule VII (Diedrichsen et al. 2009), the bilateral inferior temporal gyrus, the left precuneus, the right subiculum, and the right fusi-form gyrus.
Caudal Cluster. Both approaches revealed that the caudal cluster was specifically connected to bilateral M1 [area 4p (Geyer et al. 1996)], bilateral SMA extending into midcingulate cortex, left cerebellum [lobule IV/V (Diedrichsen et al. 2009)], and right par-ietal operculum [areas OP1/OP3 (Eickhoff et al. 2006)] and frontal operculum.
MACM further revealed that the caudal cluster was function-ally coupled with the posterior insula, the thalamus [premotor and prefrontal (Behrens et al 2003)], and the right putamen while RSFC additionally revealed functional connectivity of this cluster with parietal operculum subarea OP3/OP4 (Eickhoff et al. 2006).
Central Cluster. Both approaches showed that the central cluster was specifically connected to bilateral IPS (area hlP3) extending to superior parietal lobule [SPL: areas 7A/7PC/5l (Scheperjans et al. 2008)].
MACM further revealed that the central cluster was function-ally coupled to the right fusiform gyrus [Area FG1/FG2 (Caspers et al. 2013)] and the left primary sensorimotor areas [Area 2 (Grefkes et al. 2001); Area 3b (Geyer et al. 1999)] while RSFC add-itionally revealed that it was functionally connected to left Bro-ca’s area [Area 44 (Amunts et al. 1999)], bilateral inferior parietal lobule [Area 2 (Grefkes et al. 2001); Area PFt & Area PFop; (Caspers et al. 2006,2008)], and middle occipital gyrus. 645 650 655 660 665 670 675 680 685 690 695 700 705 710 715 720 725 730 735 740 745 750 755 760 765
Table 1 Common and specific functional connectivity of the 5 MACM-CBP-derived clusters across tasks (MACM) and rest (RSFC)
Region Overlap with
cytoarchitectonic area
x y z Cluster size
Common to all clusters Tasks and rest
Central cluster R NA 32 −3 57 107
Left PMd (central cluster’s homotope) L NA −33 −8 55 50
SMA/pre-SMA L NA −8 5 51 58 R NA 5 8 49 13 R NA 6 4 64 10 Tasks only IPS L hlP3i −34 −50 51 663 R hlP2/hlP3d,i 39 −47 50 189
Broca’s area R Area 44a 54 9 28 305
L Area 44a −53 6 31 256
Thalamus R Prefrontal thalamusj 12 −14 7 191
L Prefrontal thalamusj −11 −16 7 171
Anterior insula R NA 36 23 1 165
L NA −34 23 1 162
Basal ganglia R Pallidum/putamen 19 3 3 23
Rest only
Rostral and ventral clusters R NA 26 −3 55 1369
Right somatosensory-cortex/supramarginal gyrus R Area 2c/Area PFtl 50 −32 48 301
Specific to rostral PMd Tasks and rest
Left homotope L NA −27 9 52 332 Middle frontal L NA −40 29 33 166 Middle frontal R NA 30 8 42 1272n 33 21 42 44 48 20 48 36 24 Fp1b 30 58 10 MCC R NA 7 26 42 19 Inferior parietal/IPS R hlP1/hlP2d 42 −57 41 498 L −38 −58 41 389 Precuneus R NA 8 −62 50 63 Tasks only
Inferior frontal gyrus L NA −38 14 37 1071
R NA 32 29 −7 134
Rest only
Inferior temporal gyrus R NA 62 −34 −18 601
L −57 −54 −15 160
Precuneus L NA −6 −58 45 629
Cerebellum L Lobule VIIag −38 −65 −37 519
R 34 −62 −33 100
Medial temporal lobe R Subiculum 29 −32 −18 318
Fusifurm gyrus R NA −30 −40 −14 193
Specific to caudal PMd Tasks and rest
Primary motor R Area 4pe 34 −26 60 1492o
Cortex L Area 4pe −36 −29 60 535o
Left homotope
SMA/Midcingulate cortex R NA 8 −10 50 153
L −5 −16 53 67
Cerebellum L Lobule VI/Vg −18 −57 −20 350
Parietal operculum R Area OP1/OP3h 47 −21 20 78
Frontal operculum R NA 44 −3 14 16
Tasks only
Putamen R NA 31 −6 −1 66
Thalamus R Prefrontal/premotor thalamusj 14 −19 8 60
Posterior insula R NA 43 1 12 44
Rest only
Parietal operculum L Area OP3/OP4h −42 −21 18 366
Continued 770 775 780 785 790 795 800 805 810 815 820 825 830 835 840 845 850 855 860 865 870 875 880 885 890 895
Table 1 Continued
Region Overlap with
cytoarchitectonic area
x y z Cluster size
Specific to central PMd Tasks and rest
IPS/superior R Area 7Ai/Area7PCi/hlP3i 26 −58 57 405
Parietal lobule L Area 7Ai/Area 7PCi/Area 5li −28 −56 61 335
Area 7Ai −19 −75 44 71
−14 −67 58 33
Left homotope L NA −25 −8 56 553
Tasks only
Fusiform gyrus R Area FG1/FG2k 38 −68 −12 65
Somatosensori area L Area2c/Area 3be,f −38 −36 48 13
Rest only
Inferior parietal lobule R Area2c/Area PFtl/Area PFopl 35 −41 48 1656
L −34 −44 47 1848
Middle occipital gyrus L NA −23 −76 32 136
R 29 −74 34 112
Broca area L Area 44a −52 6 29 133
Specific to ventral PMd Tasks and rest
Superior temporal R NA 59 −41 12 49
Left homotope L NA −46 −4 48 356
Tasks only
Visual cortex R hOc5m 50 −66 5 68
Rest only
Inferior frontal R Area 45a 46 17 23 1277
Gyrus L −44 17 25 355
R NA 43 34 −7 259
Posterior middle R NA 60 −44 8 660
Temporal gyrus L NA −58 −51 10 355
Specific to dorsal PMd Tasks and rest
Left homotope L NA −8 4 64 126
Inferior frontal gyrus/insula R NA 49 10 3 105
L −49 7 2 85
Putamen R NA 25 11 2 55
MCC R NA 10 10 40 22
Tasks only
Broca’s area L Area 44a −52 10 3 505
R Area 44/45a 55 15 6 325
Rest only
Middle frontal gyrus R NA 27 48 24 511
L −30 46 22 468
Anterior cingulate cortex L NA −8 18 31 496
R 9 20 30 462
Cerebellum L Lobule VIIag −42 −54 −33 139
Pre-SMA R NA 9 24 60 59
Note: NA, not assigned to any known probability map/not applicable.
aAmunts et al. (1999). bBludau et al. (in press). cGrefkes et al. (2001). dChoi et al. (2006). eGeyer et al. (1996). fGeyer et al. (1999). gDiedrichsen et al. (2009). hEickhoff et al. (2006). iScheperjans et al. (2008). jBehrens et al. (2003). kCaspers et al. (2013).
lCaspers et al. (2006);Caspers et al. (2008). mMalikovic et al. (2007).
nThe region is part of the local connectivity of the rostral PMd itself (1083 voxels).
oThe region is part of the local connectivity of the caudal PMd itself (1765 voxels) in the right hemisphere or its left-side homotope in the left hemisphere; CBP,
Co-activation-based parcellation; MACM, meta-analytic connectivity modeling; RSFC, resting state functional connectivity; PMd, dorsal Premotor Cortex; IPS, intraparietal sulcus; SMA, supplementary motor area.
900 905 910 915 920 925 930 935 940 945 950 955 960 965 970 975 980 985 990 995 1000 1005 1010 1015 1020
Ventral Cluster. Both approaches indicated that the ventral cluster was specifically connected to the right posterior superior tem-poral gyrus.
MACM further revealed that the ventral cluster was coacti-vated with right visual extrastriate cortex [hOC5 (Malikovic et al. 2007)] while RSFC showed that it was also connected to
the bilateral posterior middle temporal gyrus and the bilateral ventral PFC [inferior frontal gyrus including Area 45 (Amunts et al. 1999)].
Dorsal Cluster. Both approaches indicated that the dorsal cluster was specifically connected to bilateral inferior frontal gyrus
Figure 3. Specific functional connectivity profile of the MACM-CBP-derived subregions. Color code: green = caudal cluster, blue = central cluster, red = rostral cluster, yellow = ventral cluster, light blue = dorsal cluster. (A) RSFC. (B) Task functional connectivity (MACM). (C) Conjunction of RSFC and MACM functional connectivity profile for each cluster.
1025 1030 1035 1040 1045 1050 1055 1060 1065 1070 1075 1080 1085 1090 1095 1100 1105 1110 1115 1120 1125 1130 1135 1140 1145 1150
slightly extending to the insula, the right putamen, and the right MCC.
MACM further revealed that the ventral cluster was coacti-vated with Broca’s area [Area 44 (Amunts et al. 1999)] while RSFC revealed that it was functionally connected to middle front-al gyrus, bilaterfront-al ACC, left cerebellum [lobule VII, (Diedrichsen et al. 2009)], and right pre-SMA.
Functional Characterization of the Clusters Yielded by
MACM-CBP
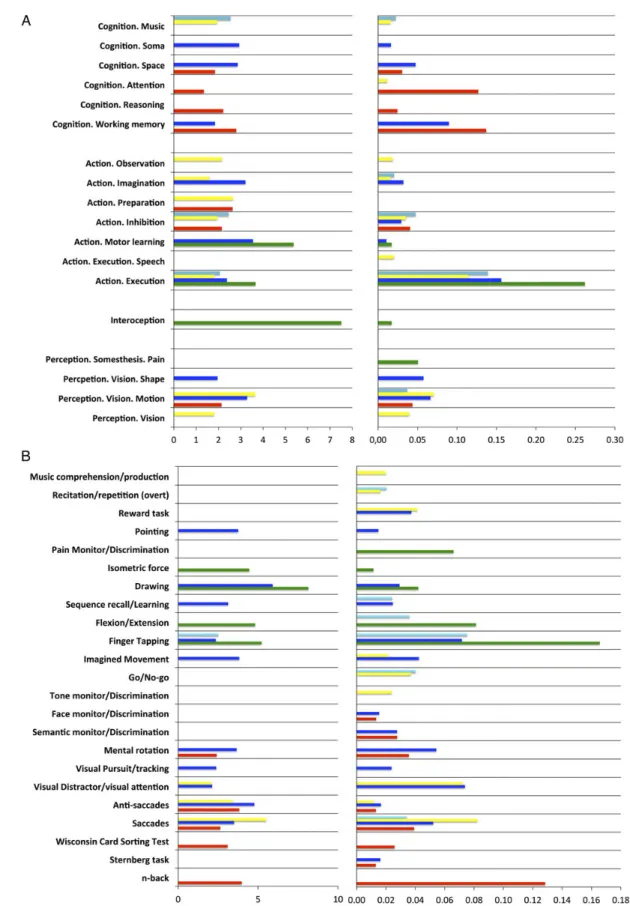
Forward and Reverse Inference on BrainMap Taxonomic Meta-data Functional characterization of the 5 right PMd clusters was per-formed by forward and reverse inference on the taxonomic labels (BDs and PCs) provided by the BrainMap database (Laird et al. 2009). BDs and PCs significantly associated with each cluster across both forward and reverse inference are illustrated in Fig-ure5and summarized in Figure4. A description of the behavioral processes covered by the Brainmap paradigm class taxonomy may be found athttp://brainmap.org/taxonomy/paradigms.html. As shown in Figure4A, some paradigms appeared to be re-lated to several clusters across both forward and reverse infer-ence. In particular, the central cluster showed a common paradigm profile with the caudal cluster regarding the PCs finger tapping and drawing. In addition, it showed a common paradigm profile with the rostral and ventral clusters regarding saccades and anti-saccades. Furthermore, the central and rostral clusters showed a common association with the PC “mental rotation.” Fi-nally, it shared visual distractor processing/visual attention with the ventral cluster.
Furthermore, there were several PCs specifically related to 1 particular cluster. In particular, cognitive paradigms such as the n-back task or the Wisconsin Card Sorting Test were
specifically related to the rostral cluster. In contrast, paradigms targeting basic motor performance, such as finger flexion/exten-sion or isometric force paradigms, were specifically related to the caudal cluster. Finally, imagined movements, sequence learning, and visual pursuit/tracking paradigms were specifically asso-ciated with the central cluster.
Synthesizing these findings, the functional characterization ac-cording to PCs thus revealed that the rostral cluster was mainly as-sociated with paradigms engaging higher cognitive functions such as working memory. In contrast, the caudal cluster was mainly re-lated to paradigms targeting motor functions. In turn, the ventral cluster was mainly associated with visual attention and eye move-ment paradigms, whereas the dorsal cluster was preferentially as-sociated with paradigms engaging hand movements such as finger tapping. Finally, the central cluster showed a mixed pattern of asso-ciations including paradigms targeting motor functions, visual at-tention/eyes movements, and spatial cognition.
As illustrated in Figure4B, the functional characterization according to BDs of the BrainMap database corroborated the above-described pattern emerging from the PC analysis and fur-thermore showed that while the central cluster was specifically associated with action imagination, the ventral cluster was spe-cifically associated with vision.
The likelihood ratio and probabilities values associated to each significant behavioral label for each cluster are illustrated in Figure5while the results of the contrast analyses between the different clusters’ functional profiles are illustrated in
Figure S4. These results revealed a cognitive-motor gradient along the rostro-caudal axis. The rostral cluster was more related to higher cognitive functions than the central one, which was, in turn, more related to higher cognitive functions than the caudal one. For example, the rostral cluster was more related to working memory than the central one, but this latter was more associated Figure 3. Continued. 1155 1160 1165 1170 1175 1180 1185 1190 1195 1200 1205 1210 1215 1220 1225 1230 1235 1240 1245 1250 1255 1260 1265 1270 1275 1280
with working memory than the caudal cluster. Motor functions showed the opposite pattern. For example, the caudal cluster was more associated with action execution than the central one, but this latter was more associated with action execution than the rostral cluster.
The contrast analyses furthermore highlighted that the ven-tral cluster showed the strongest association with eye move-ments/visual attention. Interestingly, the contrast analyses also showed that both the ventral and dorsal clusters were more re-lated to speech functions than the rostral and the central ones. In addition, the dorsal cluster was more related to music cogni-tion than the rostral and caudal clusters. However, the ventral and dorsal clusters differed in their functional profiles since the contrast between them revealed that while the ventral one was more associated with eye movements/visual attention, the dor-sal one was more related to finger tapping.
Discussion
Using MACM-CBP, we found 5 distinct clusters within right PMd, which were corroborated by complementary structural and
resting-state functional clustering approaches. Furthermore, by combining task-related (MACM) and task-free (RSFC) analyses, we characterized the whole-brain functional connectivity pat-terns of these 5 clusters. We finally used a meta-analytic ap-proach to assign each of the 5 clusters a specific behavioral functional profile that complements the observed parcellation.
Consistent PMd Clustering Patterns Across Modalities
After testing a range of possible granularities based on co-activa-tion patterns across studies (MACM), the 5-cluster (5k) soluco-activa-tion was found to be optimally stable. It is noteworthy, however, that the choice of the cluster solution is an ill-posed problem (Eickhoff et al. 2015;Ryali et al. 2015), particularly since brain ac-tivity is likely characterized by multiple levels of organization (Bellec 2013). While we focused here on 1 particular scale, consid-eration of other scales may well provide additional insight into the neurobiological organization of the right PMd.The selected 5k solution consisted of 1) a rostral cluster adja-cent to prefrontal cortex, 2) a adja-central cluster at an intermediate lo-cation (and adjacent to all other ones), 3) a caudal cluster adjacent Figure 4. Summary of functional characterization of the clusters yielded by MACM-CBP as jointly reflected by forward and reverse inference. (A) Functional characterization according to the BrainMap paradigm classes. (B) Functional characterization according to the BrainMap behavioral domains.
1285 1290 1295 1300 1305 1310 1315 1320 1325 1330 1335 1340 1345 1350 1355 1360 1365 1370 1375 1380 1385 1390 1395 1400 1405
Figure 5. Functional decoding of the 5 right PMd clusters according to Brainmap. Functional decoding following forward inference expressed as likelihood ratio (left) and reverse inference expressed as probabilities (right). Color code: red, rostral; blue, central; green, caudal; yellow, ventral; light blue, dorsal. (A) Behavioral domains. (B) Paradigm classes. 1410 1415 1420 1425 1430 1435 1440 1445 1450 1455 1460 1465 1470 1475 1480 1485 1490 1495 1500 1505 1510 1515 1520 1525 1530 1535
to M1, 4) a ventral cluster adjacent to the PMv, and 5) a dorsal clus-ter bordering the medial premotor areas. This organization of the right PMd along both rostro-caudal and ventrodorsal axes was corroborated by additional parcellations based on structural con-nectivity (PDT) and unconstrained functional concon-nectivity (RSFC). This cross-modal convergence suggests that the spatial organization of the right PMd revealed by MACM-CBP is robust across structural and functional criteria. It is important to high-light that the clusters’ respective borders did not perfectly match across CBP modalities, suggesting that our methods have identified a topographical organization rather than a rigid set of borders. In particular, the rostro-caudal organization may be reflective of a gradient rather than sharply segregated subre-gions. Such a gradient mirrors the rostro-caudal organization suggested in nonhuman primates (see below) and corroborates at least one previous fMRI study in humans, in which it was asso-ciated with a cognitive-motor gradient (Orban et al. 2014).
Five Functional Subregions Within the Right PMd
Rostral PMd: Higher Cognitive ProcessesBoth the MACM and RSFC analyses revealed that the rostral PMd cluster was specifically functionally coupled with the midcingu-late cortex, bimidcingu-lateral LPFC, and the IPS/inferior parietal regions. These regions are known to support higher cognitive functions such as executive functions (Collette et al. 2006), vigilant atten-tion (Langner and Eickhoff 2013), and working memory (Rottschy et al. 2012). This cluster was also functionally connected with the precuneus, a region that is known to play a role in higher order visuospatial processes such as covert shift of attention and ab-stract mental imagery tasks (Cavanna and Trimble 2006). In line with this view, functional characterization across forward and re-verse inference revealed that this cluster was engaged in func-tions such as working memory. In other words, the rostral cluster might be engaged in higher, potentially dynamic aspects of visuospatial imagery, which may possibly include short-term memory encoding of a location (Langner et al. 2014), mainten-ance of spatial information (including spatial rehearsal), and spa-tial updating. This cluster might also play a role in working memory even when the content is not overtly spatial (Nee et al. 2013).
The rostral cluster reported here bears similarity to area F7, the rostral subdivision of the PMd in nonhuman primates (Matelli et al. 1985,1991). This region predominantly receives prefrontal inputs (Boussaoud et al. 1995;Rizzolatti and Luppino 2001) and contains neurons that are active when the animal engages cogni-tive functions such as spatial attention or memory (Boussaoud 2001;Lebedev and Wise 2001). In humans, a similar rostral PMd subregion, termed “pre-PMd,” has been proposed, and connectiv-ity between the pre-PMd and the prefrontal cortex has been sug-gested (Picard and Strick 2001). Similarly, previous functional studies have demonstrated that the most rostral part of the PMd (or pre-PMd) is frequently engaged in high-level cognitive operations (Hanakawa 2011), such as complex mental calcula-tions (Zago et al. 2001). This evidence implies that our rostral cluster roughly corresponds to the proposed human pre-PMd and may be considered a potential homologue to F7 in the non-human primate. Of note, as there is currently no widely accepted landmark separating PM and prefrontal cortex, the rostral cluster found in the present study cannot be strictly considered a pre-motor region. In our study, the location of the rostral cluster, which is anterior to the precentral gyrus, leads us to consider it a transitional region in the ill-defined premotor-prefrontal di-chotomy. Furthermore, its behavioral functional profile supports
its consideration as a functional component of the prefrontal cor-tex, rather than a premotor module sensu-stricto.
Caudal PMd: Motor Functions
Task-based and RSFC analyses revealed that the most caudal PMd cluster is likely part of the brain’s motor system, including bilateral M1, SMA, and the left cerebellum. The caudal cluster was also specifically functionally connected to right fronto-par-ietal operculum, which has been shown to support higher order somatosensory and sensorimotor processing (Eickhoff et al. 2010). Supporting this view, functional characterization of the caudal cluster revealed that it is engaged in action execution, motor learning, and interoception. It is thus likely that several functions that have frequently been assigned to the whole PMd are primarily subserved by this caudal subdivision. Such pro-cesses include 1) the creation of internal representations of ac-tion (or pragmatic body maps) which serve movement generation, understanding, and learning (Rizzolatti and Luppino 2001;Schubotz and von Cramon 2003), and 2) the organization of movement or action formulation (Schubotz and von Cramon 2003).
In line with our finding of a caudal cluster adjacent to M1 in humans, the posterior PMd adjacent to M1 in nonhuman pri-mates has been defined as a distinct cytoarchitectonic and func-tional area. This caudal subregion, termed F2, is connected to M1 and the spinal cord (for reviews, seeGeyer et al. 2000;Abe and Ha-nakawa 2009). The caudal PMd subregion has shown a similar connectivity pattern in humans, and fMRI studies have suggested that this subdivision (also referred to as the “PMd proper”) is pref-erentially activated during movement preparation and execution (for a review, seePicard and Strick 2001). Such findings suggest a functional profile for the human caudal PMd which is similar to the one observed in nonhuman primates (Boussaoud 2001) and consistent with the one identified here for our caudal PMd clus-ter. Therefore, according to its integration into the sensorimotor network and its functional profile, characterized by processes re-lated to motor preparation and programming, the caudal cluster may correspond to the nonhuman primate’s caudal right PMd (area F2) and human right PMd proper.
Central PMd: the Core PMd
The central cluster was located between the rostral and caudal ones. Compared with all other clusters, it consistently showed a stronger functional coupling with the IPS and the SPL, regions that are known to be engaged in top-down/goal-driven modula-tory processes (Corbetta and Shulman 2002). Considered separ-ately, the MACM analysis further yielded connectivity with 2 different subregions of the ventral visual stream [respectively, FG2 and FDG1 (Caspers et al. 2015)]. Functional decoding revealed that the central cluster was related to both motor and cognitive functions (such as action execution and working memory), as well as to spatial cognition and motion perception. Together, these findings and the observation that all other clusters were functionally coupled with the central cluster suggest that the lat-ter plays a core role within the right PMd mosaic by linking the functionally more specialized clusters within the right PMd.
Studies in nonhuman primates have also suggested a transi-tional region that lies at the border between F7 (i.e., rostral PMd) and F2 (i.e., caudal PMd), which has been named F2vr (for a re-view, seeAbe and Hanakawa 2009). F2vr receives inputs from dorsolateral prefrontal cortex (DLPFC) and medial IPS (Luppino et al. 2003) and has been assumed to support the integration of a visuospatial parameter (target object) and a somatosensory/ motor parameter (arm) to complete a motor plan (for a review, 1540 1545 1550 1555 1560 1565 1570 1575 1580 1585 1590 1595 1600 1605 1610 1615 1620 1625 1630 1635 1640 1645 1650 1655 1660
seeAbe and Hanakawa 2009). F2vr may thus subserve sensori-motor transformations. Our study provides support for the exist-ence of a similar transitional cluster in humans within a central location, lying between the rostral “cognitive” cluster and the caudal “motor” one. Functional decoding showed that this sub-region in human PMd is engaged in target and goal maintenance (working memory), visuospatial processes, action imagination, and action execution. This pattern suggests that our central clus-ter may, partly, include the human homologue of F2vr. Ventral PMd: Eye-Related Functions
According to the functional decoding, the ventral and central PMd clusters shared several features. In particular, both were as-sociated with saccades, anti-saccades, and visual attention para-digms. However, only the ventral cluster was significantly associated with the broader behavioral domain of vision. This be-havioral profile fits with the specific co-activation of this latter cluster with the right visual cortex (seeSupplementary Discus-sion III.2.1.for further discussion of task and rest functional con-nectivity of this cluster). These findings argue in favor of the ventral cluster being preferentially related to “eye-centered” functions. Such functions may cover learning sequences of eye movements, serial visual search, and visual attention. Neverthe-less, the ventral cluster also showed broader associations, such as with action execution and action inhibition. Thus, while our ventral cluster may not strictly be considered an “eye field,” it does likely overlap with the “premotor eye field” (see Supplemen-tary Discussion III.2.2for a description of the premotor eye field). Dorsal PMd: Hand Preferences and Sequencing/Rhythm Aspects In our MACM-CBP analysis, the dorsal PMd cluster was found to be closely coupled with the ventral cluster (seeSupplementary Results II.1andSupplementary Discussion III.1.2.). However, both PDT-CBP and RSFC-CBP clearly differentiated this dorsal subdivision as a separate cluster. Both MACM and RSFC identified specific functionally connectivity of this subdivision with bilat-eral prefrontal regions, insula, right putamen, and right MCC. These findings indicate that the dorsal cluster may be engaged in both motor and cognitive networks. Congruently, functional decoding showed a profile of associations that included motor, language, and music domains. Within the domain of motor func-tions, the dorsal cluster seemed to be preferentially related to hand/finger movements (i.e., finger tapping paradigms). In line with these findings, this part of the PMd was found to be acti-vated for imitation of hand movements in a previous meta-ana-lysis (Caspers et al. 2010). Our findings thus suggest that the dorsal cluster is related to both cognitive and motor processes, but appears to be particularly related to hand/finger movements, music, and language processing. There is evidence that music processing, language processing, and tapping might be related in certain respects (Overy et al. 2003); in particular, they may share sequencing and rhythm-processing aspects (Petkov et al. 2005;Flaugnacco et al. 2014). Therefore, although future studies are needed to more finely specify the motor and cognitive pro-cesses selectively engaging the dorsal cluster; for the time being, one can assume that this dorsal subregion preferentially supports sequencing and rhythm-processing aspects common to finger movements, music, and language.
Conclusion
Previous studies have suggested that the right PMd supports a wide range of motor and cognitive functions that may be topo-graphically organized within this region, characterized by spatial
gradients. Based on a quantitative data-driven approach, we showed that the right PMd can be robustly subdivided into 5 dis-tinct functional modules. Our work highlighted a rostro-caudal organization with a rostral subregion supporting higher cognitive functions, a caudal subregion relatively more associated with motor functions, and a central subregion that may act as an inter-face between the rostral-cognitive and the caudal-motor subre-gions. Our study further revealed a ventrodorsal organization, including a ventral subregion that supports eye-field functions, a dorsal subregion that is preferentially related to hand/finger movements, and rhythm/sequencing aspects in cognitive and motor functions. How those modules may dynamically interact is discussed inSupplementary Discussion III.2.4. Finally, we sug-gest that the central subregion, positioned at the cross-roads of both gradients, plays an integrative role within this right PMd functional mosaic.
Supplementary Material
Supplementary material can be found at: http://www.cercor. oxfordjournals.org/.
Funding
The research leading to these results has received funding from
the European Union Seventh Framework Programme(
FP7/2007-2013) under grant agreement no.604102(Human Brain Project),
the Deutsche Forschungsgemeinschaft(DFG,EI 816/4-1, EI 816/
6-1, LA 3071/3-1), andthe National Institute of Mental Health
(R01-MH074457).
Notes
Furthermore, we thank Dr Matthew Glasser, Dr Saad Jbabdi, Dr Ri-carda Schubotz, and Pr Alfred Anwander for helpful discussion and information. Conflict of Interest: None declared.
References
Abe M, Hanakawa T. 2009. Functional coupling underlying motor and cognitive functions of the dorsal premotor cortex. Behav Brain Res. 198:13–23.
Amft M, Bzdok D, Laird AR, Fox PT, Schilbach L, Eickhoff SB. 2014. Definition and characterization of an extended social-affective default network. Brain Struct Funct. 1–19.
Q4
Amiez C, Kostopoulos P, Champod A-S, Petrides M. 2006. Localmorphology predicts functional organization of the dorsal premotor region in the human brain. J Neurosci. 26:2724–2731. Amunts K, Schleicher A, Bürgel U, Mohlberg H, Uylings H, Zilles K. 1999. Broca’s region revisited: cytoarchitecture and intersub-ject variability. J Compar Neurol. 412:319–341.
Behrens TEJ, Johansen-Berg H, Woolrich MW, Smith SM, Wheeler-Kingshott CAM, Boulby PA, Barker GJ, Sillery EL, Sheehan K, Ciccarelli O. 2003. Non-invasive mapping of con-nections between human thalamus and cortex using diffu-sion imaging. Nat Neurosci. 6:750–757.
Boussaoud D. 2001. Attention versus intention in the primate premotor cortex. Neuroimage. 14:S40–S45.
Boussaoud D, di Pellegrino G, Wise SP. 1995. Frontal lobe mechan-isms subserving vision-for-action versus vision-for-percep-tion. Behav Brain Res. 72:1–15.
Bzdok D, Langner R, Schilbach L, Jakobs O, Roski C, Caspers S, Laird AR, Fox PT, Zilles K, Eickhoff SB. 2013. Characterization of the temporo-parietal junction by combining data-driven 1665 1670 1675 1680 1685 1690 1695 1700 1705 1710 1715 1720 1725 1730 1735 1740 1745 1750 1755 1760 1765 1770 1775 1780 1785 1790
parcellation, complementary connectivity analyses, and functional decoding. Neuroimage. 81:381–392.
Caspers J, Palomero-Gallagher N, Caspers S, Schleicher A, Amunts K, Zilles K. 2015. Receptor architecture of visual areas in the face and word-form recognition region of the pos-terior fusiform gyrus. Brain Struct Funct. 220:205–219. Caspers J, Zilles K, Eickhoff SB, Schleicher A, Mohlberg H,
Amunts K. 2013. Cytoarchitectonical analysis and probabilis-tic mapping of two extrastriate areas of the human posterior fusiform gyrus. Brain Struct Funct. 218:511–526.
Caspers S, Eickhoff SB, Geyer S, Scheperjans F, Mohlberg H, Zilles K, Amunts K. 2008. The human inferior parietal lobule in stereotaxic space. Brain Struct Funct. 212:481–495. Caspers S, Geyer S, Schleicher A, Mohlberg H, Amunts K, Zilles K.
2006. The human inferior parietal cortex: cytoarchitectonic parcellation and interindividual variability. Neuroimage. 33:430–448.
Caspers S, Moebus S, Lux S, Pundt N, Schütz H, Mühleisen TW, Gras V, Eickhoff SB, Romanzetti S, Stöcker T. 2014. Studying variability in human brain aging in a population-based Ger-man cohort—rationale and design of 1000BRAINS. Front Aging Neurosci. 6.
Q5
Caspers S, Zilles K, Laird AR, Eickhoff SB. 2010. ALE meta-analysis of action observation and imitation in the human brain. Neuroimage. 50:1148–1167.
Cavanna AE, Trimble MR. 2006. The precuneus: a review of its functional anatomy and behavioural correlates. Brain. 129:564–583.
Choi EY, Yeo BT, Buckner RL. 2012. The organization of the human striatum estimated by intrinsic functional connectiv-ity. J Neurophysiol. 108:2242–2263.
Choi HJ, Zilles K, Mohlberg H, Schleicher A, Fink GR, Armstrong E, Amunts K. 2006. Cytoarchitectonic identification and prob-abilistic mapping of two distinct areas within the anterior ventral bank of the human intraparietal sulcus. J Compar Neurol. 495:53–69.
Chouinard PA, Paus T. 2006. The primary motor and premotor areas of the human cerebral cortex. Neuroscientist. 12:143–152. Cieslik EC, Zilles K, Caspers S, Roski C, Kellermann TS, Jakobs O, Langner R, Laird AR, Fox PT, Eickhoff SB. 2013. Is there “One” DLPFC in cognitive action control? Evidence for heterogeneity from co-activation-based parcellation. Cerebr Cortex. 23:2677–2689.
Clos M, Amunts K, Laird AR, Fox PT, Eickhoff SB. 2013. Tackling the multifunctional nature of Broca’s region meta-analytical-ly: co-activation-based parcellation of area 44. Neuroimage. 83:174–188.
Collette F, Hogge M, Salmon E, Van der Linden M. 2006. Explor-ation of the neural substrates of executive functioning by functional neuroimaging. Neuroscience. 139:209–221. Corbetta M, Shulman GL. 2002. Control of goal-directed and
stimulus-driven attention in the brain. Nat Rev Neurosci. 3:201–215.
Eickhoff SB, Bzdok D, Laird AR, Kurth F, Fox PT. 2012. Activation likelihood estimation meta-analysis revisited. Neuroimage. 59:2349–2361.
Eickhoff SB, Bzdok D, Laird AR, Roski C, Caspers S, Zilles K, Fox PT. 2011. Co-activation patterns distinguish cortical modules, their connectivity and functional differentiation. Neuroimage. 57:938–949.
Eickhoff SB, Jbabdi S, Caspers S, Laird AR, Fox PT, Zilles K, Behrens TE. 2010. Anatomical and functional connectivity of cytoarchitectonic areas within the human parietal opercu-lum. J Neurosci. 30:6409–6421.
Eickhoff SB, Stephan KE, Mohlberg H, Grefkes C, Fink GR, Amunts K, Zilles K. 2005. A new SPM toolbox for combining probabilistic cytoarchitectonic maps and functional imaging data. Neuroimage. 25:1325–1335.
Eickhoff SB, Thirion B, Varoquaux G, Bzdok D. 2015. Connectivity-based parcellation: critique and implications. Hum Brain
Mapp.
Q6
Flaugnacco E, Lopez L, Terribili C, Zoia S, Buda S, Tilli S, Monasta L, Montico M, Sila A, Ronfani L, et al. 2014. Rhythm perception and production predict reading abilities in devel-opmental dyslexia. Front Hum Neurosci. 8:392.
Geyer S, Ledberg A, Schleicher A, Kinomura S, Schormann T, Bürgel U, Klingberg T, Larsson J, Zilles K, Roland PE. 1996. Two different areas within the primary motor cortex of man.
Q7
Geyer S, Matelli M, Luppino G, Zilles K. 2000. Functionalneuro-anatomy of the primate isocortical motor system. Anat Embryol. 202:443–474.
Geyer S, Schleicher A, Zilles K. 1999. Areas 3a, 3b, and 1 of human primary somatosensory cortex. Neuroimage. 10:63–83. Grefkes C, Geyer S, Schormann T, Roland P, Zilles K. 2001. Human
somatosensory area 2: observer-independent cytoarchitec-tonic mapping, interindividual variability, and population map. Neuroimage. 14:617–631.
Grosbras MH, Beaton S, Eickhoff SB. 2012. Brain regions involved in human movement perception: a quantitative voxel-based meta-analysis. Hum Brain Mapp. 33:431–454.
Hanakawa T. 2011. Rostral premotor cortex as a gateway between motor and cognitive networks. Neurosci Res. 70:144–154. Hanakawa T, Honda M, Sawamoto N, Okada T, Yonekura Y,
Fukuyama H, Shibasaki H. 2002. The role of rostral Brodmann area 6 in mental-operation tasks: an integrative neuroimaging approach. Cerebr Cortex. 12:1157–1170.
Hardwick RM, Rottschy C, Miall RC, Eickhoff SB. 2013. A quantita-tive meta-analysis and review of motor learning in the human brain. Neuroimage. 67:283–297.
Hoshi E. 2013. Cortico-basal ganglia networks subserving goal-di-rected behavior mediated by conditional visuo-goal associ-ation. Front Neural Circuits. 7:158.
Hoshi E, Tanji J. 2007. Distinctions between dorsal and ventral premotor areas: anatomical connectivity and functional prop-erties. Curr Opin Neurobiol. 17:234–242.
Johansen-Berg H, Behrens TEJ, Robson MD, Drobnjak I, Rushworth MFS, Brady JM, Smith SM, Higham DJ, Matthews PM. 2004. Changes in connectivity profiles define func-tionally distinct regions in human medial frontal cortex. Proc Natl Acad Sci USA. 101:13335–13340.
Kahnt T, Chang LJ, Park SQ, Heinzle J, Haynes J-D. 2012. Connect-ivity-based parcellation of the human orbitofrontal cortex. J Neurosci. 32:6240–6250.
Kantak SS, Stinear JW, Buch ER, Cohen LG. 2012. Rewiring the brain: potential role of the premotor cortex in motor control, learning, and recovery of function following brain injury. Neurorehabil Neural Repair. 26:282–292.
Kelly C, Toro R, Di Martino A, Cox CL, Bellec P, Castellanos FX, Milham MP. 2012. A convergent functional architecture of the insula emerges across imaging modalities. Neuroimage. 61:1129–1142.
Kelly C, Uddin LQ, Shehzad Z, Margulies DS, Castellanos FX, Milham MP, Petrides M. 2010. Broca’s region: linking human brain functional connectivity data and non-human primate tracing anatomy studies. Eur J Neurosci. 32:383–398. Klein JC, Behrens TE, Robson MD, Mackay CE, Higham DJ,
Johan-sen-Berg H. 2007. Connectivity-based parcellation of human cortex using diffusion MRI: establishing reproducibility, 1795 1800 1805 1810 1815 1820 1825 1830 1835 1840 1845 1850 1855 1860 1865 1870 1875 1880 1885 1890 1895 1900 1905 1910 1915 1920