HAL Id: hal-02661782
https://hal.inrae.fr/hal-02661782
Submitted on 30 May 2020
HAL is a multi-disciplinary open access
archive for the deposit and dissemination of
sci-entific research documents, whether they are
pub-lished or not. The documents may come from
teaching and research institutions in France or
abroad, or from public or private research centers.
L’archive ouverte pluridisciplinaire HAL, est
destinée au dépôt et à la diffusion de documents
scientifiques de niveau recherche, publiés ou non,
émanant des établissements d’enseignement et de
recherche français ou étrangers, des laboratoires
publics ou privés.
Long-Lasting Changes in Nutrient Sensing and Energy
Homeostasis in the Hypothalamus
David Ricardo Orozco-Solis, Rhowena Jane Barbosa Matos, Omar Guzman
Quevedo, Sandra Lopes de Souza, Audrey Bihouee, Rémi Houlgatte, Raul
Manhaes de Castro, Francisco Javier Bolanos Jimenez
To cite this version:
David Ricardo Orozco-Solis, Rhowena Jane Barbosa Matos, Omar Guzman Quevedo, Sandra Lopes
de Souza, Audrey Bihouee, et al.. Nutritional Programming in the Rat Is Linked to Long-Lasting
Changes in Nutrient Sensing and Energy Homeostasis in the Hypothalamus. PLoS ONE, Public
Library of Science, 2010, 5 (10), �10.1371/journal.pone.0013537�. �hal-02661782�
Lasting Changes in Nutrient Sensing and Energy
Homeostasis in the Hypothalamus
Ricardo Orozco-Solı´s1, Rhowena J. B. Matos1, Omar Guzma´n-Quevedo1, Sandra Lopes de Souza2, Audrey Bihoue´e3, Re´mi Houlgatte3, Raul Manha˜es de Castro4, Francisco Bolan˜os-Jime´nez1*
1 INRA, UMR1280 Physiologie des Adaptations Nutritionnelles, Universite´ de Nantes, Nantes Atlantique Universite´, Nantes, France, 2 Departamento de Anatomia, Centro de Cieˆncias Biolo´gicas, Universidade Federal de Pernambuco, Recife, Pernambuco, Brazil,3 INSERM, U915, IFR26, l’institut du Thorax, Nantes, France, 4 Departamento de Nutric¸ao, Centro de Cieˆncias da Saude, Universidade Federal de Pernambuco, Recife, Pernambuco, Brazil
Abstract
Background:Nutrient deficiency during perinatal development is associated with an increased risk to develop obesity, diabetes and hypertension in the adulthood. However, the molecular mechanisms underlying the developmental programming of the metabolic syndrome remain largely unknown.
Methodology/Principal Findings:Given the essential role of the hypothalamus in the integration of nutritional, endocrine and neuronal cues, here we have analyzed the profile of the hypothalamus transcriptome in 180 days-old rats born to dams fed either a control (200 g/kg) or a low-protein (80 g/kg) diet through pregnancy and lactation. From a total of 26 209 examined genes, 688 were up-regulated and 309 down-regulated (P,0.003) by early protein restriction. Further bioinformatic analysis of the data revealed that perinatal protein restriction permanently alters the expression of two gene clusters regulating common cellular processes. The first one includes several gate keeper genes regulating insulin signaling and nutrient sensing. The second cluster encompasses a functional network of nuclear receptors and co-regulators of transcription involved in the detection and use of lipid nutrients as fuel which, in addition, link temporal and nutritional cues to metabolism through their tight interaction with the circadian clock.
Conclusions/Significance:Collectively, these results indicate that the programming of the hypothalamic circuits regulating energy homeostasis is a key step in the development of obesity associated with malnutrition in early life and provide a valuable resource for further investigating the role of the hypothalamus in the programming of the metabolic syndrome.
Citation: Orozco-Solı´s R, Matos RJB, Guzma´n-Quevedo O, Lopes de Souza S, Bihoue´e A, et al. (2010) Nutritional Programming in the Rat Is Linked to Long-Lasting Changes in Nutrient Sensing and Energy Homeostasis in the Hypothalamus. PLoS ONE 5(10): e13537. doi:10.1371/journal.pone.0013537
Editor: Manuel Tena-Sempere, University of Co´rdoba, Spain
Received April 3, 2010; Accepted September 14, 2010; Published October 21, 2010
Copyright: ß 2010 Orozco-Solı´s et al. This is an open-access article distributed under the terms of the Creative Commons Attribution License, which permits unrestricted use, distribution, and reproduction in any medium, provided the original author and source are credited.
Funding: This work was supported by INRA through a Young Team Action and by L’Agence National de la Recherche (ANR-05-PNRA-009-02). R. Orozco-Solı´s and O. Guzma´n-Quevedo are doctoral fellows from the Mexican Consejo Nacional de Ciencia y Tecnologı´a (CONACYT). S. Lopes de Souza and Rhowena Matos are the recipients of a post-doctoral fellowship from La Region Pays de la Loire. The funders had no role in study design, data collection and analysis, decision to publish, or preparation of the manuscript.
Competing Interests: The authors have declared that no competing interests exist. * E-mail: [email protected]
Introduction
In the past two decades, there has been an important increase in the incidence of the metabolic syndrome worldwide. The constellation of metabolic abnormalities characteristic of this pathological entity includes abdominal obesity, glucose intoler-ance, dyslipidaemia, hypertension and artherosclerosis. The etiology of the obesity which is at the heart of the metabolic syndrome may not simply be a consequence of an imbalanced diet or of a sedentary lifestyle. Obesity is a multifactorial condition in which environmental, biological and genetic factors all have a contributory role [1]. Actually, infants born small for gestational age, as a result of a deficient provision of macro- and micronu-trients during development, are at increased risk of developing obesity, insulin resistance, cardiovascular diseases and hyperten-sion during adulthood [2]. To explain these observations, it has been hypothesised that the nutritional environment during the
critical period of perinatal development programs whole body energy homeostasis for optimal survival under nutritionally-deficient conditions. However, if these early-life adaptations mismatch with the environmental conditions the individual will confront later in life they will favour metabolic disorders [3,4]. In support of this hypothesis, experimental studies in several animal species have shown that the offspring of dams exposed to protein or global calorie restriction during pregnancy and/or lactation exhibit several physiological disturbances linked to the metabolic syndrome such as insulin resistance [5,6], reduced leptin sensitivity [7,8], hepatic steatosis [9], elevated blood pressure [10] and hyperlipidemia [5,8,9].
The actual mechanisms responsible for the perinatal program-ming of body weight homeostasis that then lead to obesity and altered metabolism at the whole body level are not well understood. Nevertheless, several lines of evidence indicate that perturbations in the control of appetite and energy homeostasis
within the brain are involved. Notably, exposure to nutrient restriction during perinatal development results in offspring which are hyperphagic and exhibit enhanced preference for high-fat food [11,12,13,14]. Meal pattern analysis has further indicated that the increased food intake presented by metabolic programmed rats is due to a delay appearance of satiety, an increase in meal size and a reduced latency to eat [15]. The offspring born to nutrient restricted dams exhibit also alterations in the hypothalamic expression levels of several neuropeptides regulating food intake [16,17,18] as well as reduced numbers of galanin and NPY neurons [19,20]. The anorexic actions of insulin [21], leptin [12] and serotonin [12,14] have also been shown to be reduced in the rat offspring of dams submitted to protein or calorie restriction. Taken together, these observations indicate that a dysfunction of the hypothalamic circuits regulating energy homeostasis and food intake plays a role in the developmental programming of the metabolic syndrome.
To get an integrated view of the molecular pathways that might underlie the behavioural and physiological perturbations of feeding behavior induced by perinatal undernutrition, here we have used DNA chips and quantitative RT-PCR to analyze the perturbations of the hypothalamic transcriptome induced by the exposure to a low protein diet through pregnancy and lactation. The analysis by gene ontology of the data revealed an over-representation of genes involved in cell signal transduction and the regulation of metabolic process and gene transcription.
Results and Discussion
Phenotypic characteristics of LP rats
At birth, the offspring born to dams fed the low protein diet weighed significantly less than their control counterparts (5.9760.09 g vs 7.0060.18; P,0.0001) but they showed later a delayed catch-up growth such that at the completion of the study no statistically significant differences in body weight were observed between the two groups (Table 1). In contrast, adult LP exhibited higher serum levels of cholesterol, triglycerides and free fatty acids
along with increased abdominal fat and enhanced expression levels in liver of Fatty acid Synthase, Stearoyl-Coenzyme A desaturase 1 and Carbohydrate response element binding protein (Table 1). Collectively, these observations sustain the results of previous studies indicating that protein restriction during early life induces metabolic and body composition disturbances in adulthood [5,6,8,9].
Gene ontology analysis of the global expression profile
Comparison of the gene expression profile of the 26 209 genes constituting the microarray, showed that a total of 997 genes were differentially expressed in the hypothalamus of LP rats versus that of control animals (P,0.003). Among them, 688 were up-regulated and 309 were down-up-regulated representing 2.6% and 1.2%, respectively, of the total number of analyzed genes (Figure S1). The functional classification of these genes using the DAVID data base further revealed that most of them belong to Gene Ontology categories corresponding to signal transduction, regula-tion of metabolic processes and gene transcripregula-tion (Table 2). Interestingly, some of the functional categories were overrepre-sented (EASE score P,0.05), only in the up-regulated or in the down-regulated group. Thus, the functional categories associated with cellular signaling pathways (synaptic transmission, kinase activity, intracellular signaling cascade, steroid hormone receptor activity), and transcription processes (transcription, transcription DNA dependent, transcription regulatory activity, cell cycle process) were over-represented in the up-regulated group, whereas the functional categories related to metabolism (metabolic process, protein metabolic process, cellular homeostasis, oxidoreductase activity) and cell cycle were over-represented in the down regulated group. This observation, together with the fact that only ,5% of the altered genes were classified into a unique functional category, suggests that perinatal protein restriction affects an array of genes that act as a network to control metabolism and other cellular processes rather than a series of independent signaling pathways.
To further explore this hypothesis, we selected the most representative GO categories (signal transduction, S; transcription, T; and metabolic process, M), and looked for the genes classified into at least two of the selected GO categories (see methods). We reasoned that genes exerting two or more of these biological functions play an important role in the establishment and functioning of metabolic networks [22]. We found that 148 genes were classified into two or more GO categories (Figure 1A). Among them, 36 genes were classified into the signal transduction and metabolic process categories (SM), 85 into the transcription and metabolic process (MT), and 27 genes were classified into the three categories (TMS, Figure 1A). Some of the genes belonging to these overlapped areas are listed in Tables 3 and 4. All of them encode transcription factors, nuclear receptors or enzymes involved in the regulation of metabolism. To determine the global tendency of expression of the genes within each GO category, we calculated the ratio between the number of up- versus down-regulated genes in each category and their overlapped areas (Figure 1B). Interestingly, we found a ratio .1, indicating a tendency for over-expression, of the genes involved in the regulation of cellular signaling processes (S,1.3; MS,2.2; MT, 1.42. TMS, 2.8), and a ratio ,1, indicating an inhibition of expression, of the genes involved in the regulation of metabolism (M, 0.47).This observation suggests the existence of ‘‘functional units’’ or ‘‘modules’’ [23] that are differentially altered by metabolic programming.
To determine the predominant function of the genes which were classified into two or more GO categories, we classed each gene according to its molecular function (nuclear receptor, transcription factor, cellular signaling and undefined) and calculated the percentage of each molecular function for each Table 1. Phenotypic characteristics of control and LP rats.
Controls Low protein
Statistical significance Morphological traits
Body weight (g) 682633 646624 NS Abdominal fat (% of body
weight)
4.6460.30 6.9160.44 P,0.01 Serum metabolites
Cholesterol (mmol/l) 2.7860.13 3.8760.26 P,0.01 Triglycerides (mmol/l) 2.5260.33 3.8160.18 P,0.05 Fatty acids (mmol/l) 0.3260.03 0.5160.05 P,0.05 Glucose (mmol/l) 9.5360.47 10.0160.31 NS Insulin (ng/ml) 7.3161.50 3.9160.82 NS Gene expression in liver
Fatty acid synthase (FAS) 0.8860.08 1.5060.09 P,0.05 Stearoyl-Coenzyme A
desaturase 1 (SCD 1)
0.9260.08 1.4160.09 P,0.01 Carbohydrate response
element binding protein (ChREBP)
1.0260.07 1.2660.04 P,0.05
overlapped group. The results of this analysis indicated that most of the genes classified into more than one GO category behave as transcription factors. Actually, 72% of the genes within the overlapped SM category are transcription factors and 28% do not have a defined function. Within the MT overlapped area, 67% are transcription factors, 4.7% are nuclear receptors, 2.3% participate in cell signaling and 25% have no defined function. In the overlapped area corresponding to SMT, 26% of the genes are transcription factors, 33% nuclear receptors, 19% participate in cell signaling and 22% have undefined function.
Genes regulating metabolic process
Most of the genes whose expression levels were permanently altered by perinatal protein restriction are involved in the regulation of metabolic processes as determined by the analysis of the microarray data by gene ontology. Indeed, 334 genes out of a total of 997 belong to this functional category. However, many of these genes exhibit one or two additional functions such that only 186 genes are exclusively involved in the regulation of metabolism (Figure 1A). Strikingly, the expression of almost all these genes was down regulated in LP rats in relation to controls. The sub-categorization of this functional cluster indicated an over represen-tation of genes involved in the regulation of protein biosynthesis like the 60S ribosomal proteins L13 and L15, the eukaryotic translation initiation factor 3, the seryl-aminoacyl-tRNA synthetase 1 and the asparatyl-tRNA synthetase 2 (Table 3). The metabolism of glucose and carbohydrates seems also to be hampered by early protein restriction as indicated by the lower expression levels of several genes involved in this metabolic pathway including lactate dehydrogenase C, UDP-glucose pyrophosphorylase, mannosidase
alpha class 2A, malate dehydrogenase 2 and xylosyltransferase1. The expression of numerous genes with oxido-reductase activities such as cytochrome P450 family 3 and 20, peroxi-redoxin 3, cytochrome b-5, thioredoxin, NADH dehydrogenase Fe-S and cytochrome oxidase subunit IV was also reduced by perinatal protein restriction (Table 3). This was also the case for some genes regulating cell proliferation like the transcription factor E2F5, the cell growth regulator with ring finger domain 1, cyclin H and the cell division cycle 5-like and cell division cycle 26 genes.
Cell signaling pathways involved in energy homeostasis and nutrient sensing
The second gene ontology category most affected by perinatal undernutrition regroups genes involved in signal transduction. This category includes the galanin receptor 1 (GALR1) the cannabinoid receptor 1 (CB1) and the glutamate receptor NMDA NR2 (Table 3). All these receptors, whose expression levels were increased more than two fold in LP rats in relation to controls, have been involved in the regulation of food intake and energy homeostasis [24,25,26]. To our surprise we found no changes in gene expression of the classical orexigenic and anorexigenic neuropeptides, NPY, AgRP, POMC and CART but this was due to the stringent criteria we used to limit false discovery rate (P,0.003). Indeed, in agreement with our previous observations [15], a close inspection of the microarray data revealed a down regulation of AgRP and POMC with a P-value of, respectively, 0.04 and 0.02. NPY and CART were also down regulated although in this latter case the differences in the levels of gene expression between control and LP rats were not statistically significant. The expression of other neurotransmitter receptors Table 2. Functional gene ontology categories enriched in the hypothalamus of 180 days-old LP rats.
Gene ontology category GO Number UP-Regulated Down-Regulated
Number % P-value Number % P-value Signal transduction GO:0007165 109 16 0,4828 29 9 1,0000 Intracellular signaling cascade GO:0007242 51 7 0,0041 0 0 ---Steroid hormone receptor activity GO:0003707 10 1 ,0.0001 0 0 ---Transcription GO:0006350 86 13 ,0.0001 26 8 0,5403 Transcription, DNA-dependent GO:0006351 77 11 ,0.0001 21 7 0,7604 Transcription regulator activity GO:0030528 63 9 ,0.0001 16 5 0,7708 Metabolic process GO:0008152 206 30 0,0429 128 41 0,0030 Regulation of metabolic process GO:0019222 85 12 ,0.0001 32 10 0,3318 Protein metabolic process GO:0019538 86 13 0,4753 61 20 0,0285 Cellular homeostasis GO:0019725 8 1 0,7503 14 5 0,0012 Oxidoreductase activity GO:0016491 0 0 --- 22 7 0,0149 Cell cycle process GO:0022402 15 2 0,3093 15 5 0,0084 Synaptic transmission GO:0007268 30 4 ,0.0001 0 0 ---Ion transmembrane transporter activity GO:0015075 30 4 0,0247 8 3 0,8862 Neurogenesis GO:0022008 20 3 0,0073 0 0 ---Intracellular part GO:0044424 199 29 0,0004 127 41 0,0005 Voltage-gated channel activity GO:0022832 13 2 0,0031 0 0 ---Ion binding GO:0043167 126 18 ,0.0001 35 11 0,8940 Kinase activity GO:0016301 45 7 0,0001 8 3 0,9671 The number and percentage of genes up-regulated or down regulated within each GO category in LP rats in relation to control animals are presented. The indicated P-value corresponds to modified Fisher Exact P-Value for gene-enrichment analysis (EASE score). From a total of 26609 examined genes, 688 were up-regulated and 309 down-regulated.
which have not, until now, been directly associated with the regulation of metabolism was also altered by protein restriction. These include several glutamate receptor subtypes and different members of the olfactory receptor family as well as the purinergic receptor P2Y4, the calcium sensor receptor and the angiotensin receptor 1a (Table 3). In addition to altered changes in the expression of membrane receptors, LP rats exhibited up-regulated levels of mRNA encoding enzymes involved in intracellular signaling including several members of the adenylate and guanylate cyclases, Rho and Ras GTPases and protein kinases.
However, the most outstanding result revealed by the analysis of the genes clustered in the signal transduction gene ontology category, was the finding that perinatal protein restriction increased the hypothalamic expression levels of several genes involved in the signal transduction pathway of insulin (Table 4).
These genes include insulin receptor substrate-1 (IRS1), phospha-tidylinositol-3-kinase (PI3K), phosphoinositide-dependent protein kinase-1 (PDK1), serine threonine kinase Akt3, glycogen synthase kinase 3 beta (GSK3b) and the signal transduction protein CBL. This observation is in line with the results of previous studies which have shown an up-regulation of the PI3K signaling pathway in skeletal muscle of young men with low birth weight [27] or in skeletal muscle of rats submitted to metabolic programming [28]. The constitutive activation of the PI3K pathway in POMC neurons results in hyperphagia, diet-sensitive obesity and leptin resistance [29]. On the other hand, enhanced expression and activity of GSK3b has been reported in the skeletal muscle of diabetic patients and in the muscle of animal models of type 2 diabetes [30,31]. Therefore, the herein presented results point out the interesting possibility that the increased food intake and metabolic disturbances usually observed in metabolic programmed animals are bring about, at least in part, by disrupted insulin signaling in the hypothalamus.
PI3K and Akt3 are also at the heart of the intracellular transduction cascade initiated by the stimulation by leptin and neurotrophin brain-derived neurotrophic factor (BDNF) of their membrane receptors. Like insulin, leptin and BDNF act in the arcuate and ventromedial nucleus of the hypothalamus to regulate food intake, energy expenditure and peripheral glucose levels by the activation PI3K [32,33,34]. Moreover, the PI3K/Akt pathway is an upstream activator of the protein kinase mTOR (mammalian target of rapamycin) which is a critical regulator of nutrient sensing as well as cellular metabolism, growth, and proliferation [35,36]. Our finding that the expression of PI3K and AKT was significantly increased in the hypothalamus of LP rats in relation to control animals therefore suggests that the fuel sensing mechanisms of the cell are also affected by early protein restriction. In support of this idea, the expression of tuberous sclerosis complex 1 (TSC1), tuberous sclerosis complex 2 (TSC2) and rictor genes was also altered by protein undernutrition (Table 4). The heterodimer TSC1/TSC2 is an upstream negative regulator of mTOR and rictor is a key component of the multi-protein complex mTORC2 which inhibits insulin signaling through a feed-back mechanism involving the phosphorylation of Akt and of several serine residues of IRS-1 [37,38].
By altering the expression of PI3K and Akt, perinatal protein restriction is therefore disrupting a wide range of neural and hormonal signals involved in the regulation of food intake and energy homeostasis making likely that the herein reported changes in gene expression of this molecule play a key role in the metabolic disturbances associated with nutritional programming.
Transcriptional control of metabolism
The hierarchical organization of the microarray data by Gene Ontology indicated that 112 genes, representing more than 10% of the genes whose expression level was altered by maternal protein restriction, participate in transcription processes. These include genes encoding growth and cell proliferation factors as well as transcription factors that play a key role in the integration of nutrient, metabolic and endocrine signals and some enzymes involved in the regulation of chromatin structure and function. Transforming growth factor beta (TGFb), Kruppel-like factor 5 (Klf5), fibroblast growth factor 2 (Fgf2), transcription factor E2F5 (EDF-5), retinoblastoma binding protein 7 (RBBP7), neurogenin 1(Neurog1) and like histone deacetytlase 1 and histone acetyltrans-ferase MYST4 are representative genes of these groups (Table 3).
However, the largest class of genes represented in this group is the nuclear receptor (NR) family. NR are ligand-activated transcription factors that act as nutrient sensors and, by responding to both incoming dietary signals and metabolites
Figure 1. Functional classification (A) and global tendency of expression (B) of the genes differentially expressed in LP versus control rats. (A) Venn diagram showing the number of genes classified into one single GO category as well as the number of genes exerting two or more biological functions. (B) A big proportion of the genes whose mRNA expression levels are affected by protein restriction during early life possess more than one function and exhibit a tendency for over-expression. S = signal transduction; M = metabolic process; T = transcription.
generated by the diet, play a key role in the metabolic adaptation of the organism [39]. According to the genomic sequence information available to date, mammals encode 48–49 NR family members. In our microarray analysis, the expression of 11 rat homologous NR members was permanently altered by perinatal protein undernutrition (Table 4). Most of these receptors belong to a functional NR network that regulates lipid metabolism and energy homeostasis as defined by Bookoute et al., [40]. These nuclear receptors are: the glucocorticoid receptor (GR), the thyroid hormone receptor beta (TRb), the RAR-related orphan receptor alpha (RORa), the peroxisome proliferator activated receptor gamma (PPARc) and the retinoid X receptor alpha (RXRa) to which the transcriptional co-regulators PGC1a and PGC1b, whose expression is also permanently altered in LP rats, can be added. All these genes are involved in the regulation of lipid and carbohydrate metabolism.
Among the other nuclear receptors whose level of expression was enhanced by early protein restriction, two of them, estrogen receptor alpha (ERa) and the androgen receptor (AR), are clustered into a NR network that links nuclear receptor function to reproduction and development [40] but even these receptors have been shown to play an important role in the regulation of food intake and energy expenditure. Thus AR [41] or ERa [42] knockout mice develop several physio-pathological features characteristic of the metabolic syndrome including body weight gain, hyperphagia and increased visceral adipose tissue. This phenotype can be reproduced by the selective inactivation of ERa receptors in the ventromedial nucleus of the hypothalamus [43] underscoring the importance of hypotha-lamic NR in the control of energy homeostasis at the whole body level and the relevance of our findings.
Transcriptional regulation of the circadian clock
Another striking result of our microarray analysis was the finding that the levels of expression of several genes which play an important role in the regulation of the circadian clock are permanently altered by perinatal protein restriction. The circadian clock is an endogenous system that controls a wide variety of physiological processes ranging from body temperature, and heart rate to hormone secretion [44]. It constitutes the link between the temporal availability of nutrients and energy metabolism. At the core of the circadian clock is a set of transcription factors that form transcription-translation feedback loops that maintain cycles of gene expression over a 24 h period. The positive limb of the loop Table 3. Overview of gene expression changes in the
hypothalamus of LP rats in relation to control animals.
Gene name Gene ID Fold change P-value Metabolism 60S ribosomal protein L13 500276 21,62 0,0009 Ribosomal protein L15 364239 21,54 0,0024 Eukaryotic translation initiation factor 3 293484 21,51 0,0008 Seryl-aminoacyl-tRNA synthetase 1 266975 21,33 0,0018 Aspartyl-tRNA synthetase 2 304919 21,23 0,0024 Lactate dehydrogenase 3 29634 2,30 0,0017 UDP-glucose pyrophosphorylase 2 289827 21,19 0,0015 Alpha-mannosidase II 25478 2,64 0,0003 Malate dehydrogenase 81829 21,34 0,0003 Xylosyltransferase 1. 64133 3,19 0,0005 Glucosidase 1 78947 21,58 0,0017 Glutamine fructose-6-phosphate transaminase 1 297417 3,46 0,0002 Glutamate decarboxylase 2 24380 2,80 0,0009 N-acetylglucosaminyltransferase 65271 3,87 0,0006 Peptidylprolyl isomerase B 64367 21,38 0,0019 Serine palmitoyltransferase 296188 2,48 0,0004 Cytochrome P450, family 3 171352 21,77 0,0009 Cytochrome b-5 64001 21,47 0,0010 Cytochrome P450, family 20 316435 21,41 0,0015 Cytochrome oxidase deficient
homolog 1
497930 21,54 0,0025 Cytochrome c oxidase polypeptide
VIII-liver.
680156 22,56 0,0027 Cytochrome c oxidase subunit IV
isoform 1
29445 21,28 0,0028 Peroxiredoxin 1 683813 22,31 0,0018 NADH dehydrogenase Fe-S protein 6 29478 21,32 0,0022 Signal transduction
Galanin receptor 1 50577 2,13 0,0002 Cannabinoid receptor 1 25248 2,54 0,0006 Glutamate receptor, ionotropic, NMDA2B 24410 5,27 0,0001 Calcium-sensing receptor 24247 21,73 0,0009 Purinergic receptor P2Y 63843 2,67 0,0008 Angiotensin receptor 1a 24180 21,71 0,0023 Glutamate receptor kainate 3 298521 2,84 0,0010 Glutamate receptor NMDA 2A 24409 3,82 0,0012 Metabotropic glutamate receptor 5 24418 3,10 0,0018 Metabotropic glutamate receptor 3 24416 4,46 0,0034 Glutamate receptor AMPA1 (alpha 1) 691178 2,56 0,0037 Rho-GTPase-activating protein 26 307459 3,41 0,0009 RAB27B, member RAS oncogene family 84590 3,08 0,0004 Protein kinase, lysine deficient 1 116477 4,46 0,0012 Plasma membrane calcium ATPase 4 29600 3,46 0,0029 Protein kinase C alpha 24680 3,00 0,0000 Guanylate cyclase 1, soluble, alpha 2 66012 3,90 0,0016 Transcription
Transforming growth factor, beta 1 59086 21,40 0,0011 Kruppel-like factor 5 84410 1,51 0,0026 Table 3. cont. Gene name Gene ID Fold change P-value Fibroblast growth factor 2 54250 1,80 0,0017 Transcription factor E2F5 116651 21,84 0,0022 Retinoblastoma binding protein 7 83712 21,43 0,0003 Neurogenin 1 29410 21,43 0,0029 Zinc finger protein HIT-10 170955 6,24 0,0013 Tnf receptor-associated factor 6 311245 3,30 0,0003 General transcription factor 83830 3,07 0,0019 Zinc finger protein 297B 311872 3,16 0,0008 Histone acetyltransferase MYST4 688634 2,74 0,0004 Histone deacetylase 9 isoform 4 314040 2,15 0,0231 doi:10.1371/journal.pone.0013537.t003
is constituted by the transcription factors CLOCK (Circadian Locomotor Output Cycles Kaput) and Bmal1 (Brain and Muscle Arnt-Like protein 1) whose protein products dimerize to induce the transcription of period (Per1-3) and Cryptochrome (Cry1-2) genes as well as that of other genes which contain E-box elements in their promoters including NR and other genes involved in fatty acid and glucose metabolism. A second regulatory loop involves the co-activator of transcription PGC-1a and the nuclear receptors REV-ERBa and RORa. REV-ERBa is a direct target of the CLOCK-Bmal1complex and represses Bmal1 transcription [45] whereas PGC-1a and RORa act synergistically to activate Bmal1 expression [46,47].
We found that the mRNA hypothalamic levels of PGC1a and RORa as well as those of CLOCK were significantly increased in LP rats in relation to controls (Table 4). This indicates that protein deficiency during the critical period of perinatal development programs the circadian clock. In line with this hypothesis, we have recently documented that the resulting offspring of Sprague-Dawley rats submitted to the same metabolic programming model as the one used in this study, exhibit significant alterations in the circadian expression profile of diverse genes regulating food intake such as NPY and CART as well as of the three master genes of the circadian
clock BMAL1, Period1 and CLOCK [48]. These effects persist long time after weaning and are associated with hyperphagia. Given that the CLOCK/Bmal1 complex regulates also the expression of several genes involved in the control of distinct metabolic processes including glucose and lipid biosynthesis [49], and because of the association between the disruption of the circadian clock and metabolic dysfunction [50], our observations strongly suggest that the susceptibility to develop obesity and insulin resistance induced by protein restriction during early life results, at least in part, from the metabolic programming of the circadian clock.
Confirmation studies
In order to corroborate, on one hand, the results of the micro-array analysis and to demonstrate, on the other hand, that the differences in gene expression between control and LP rats observed in the hypothalamus of 180 days-old animals are not due to unspecific effects of ageing, we evaluated by real-time RT-PCR the expression levels of the genes clustered into cell signaling and the transcriptional regulation of metabolism, the two gene ontology categories most affected by perinatal protein restriction, using cDNA samples from both 180 and 35 days-old rats. Experiments were performed on 35 days-old pups to show that the transcriptional Table 4. Functional and transcriptional gene clusters whose expression in the hypothalamus is coordinately regulated by perinatal protein restriction.
Gene name Gene symbol Gene_ID Fold change P-value GO Category Enegy homeostasis and nutrient sensing
Insulin receptor substrate 1 IRS1 25467 2,21 0,0031 S Phosphatidylinositol 3-kinase, regulatory subunit, polypeptide 1 PI3K 25513 3,05 0,0017 M, S 3-phosphoinositide dependent protein kinase-1 PDK1 81745 3,25 0,0003 S Murine thymoma viral oncogene homolog 3 Akt3 29414 1,42 0,0043 S Glycogen synthase kinase 3 beta GSK3b 84027 4,04 0,0020 M, S, T Tuberous sclerosis 1 Tsc1 60445 2,31 0,0026 M, S Tuberous sclerosis 2 Tsc2 24855 21,33 0,0029 S Ecotropic retroviral transforming sequence CBL 500985 4,37 0,0001 S Transcriptional regulation of metabolism
Glucocorticoid receptor GR 24413 3,15 0,0011 M, S, T Thyroid hormone receptor beta TRb 24831 2,69 0,0028 M, T RAR-related orphan receptor alpha RORa 300807 7,25 0,0002 M, S, T RAR-related orphan receptor beta RORb 309288 2,77 0,0010 M, T Peroxisome proliferator-activated receptor gamma PPARc 25664 22,35 0,0015 M, S, T Retinoid X receptor alpha RXRa 25271 2,10 0,0007 M, S, T Estrogen receptor 1 ERa 24890 2,83 0,0002 M, S, T Androgen receptor AR 24208 3,33 0,0023 M, S, T Testicular orphan nuclear receptor 4 TR4 50659 4,24 0,0010 M, T Germ cell nuclear factor GCNF 362125 2,97 0,0017 M, T Peroxisome proliferative activated receptor, gamma, coactivator 1 alpha PGC-1a 83516 2,31 0,0035 M, S, T Peroxisome proliferator-activated receptor gamma coactivator 1 beta PGC-1b 291567 2,18 0,0007 M, S, T Circadian clock
RAR-related orphan receptor alpha RORa 300807 7,25 0,0002 M, S, T Retinoid X receptor alpha RXRa 25271 2,10 0,0007 M, S, T Peroxisome proliferative activated receptor, gamma, coactivator 1 alpha PGC-1a 83516 2,31 0,0035 M, S, T Circadian Locomotor Output Cycles Kaput CLOCK 60447 4,61 0,0004 M, S, T Hierarchical cluster analysis was performed using CLUSTER 3.0 and TREEVIEW software as indicated in the Material and Methods section. The indicated P-value corresponds to the Student’s t-test P value. S = Signal transduction; M = Metabolism; T = Transcription.
changes at the time of weaning result from the programming effects of the maternal diet and are not the consequence of the ongoing ingestion of the low protein diet. These experiments confirmed the results issued from the genome-wide analysis and showed that the expression of these two gene clusters is altered in the same way in 35 and 180 days-old rats (Table 5).
Conclusions
A number of quantitative or semi-quantitative RT-PCR analyses have been conducted to investigate transcriptional changes in the hypothalamus after nutrient restriction during the critical period of perinatal development. These studies have revealed that protein or calorie restriction during gestation and/or suckling is associated with an altered hypothalamic expression of several anorexigenic and orexigenic genes [15,18]. Whilst such observations can give a cue about the mechanisms by which undenutrition in early life affects the hypothalamic circuits regulating food intake and energy expenditure, the possibility exists that these transcriptional changes might be a secondary phenomena rather than an initiating mechanism. Here we have performed a comparative genome wide analysis of the transcrip-tome in the hypothalamus of metabolic programmed rats versus controls. Based on the hypothesis that variations in gene
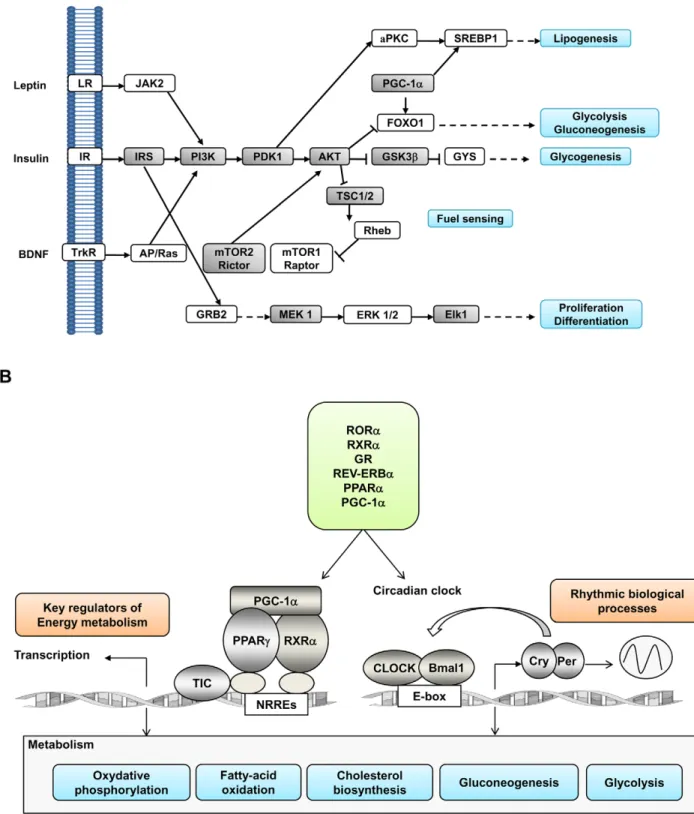
expression levels often reflect changes in gene’s activity and that transcriptional networks are at the heart of physiological functions, we identified two gene clusters regulating common cellular processes whose expression is coordinately regulated by perinatal protein restriction. The first one is constituted by several genes of the insulin and leptin signaling pathway which, additionally, act as gate keeper genes for regulation of nutrient sensing (Figure 2). The second cluster encompasses a functional network of nuclear receptors and co-regulators of transcription involved in the detection and use of lipid nutrients as fuel which, in addition, link temporal and nutritional cues to metabolism trough their tight interaction with the circadian clock.
Given the abundance and diversity of cell types constituting the Central Nervous System and the complexity of the interaction between them, one inherent limitation of the microarray and quantitative PCR analysis in brain tissue is their lack of cellular resolution. This remains a challenging issue which is of important concern when we want to determine the functional relevance of transcription changes. Indeed, although many hypothalamic neurons express the same nutrient sensing and signaling transduction proteins, they use the detected information in different, and sometimes opposite, ways to regulate cell activity or gene expression. For instance, AgRP and POMC expressing neurons located within the arcuate nucleus decrease or increase, respectively, their firing rate in response to glucose [51]. Similarly, leptin activates PI3K in POMC neurons but reduces PI3K activity in AgRP neurons [52]. Furthermore, the specific deletion of AMPK from POMC neurons leads to an increased expression ratio of orexigenic versus anorexigenic genes [53]. In contrast, no changes in gene expression are observed after the targeted loss-of-function mutation of AMPK in AgRP neurons [53]. These data have been obtained using a combination of molecular genetics and electrophysiological approaches which allow cell-specific genetic deletion and single cell recordings of activity. However, genome wide expression profiling of individual neuronal cells remains a major technical challenge. Nevertheless, in spite of its lack of cellular resolution, the analysis of gene expression using whole hypothalamus has provided important cues regarding the hypothalamic control of energy homeostasis [54] and microarray analysis of gene co-expression relationships in brain can open new avenues to investigate molecular mechanisms related to altered brain function [55]. In this context, the herein reported results provide a valuable starting point for the direct and systematic experimental analysis of the role of the hypothalamus in the physiopathological disturbances associated with the programming of the metabolic syndrome by protein restriction in early life.
Materials and Methods Animals
All experiments were performed in accordance with the European Communities Council Directive of 24 November 1986 (86/609/EEC). We used an established model of metabolic programming consisting on the restriction of protein to the dam during gestation and lactation as previously described [14]. In brief, eight virgin female Spraguey Dawley rats weighing 200– 250 g were obtained from Charles River (France), and placed under a 12 h light/dark cycle (lights on at 07:00) with food and water ad libitum for at least ten days before any experimental manipulation. They were then mated to 3 month old males of the same strain (2 females to 1 male). Following confirmation of mating by the visualisation of spermatozoa in a vaginal smear, pregnant dams were housed individually and fed either a control (20 g protein/100 g) or an isocaloric low-protein (LP) diet (8 g Table 5. Real time PCR quantification of the genes belonging
to the functional and transcriptional gene clusters identified by the genome-wide DNA microarray analysis.
35 Days 180 Days
Gene Controls Low protein Controls Low protein IRS1 1.0060.05 1.4460.13* 1.0060.02 1.3960.10** PI3K 1.0060.02 1.2760.04** 0.9460.11 1.3360.07* PDK1 1.0060.06 1.1960.O4 * 1.0060.03 1.3260.05** Akt3 1.0060.05 1.2060.04* 1.0060.05 1.3660.10* GSK3b 0.9460.08 1.4160.08* 0.9860.07 1.3260.07* Tsc1 0.9760.07 1.3960.12* 1.0160.11 1.4360.01* Tsc2 1.0560.03 0.9960.06 1.0060.05 1.1560.05 CBL 0.9360.08 1.3660.06* 1.0060.09 1.2560.03* GR 1.0060.057 0.6160.07* 1.0060.07 1.3960.06* TRb 1.0360.10 1.4360.11* 1.0160.07 1.4260.11* RORa 1.0160.06 1.2460.05* 1.0060.06 1.5760.06** RORb 1.0060.03 1.2160.04* 0.9160.09 1.4460.13* PPARc 1.0060.07 0.5960.08* 1.0360.04 0.7160.01*** RXRa 0.9760.03 1.2160.007* 1.0260.02 1.2060.06* ERa 1.0260.09 1.5360.12** 1.0060.06 1.6260.14* AR 1.0760.03 1.2560.04* 1.0060.04 1.3060.05* TR4 1.0060.04 1.3160.07** 0.9560.04 1.3360.13* GCNF 1.0460.08 1.3560.04** 1.0160.08 1.3260.07* PGC-1a 1.0060.04 1.2760.04** 0.9660.04 1.1860.02** PGC-1b 1.0060.02 1.2560.06** 1.0060.05 1.4260.03* Quantitative RT-PCR experiments were performed in triplicate using non-pooled mRNA samples from 3 to 4 different animals and b-actin as internal control. The relative amount of the different genes normalized to the endogenous expression of b-actin was calculated by the formula 2-DDC
Twhere
DDCT= (CTgene- CTb-actin) LP rat - (CTgene- CTb-actin) control rat.
*P,0.05; **P,0.01;
***P,0.001 compared with control animals of the same age. doi:10.1371/journal.pone.0013537.t005
Figure 2. Schematic illustration of the functional (A) and transcriptional (B) gene clusters altered by perinatal protein restriction. (A) Insulin signaling pathway with emphasis on its role in regulating energy homeostasis and nutrient sensing. Lines with end arrows indicate activation, whereas those with perpendicular bars at the end indicate inhibition. Genes exhibiting altered hypothalamic mRNA expression levels in LP rats are represented in shady boxes. (B) Coordinated regulation of energy metabolism and the circadian clock. The diagram illustrates how PGC-1a and nuclear receptors recruit protein complexes and bind, on one hand, to NR response elements (NRREs) within the promoter region of target genes regulating energy metabolism and, on the other hand, to CLOCK and Bmal1, the core genes of the circadian clock. Through the coordinated regulation of the circadian clock and energy metabolism, PGC-1a, RORa and REV-ERBa play an essential role in the adaptation of metabolic gene expression to the temporal availability of nutrients. We found that the expression of the two former genes as well as that of GR, CLOCK and several other NR was permanently altered by perinatal protein restriction. LR = Leptin receptor; IR = Insulin receptor; TrkR = tyrosine kinase receptor. doi:10.1371/journal.pone.0013537.g002
protein/100 g) through pregnancy and lactation. Both diets were purchased from Arie Blok (Woerden, The Netherlands) and their composition is provided in Table S1. At delivery, litter size was adjusted to eight pups per dam. At weaning (21 days), all male pups from the control (C) and the low-protein (LP) groups were fed standard laboratory chow. Animals were killed at 6 months of age under non fasting conditions using a rising concentration of CO2
and cervical dislocation. Special care was taken to sacrifice all the animals at the same time of the day, 9–10 o’clock in the morning, to prevent the bias due to circadian variations in gene expression. Trunk blood was collected for the analysis of insulin and the metabolites, glucose, triglycerides, cholesterol and fatty acids. Bilateral fat depots from 3 regions (inguinal, retroperitoneal and epididymal) as well as the mesenteric fat pad, were dissected, weighed and summed to provide a measure of body fat, referred to as abdominal fat in the text.
Hormone and metabolite determinations
Serum from trunk blood was assayed for insulin using an assay kits from Linco Research Inc. Triglycerides, cholesterol and fatty acids were analyzed by enzymatic methods (Triglyce´rides enzymatiques PAP 150, BioMe´rieux; Cholesterol RTU, Biome´r-ieux). Serum glucose concentrations were determined with a blood glucose monitor (Accu-CheckH, Roche Diagnostics).
DNA microarrays
Total RNA from the hypothalamus was extracted using the TRIzol reagent (Invitrogene, Cergy Pontoise, France) and subsequently purified using the mini-column purification kit NucleoSpinH from Macherey-Nagel according to the manufac-turer’s instructions. The quantity and quality of the purified RNA was evaluated using a NanoDrop ND-1000 spectrophotometer and the Angilent 2100 Bio-analyzer. Four micrograms of each RNA sample were sent to the NimbleGen expression array platform. DscDNA synthesis, DNA end-labeling, hybridization, scanning, and data normalization were performed at NimbleGen, which provided the final data file. A total of 10 Rattus norvegicus 385K Arrays (Nimblegen) were conducted using total RNA samples from five control and five LP rats issued from 3–4 different litters. All data is MIAME compliant and the raw data has been deposited in the MIAME compliant database Gene Expression Omnibus (GEO).
Real-time quantitative RT-PCR
2mg of purified RNA extracted from the whole hypothalamus of 35 and 180 days-old animals, was reverse transcribed using Superscript II RNAseH- Reverse-Transcriptase (Invitrogen) in a total volume of 20ml. The resulting cDNA was diluted 50-fold in DNAse and RNAse-free water. Thereafter, 4.5ml of each cDNA diluted sample was used as template for PCR amplification using SYBR Green (Qiagen, Courtaboeuf, France) as fluorogenic interca-lating dye and b-actin as an internal reference for normalization of target gene mRNA expression. The PCR parameters were: an initial denaturation step of 5 min at 95uC followed by 40 cycles of 30 s at 95uC and 30 s at 60uC. The sequences of primers used for the amplification are presented in Table S2.
Data analysis
To characterize the differences in the profile of gene expression between control and LP rats, and to classify genes and biological samples hierarchically, we used the Gene Cluster program [56]. To this end, the expression level of each gene was first log transformed and then median-centered (relatively to its median
expression across all samples), so that relative variations rather than absolute values were used for interpretation. The clustering method used here was an average linkage with the Pearson correlation coefficient as similarity metric. Results were displayed using the TreeView program [56]. In order to validate the most significant differences, Student’s t-test for paired samples was performed with the XLStat ProH statistical software (Addinsoft, Paris, France). We used the P-value with a statistical significance of 0.003 corresponding to a false discovery rate of 10%. In this way, two groups of genes corresponding to up-regulated and down regulated genes whose expression was altered by perinatal undernutrition were identified. The two groups of genes differentially expressed in the hypothalamus of LP rats in relation to control animals, were then analyzed using the Gene Ontology (GO) database and the functional classification tool from the DAVID database (http://david.abcc.ncifcrf.gov/). This latter program assigns genes to functional groups within various ontologies and calculates the statistical probability of a particular functional group being over- or under represented. To identify the genes involved in two or more categorized functions, both the up-and down-regulated genes were pooled in their respective Gene Ontology category and distributed in a Venn diagram. The totality of genes for each group (up- and down-regulated) initially submitted to the DAVID database was taken as 100% to obtain the proportion of over-expressed and under-expressed genes in each functional category.
The experimental results of the RT-PCR analysis are expressed as means 6 S.E.M. The relative expression levels of the mRNAs in the different hypothalamic samples were calculated using the compara-tive DCTmethod [57] and b-actin RNA as housekeeping gene. To
ascertain the differences between the groups, data were compared by Student’s-t-test. Statistical significance was set at P,0.05.
Supporting Information
Figure S1 Unsupervised hierarchical clustering of gene expres-sion in the hypothalamus of 6 months-old rats born to dams fed a control or a low-protein diet during gestation and suckling. All the animals were fed standard chow since weaning. Cluster colors represent low (green) and high (red) expression levels of probe sets from 10 independent hybridizations corresponding to five control and five LP rats. Note the homogeneous distribution of the genes into two clearly defined up-regulated and down regulated clusters as well as the consistency of the expression changes induced by the maternal diet.
Found at: doi:10.1371/journal.pone.0013537.s001 (6.46 MB TIF)
Table S1 Composition of experimental diets.
Found at: doi:10.1371/journal.pone.0013537.s002 (0.03 MB DOC)
Table S2 Sequences of primers used for the real time RT-PCR analysis.
Found at: doi:10.1371/journal.pone.0013537.s003 (0.04 MB DOC)
Acknowledgments
The authors gratefully acknowledge M. Jean Louis Lescure for his assistance with the care of the animals.
Author Contributions
Conceived and designed the experiments: FBJ. Performed the experiments: ROS RJBM OGQ SLdS. Analyzed the data: ROS AB RH FBJ. Contributed reagents/materials/analysis tools: SLdS RMdC. Wrote the paper: ROS FBJ.
References
1. Keith SW, Redden DT, Katzmarzyk PT, Boggiano MM, Hanlon EC, et al. (2006) Putative contributors to the secular increase in obesity: exploring the roads less traveled. Int J Obes (Lond) 30: 1585–1594.
2. Ravelli GP, Stein ZA, Susser MW (1976) Obesity in young men after famine exposure in utero and early infancy. N Engl J Med 295: 349–353.
3. Hales CN, Barker DJ (2001) The thrifty phenotype hypothesis. Br Med Bull 60: 5–20.
4. Gluckman PD, Hanson MA (2004) The developmental origins of the metabolic syndrome. Trends in Endocrinology and Metabolism 15: 183–187. 5. Bieswal F, Ahn M-T, Reusens B, Holvoet P, Raes M, et al. (2006) The
Importance of Catch-up Growth after Early Malnutrition for the Programming of Obesity in Male Rat[ast]. Obesity 14: 1330–1343.
6. Zambrano E, Bautista C, Dea´s M, Martı´nez-Samayoa P, Gonza´lez-Zamorano M, et al. (2006) A low maternal protein diet during pregnancy and lactation has sex- and window of exposure-specific effects on offspring growth and food intake, glucose metabolism and serum leptin in the rat. J Physiol 15: 221–230.
7. Krechowec SO, Vickers M, Gertler A, Breier BH (2006) Prenatal influences on leptin sensitivity and susceptibility to diet-induced obesity. J Endocrinol 189: 355–363.
8. Desai M, Babu J, Ross MG (2007) Programmed metabolic syndrome: prenatal undernutrition and postweaning overnutrition. Am J Physiol Regul Integr Comp Physiol 293: R2306–2314.
9. Erhuma A, Salter AM, Sculley DV, Langley-Evans SC, Bennett AJ (2007) Prenatal exposure to a low-protein diet programs disordered regulation of lipid metabolism in the aging rat. Am J Physiol Endocrinol Metab 292: E1702– 1714.
10. McMullen S, Langley-Evans SC (2005) Maternal low-protein diet in rat pregnancy programs blood pressure through sex-specific mechanisms. Am J Physiol Regul Integr Comp Physiol 288: R85–90.
11. Vickers MH, Breier BH, Cutfield WS, Hofman PL, Gluckman PD (2000) Fetal origins of hyperphagia, obesity, and hypertension and postnatal amplification by hypercaloric nutrition. Am J Physiol Endocrinol Metab 279: E83–87. 12. Desai M, Gayle D, Han G, Ross MG (2007) Programmed Hyperphagia Due to
Reduced Anorexigenic Mechanisms in Intrauterine Growth-Restricted Off-spring. Reproductive Sciences 14: 329–337.
13. Bellinger L, Langley-Evans S (2005) Fetal programming of appetite by exposure to a maternal low-protein diet in the rat. Clin Sci (Lond) 109: 413–420. 14. Lopes de Souza S, Orozco-Solis R, Grit I, Manhaes de Castro R,
Bolanos-Jimenez F (2008) Perinatal protein restriction reduces the inhibitory action of serotonin on food intake. European Journal of Neuroscience 27: 1400– 1408.
15. Orozco-So´lis R, Lopes de Souza S, Barbosa Matos RJ, Grit I, Le Bloch J, et al. (2009) Perinatal undernutrition-induced obesity is independent of the develop-mental programming of feeding. Physiology & Behavior 96: 481–492. 16. Plagemann A, Rittel F, Waas T, Harder T, Rohde W (1999) Cholecystokinin-8S
levels in discrete hypothalamic nuclei of weanling rats exposed to maternal protein malnutrition. Regulatory Peptides 85: 109–113.
17. Plagemann A, Waas T, Harder T, Rittel F, Ziska T, et al. (2000) Hypothalamic neuropeptide Y levels in weaning offspring of low-protein malnourished mother rats. Neuropeptides 34: 1–6.
18. Ikenasio-Thorpe BA, Breier BH, Vickers MH, Fraser M (2007) Prenatal influences on susceptibility to diet-induced obesity are mediated by altered neuroendocrine gene expression. J Endocrinol 193: 31–37.
19. Plagemann A, Harder T, Rake A, Melchior K, Rohde W, et al. (2000) Hypothalamic nuclei are malformed in weanling offspring of low protein malnourished rat dams. J Nutr 130: 2582–2589.
20. Yura S, Itoh H, Sagawa N, Yamamoto H, Masuzaki H, et al. (2005) Role of premature leptin surge in obesity resulting from intrauterine undernutrition. Cell Metab 1: 371–378.
21. Sardinha FLC, Telles MM, Albuquerque KT, Oyama LM, Guimara˜es PAMP, et al. Gender difference in the effect of intrauterine malnutrition on the central anorexigenic action of insulin in adult rats. Nutrition 22: 1152–1161. 22. Barabasi A-L, Oltvai ZN (2004) Network biology: understanding the cell’s
functional organization. Nat Rev Genet 5: 101–113.
23. Sieberts SK, Schadt EE (2007) Moving toward a system genetics view of disease. Mamm Genome 18: 389–401.
24. Man PS, Lawrence CB (2008) Galanin-like peptide: a role in the homeostatic regulation of energy balance? Neuropharmacology 55: 1–7.
25. Nogueiras R, Diaz-Arteaga A, Lockie SH, Velasquez DA, Tschop J, et al. (2009) The endocannabinoid system: role in glucose and energy metabolism. Pharmacol Res 60: 93–98.
26. Guard DB, Swartz TD, Ritter RC, Burns GA, Covasa M (2009) Blockade of hindbrain NMDA receptors containing NR2 subunits increases sucrose intake. Am J Physiol Regul Integr Comp Physiol 296: R921–928.
27. Jensen CB, Martin-Gronert MS, Storgaard H, Madsbad S, Vaag A, et al. (2008) Altered PI3-Kinase/Akt Signalling in Skeletal Muscle of Young Men with Low Birth Weight. PLoS ONE 3: e3738.
28. Sampaio de Freitas M, Garcia De Souza EP, Vargas da Silva S, da Rocha Kaezer A, da Silva Vieira R, et al. (2003) Up-regulation of phosphatidylinositol 3-kinase and glucose transporter 4 in muscle of rats subjected to maternal undernutrition. Biochim Biophys Acta 1639: 8–16.
29. Plum L, Ma X, Hampel B, Balthasar N, Coppari R, et al. (2006) Enhanced PIP3 signaling in POMC neurons causes KATP channel activation and leads to diet-sensitive obesity. J Clin Invest 116: 1886–1901.
30. Nikoulina SE, Ciaraldi TP, Mudaliar S, Mohideen P, Carter L, et al. (2000) Potential role of glycogen synthase kinase-3 in skeletal muscle insulin resistance of type 2 diabetes. Diabetes 49: 263–271.
31. Eldar-Finkelman H, Schreyer SA, Shinohara MM, LeBoeuf RC, Krebs EG (1999) Increased glycogen synthase kinase-3 activity in diabetes- and obesity-prone C57BL/6J mice. Diabetes 48: 1662–1666.
32. Morton GJ, Gelling RW, Niswender KD, Morrison CD, Rhodes CJ, et al. (2005) Leptin regulates insulin sensitivity via phosphatidylinositol-3-OH kinase signaling in mediobasal hypothalamic neurons. Cell Metab 2: 411– 420.
33. Wang C, Bomberg E, Billington C, Levine A, Kotz CM (2007) Brain-derived neurotrophic factor in the hypothalamic paraventricular nucleus reduces energy intake. Am J Physiol Regul Integr Comp Physiol 293: R1003–1012. 34. Unger TJ, Calderon GA, Bradley LC, Sena-Esteves M, Rios M (2007) Selective
deletion of Bdnf in the ventromedial and dorsomedial hypothalamus of adult mice results in hyperphagic behavior and obesity. J Neurosci 27: 14265– 14274.
35. Lage R, Dieguez C, Vidal-Puig A, Lopez M (2008) AMPK: a metabolic gauge regulating whole-body energy homeostasis. Trends Mol Med 14: 539–549. 36. Woods SC, Seeley RJ, Cota D (2008) Regulation of Food Intake Through
Hypothalamic Signaling Networks Involving mTOR. Annual Review of Nutrition 28: 295–311.
37. Inoki K, Li Y, Zhu T, Wu J, Guan KL (2002) TSC2 is phosphorylated and inhibited by Akt and suppresses mTOR signalling. Nat Cell Biol 4: 648– 657.
38. Huang J, Manning BD (2009) A complex interplay between Akt, TSC2 and the two mTOR complexes. Biochem Soc Trans 37: 217–222.
39. Desvergne B, Michalik L, Wahli W (2006) Transcriptional Regulation of Metabolism. Physiol Rev 86: 465–514.
40. Bookout AL, Jeong Y, Downes M, Yu RT, Evans RM, et al. (2006) Anatomical profiling of nuclear receptor expression reveals a hierarchical transcriptional network. Cell 126: 789–799.
41. Sato T, Matsumoto T, Yamada T, Watanabe T, Kawano H, et al. (2003) Late onset of obesity in male androgen receptor-deficient (AR KO) mice. Biochem Biophys Res Commun 300: 167–171.
42. Heine PA, Taylor JA, Iwamoto GA, Lubahn DB, Cooke PS (2000) Increased adipose tissue in male and female estrogen receptor-alpha knockout mice. Proc Natl Acad Sci U S A 97: 12729–12734.
43. Musatov S, Chen W, Pfaff DW, Mobbs CV, Yang XJ, et al. (2007) Silencing of estrogen receptor alpha in the ventromedial nucleus of hypothalamus leads to metabolic syndrome. Proc Natl Acad Sci U S A 104: 2501–2506.
44. Schibler U, Sassone-Corsi P (2002) A Web of Circadian Pacemakers. Cell 111: 919–922.
45. Preitner N, Damiola F, Luis Lopez M, Zakany J, Duboule D, et al. (2002) The Orphan Nuclear Receptor REV-ERB[alpha] Controls Circadian Transcription within the Positive Limb of the Mammalian Circadian Oscillator. Cell 110: 251–260.
46. Akashi M, Takumi T (2005) The orphan nuclear receptor ROR[alpha] regulates circadian transcription of the mammalian core-clock Bmal1. Nat Struct Mol Biol 12: 441–448.
47. Liu C, Li S, Liu T, Borjigin J, Lin JD (2007) Transcriptional coactivator PGC-1[agr] integrates the mammalian clock and energy metabolism. Nature 447: 477–481.
48. Orozco-So´lis R, Barbosa Matos RJ, Lopes de Souza S, Grit I, Kaeffer B, et al. (2010) Perinatal nutrient restriction induces long-lasting alterations in the circadian expression pattern of genes regulating food intake and energy metabolism. International Journal of Obesity (In press).
49. Panda S, Antoch MP, Miller BH, Su AI, Schook AB, et al. (2002) Coordinated Transcription of Key Pathways in the Mouse by the Circadian Clock. Cell 109: 307–320.
50. Turek FW, Joshu C, Kohsaka A, Lin E, Ivanova G, et al. (2005) Obesity and metabolic syndrome in circadian Clock mutant mice. Science 308: 1043– 1045.
51. Levin BE, Dunn-Meynell AA, Routh VH (2001) Brain glucosensing and the K(ATP) channel. Nat Neurosci 4: 459–460.
52. Xu AW, Kaelin CB, Takeda K, Akira S, Schwartz MW, et al. (2005) PI3K integrates the action of insulin and leptin on hypothalamic neurons. J Clin Invest 115: 951–958.
53. Claret M, Smith MA, Batterham RL, Selman C, Choudhury AI, et al. (2007) AMPK is essential for energy homeostasis regulation and glucose sensing by POMC and AgRP neurons. The Journal of Clinical Investigation 117: 2325–2336.
54. Morrison CD, Morton GJ, Niswender KD, Gelling RW, Schwartz MW (2005) Leptin inhibits hypothalamic Npy and Agrp gene expression via a mechanism that requires phosphatidylinositol 3-OH-kinase signaling. Am J Physiol En-docrinol Metab 289: E1051–1057.
55. Oldham MC, Konopka G, Iwamoto K, Langfelder P, Kato T, et al. (2008) Functional organization of the transcriptome in human brain. Nat Neurosci 11: 1271–1282.
56. Eisen MB, Spellman PT, Brown PO, Botstein D (1998) Cluster analysis and display of genome-wide expression patterns. Proceedings of the National Academy of Sciences of the United States of America 95: 14863–14868.
57. Livak KJ, Schmittgen TD (2001) Analysis of Relative Gene Expression Data Using Real-Time Quantitative PCR and the 2-[Delta][Delta]CT Method. Methods 25: 402–408.