Science Arts & Métiers (SAM)
is an open access repository that collects the work of Arts et Métiers Institute of Technology researchers and makes it freely available over the web where possible.
This is an author-deposited version published in: https://sam.ensam.eu Handle ID: .http://hdl.handle.net/10985/15275
To cite this version :
Baris AYKENT, Damien PAILLOT, Frédéric MERIENNE, Andras KEMENY - Effect of Closed-Loop Motion Cueing Algorithm for a Six-Degrees-of-Freedom Dynamic Simulator on Pupil Diameter as a Driver Stress Factor - SAE Technical Paper n°2018-01-6004, p.1-11 - 2018
Any correspondence concerning this service should be sent to the repository Administrator : [email protected]
Effect of Closed-Loop Motion Cueing Algorithm for
a Six-Degrees-of-Freedom Dynamic Simulator on
Pupil Diameter as a Driver Stress Factor
Baris Aykent Hexagon Studio
Damien Paillot and Frederic Merienne Arts et Metiers ParisTech Andras Kemeny Arts et Metiers ParisTech and Renault SAS
Citation: Aykent, B., Paillot, D., Merienne, F., and Kemeny, A., “Effect of Closed-Loop Motion Cueing Algorithm for a
Six-Degrees-of-Freedom Dynamic Simulator on Pupil Diameter as a Driver Stress Factor,” SAE Technical Paper 2018-01-6004, 2018, doi:10.4271/2018-01-6004.
Abstract
This paper describes the contribution of the closed-loop control of the motion platform (six degrees of freedom: longitudinal, lateral, and vertical displacements; pitch, roll, yaw) and motion platform’s three-dimensional (3D) displacement scale factor (SF) (0.2 and 1.0) on eye pupil diameter (PD) as an objective measure of driver cognitive
load. Longitudinal, lateral, and vertical accelerations as well as longitudinal, lateral, and vertical positions from the center of gravity (CG) of the vehicle were registered through the
driving simulation software SCANeRstudio® from OKTAL.
Closed-loop control decreases the driver mental load. This type of closed-loop control can be used to decrease the driver mental load.
1. Introduction
Driving simulator is a sophisticated device that enables to put the driver in the loop, as in real time, in order to evaluate vehicle prototypes such as advanced driver
assistance systems (ADAS) (electronic stability program (ESP), antilock braking system (ABS), adaptive cruise control (ACC), etc.) [1, 2, 3] and human factors [4, 5, 6, 7, 8, 9, 10, 11, 12]. Thus it has the effect of reducing the time and costs of proving ground tests and prototypes in the pre-development tests.
This article deals with the motion platform effect on driver’s cognitive load in a six-degrees-of-freedom dynamic driving simulator. Mental workload can be predicted by some methods, one of them is called “pupillometry,” where the metrics of the change of the pupil diameter (PD) is used to identify the subject’s cognitive load. In this paper, we explained how this methodology has been used in human machine inter-action (HMI) studies [13]. Cognitive load is generally described as the association between the mental requests placed on a subject and the cognitive abilities of that person [14]. There are some techniques how mental load can be estimated. They can be divided into three groups: performance, subjective, and physiological measurements. Performance metrics try to
predict how thoroughly the user performs a supplementary assignment. Subjective measurement consists of the estima-tion of users’ self-report about their own workload by completing a questionnaire. Ultimately, a physiological measure is pursued which is related to the increase of mental pressure (i.e., pupillometry). In order to assess the mental load utilizing pupillometry, task-evoked pupillary response (TEPR) method can be used [15]. In accordance with this phenom-enon, the subject’s pupil will widen as he/she comes across with a complicated assignment, while the pupil will constrict in diameter when the task is finished and the person does not experience any additional cognitive pressure. This broadly observed effect is used in estimating mental workload in human machine interaction.
The pupil size is not solely influenced by mental load but also by illumination. Therefore, if mental load is to be evalu-ated, lighting conditions are required to be controlled [16].
Systems for recording eye motion have been available for about a century [17]. With the improvement of the technology, more effective eye tracking systems are being produced [18].
PD is generally measured by head-mounted eye tracking apparatus; however nowadays also remote-controlled eye
Keywords
Driving simulator, Motion platform, Pupil diameter, Cognitive load, Closed-loop control
trackers are declared to be precise enough for PD measure-ment [13]. Cognitive load estimation on tasks was accom-plished in front of a computer screen equipped with eye tracking cameras [19]. Significant differences in PDs for different difficulty levels of duty were obtained [19].
Palinko et al. applied pupillometry method to predict mental load for driving simulator experiments by a remote eye tracker [20]. The cognitive load predictions based on the pupil size data and the driving experiments data were compared. The pupillary and driving performance measure-ments indicate high relationships promising that remote eye tracking could ensure trustworthy driver cognitive pressure estimation, in particular for driving simulators [20].
However, the pupil size depends on both cognitive load and illumination conditions. In order to accurately estimate cognitive load, these two influences must be decoupled. A predictor of the pupil’s reaction to light and cognitive load was designed to estimate fluctuations in PD [21, 22].
The oculomotor behavioral changes were examined while subjects performed auditory and driving tasks [23]. Comparing with the subjects’ behavior in the driving-only task, results showed an increase in blink frequency during the combined driving and auditory task. Also during the dual task, the mean PD and horizontal vergence increased. No significant change in fixation frequency was found [23].
In another study, it was explored how illumination in various regions of the subject’s field of view influences the PD [24]. The results depicted that the further the light stimulus is from the optical axis of the eye, the smaller its reaction on the PD shall be [24].
Personal navigation devices (PNDs) were tested in experi-ments conducted with a high-fidelity driving simulator. It was found that drivers using a navigation system with a graphical display indeed spent less time looking at the road compared to those using a navigation system with spoken directions only. Furthermore, glancing at the display was correlated with higher variance in driving performance measures [25, 26].
An approach for predicting effects of in-car interfaces by modeling behavior in a cognitive architecture was described. The proposed approach centers on integrating a user model for the interface with an existing driver model that accounts for basic aspects of driver behavior (i.e., steering and speed control). By running the integrated model and having it interact with the interface while driving, priori predictions of the effects of interface use on driver performance can be gener-ated. The approach is explained by comparing four samples of dialing interfaces for an in-car, hands-free cellular phone. It also offers an experimental study that confirms the subjec-tive and objecsubjec-tive predictions of the model [27].
Gaze guidance has the potential to become a valuable driving assistance system. It was shown that complex gaze-contingent stimuli can guide attention and reduce the number of accidents in a simple driving simulator. The analysis of the recorded gaze data revealed that the gaze-contingent cues indeed had a gaze-guiding effect, triggering a significant shift in gaze position toward the highlighted direction. This gaze shift was not accompanied by changes in driving behavior, suggesting that the cues do not interfere with the driving task itself [28].
The effects of mobile phone use on drivers’ attention and eye movements in a low-fidelity simulator were tested. The findings
supported the “look-but-fail-to-see” phenomenon. It also revealed that increasing cognitive workload (through mobile phone use and/or increased traffic) decreases driving performance [29].
Blink duration (BD), with respect to blink rate (BR), is a more sensitive and reliable indicator of driver visual workload. Besides considering mean BD values, a detailed analysis revealed that the distribution of BD follows a Gaussian-like curve in normal driving conditions [30].
A method based on wavelet transform and neural networks on pupillometry for mental stress was discussed in [31] during a simulated driving task. Self-reports and PD data showed cognitive load influence, and also significant correla-tions were obtained between these measures. The study inferred that PD signal is an objective metric for cognitive workload detection [31].
Usually, stress (cognitive load) and its measure are playing important roles in human machine interface domain such as driving simulators. Engineers, designers, and ergonomists try to predict the psychophysical situations of the users to adapt the environment they are contacting [32]. The main objective of this kind of adaptation is to improve whole system’s perfor-mance [33, 34, 35]. Especially, it has been deduced that the pupil enlarges as a result of mental load and various origins of stress [15, 36, 37, 38, 39, 40, 56].
The use of fast Fourier transform (FFT) for pupil signal analysis in the frequency domain was introduced by [41]. Analyzing a signal is helpful to see whether significant changes occur within specific frequency bands. In order to identify low-frequency fatigue-associated pupillary movements, [41], evaluated the mean value of the amplitude spectrum for all the frequencies lower than and equal to 0.8 Hz.
It was revealed that the power spectral density (PSD) of pupil signals increases within specific band intervals (0.1-0.5 Hz and 1.6-3.5 Hz) as a function of cognitive load level [[42])]. PD signals were investigated by using the short-time Fourier transform (STFT), which enables to extract the frequency information keeping the time domain [43].
One promising technique for reducing data complexity in recorded signals is wavelet analysis [44, 45, 46]. It was proposed for the use of wavelet analysis for studying PD time series and related to the happening of high-frequency changes (i.e., higher than 50 Hz) to instances of cognitive pressure. A very few studies have applied wavelet transforms on PD signals [47], and PD oscillations were evaluated to estimate sleepiness levels [48].
In our study here, section 2 explains the proposed approach, section 3 describes the method, section 4 highlights the results and discussion, and finally section 5 gives a conclusion.
2. Proposed Approach
In a driving simulator experiment the driver, as in a real-life condition, is integrated in the vehicle. It means that the driver is more like in fusion with his/her vehicle during the drive and especially in accordance with the slopes of the road. Because the driver controls the vehicle, he/she anticipates the movement of his/her vehicle and feels it as a part of his/her own body. So, his/her head tilts with the movement of the
vehicle in the slopes to feel the acceleration in accordance with the proprioceptive feedbacks of the whole system (body of the driver and vehicle).
If the driving simulator consists of a motion platform or it does not have a motion platform, it can affect the cognitive load accordingly, as well.
Comparatively, the driver on a driving simulator without a motion platform (static platform) anticipates the motion of his/her vehicle much less than the driver on a driving simu-lator with a motion platform (dynamic platform).
For this reason, the static platform is supposed to cause more cognitive load than the dynamic platform. We used the PD in order to extract the mental load levels for both cases.
One of the main objectives of this research is to develop a method of quantitative estimation for cognitive load.
Practical/commercial applicability and usage of this study would be to improve HMI control flaws.
2.1. Questions of Research
The proposed approach of this research is to compare the effect of motion platform on PD as an objective measure of the driver mental load.
Following the statement of the proposed scientific issues, the questions of research are the following ones:
• How does the PD (driver cognitive load) differ
depending on the closed- or on the open-loop control of the platform for the same driving scenario with the same lighting conditions?
• How does the PD (driver cognitive load) differ
depending on the hexapod platform travel factor for the same driving scenario with the same lighting conditions?
• How do the three-dimensional (3D) positions and the 3D
accelerations of the vehicle center of gravity (CG) interact/correlate with the PD (driver cognitive load)?
3. Method
3.1. Protocol
Two conditions were driven by the same subjects (N = 28) for the specific scenario with the same illumination conditions on the driving simulator in real time. The subjects were asked to drive a specific driving scenario on the simulator as with static platform and with dynamic platform. The experiment protocol involved a driving situation on a country road scenario. Figure 1 depicts the X-Y trajectory and the vehicle velocity profile, which were realized in the experiment phases. The whole exper-imental phase was completed with a constant velocity of 60 km/h in 120 s.
The experiment consists of comparing the PD data extracted from the eye tracking measurements under the two conditions: static platform and dynamic platform. These data were correlated to the 3D positions and the 3D accelerations of the vehicle CG.
3.2. Material
This research work was realized under the dynamic as well as static operations of the Simulator Automobile of Arts et Métiers (SAAM) six-DOF dynamic driving simulator (Figure 2, Tables 1, and 2 [[8, 49]]). It operates on a Renault Twingo 2 cabin with the original control instruments (gas, brake pedals, steering wheel) with haptic feedback to the user. The visual system is realized by a 150° cylindrical view. With the driving cabin of the simulator, the multilevel measuring techniques are available: vehicle model and motion platform level dynamics real-time data acquisition via SCANeRstudio driving simulation software, vestibular level dynamics real-time data acquisition via Xsens motion tracker, arm and neck muscle dynamics measurement via BIOPAC EMG
-2400 -2200 -2000 -1800 -1600 -1400 -1200 -100 0 100 200 300 400 500 600 700
Earth fixed longitudinal position of the vehicle centre of gravity (m)
Earth fixed lateral position
of the vehicle centre of gravity (m
) 0 20 40 60 80 100 120 0 10 20 30 40 50 60 70 Time (s) Vehicle longitudinal velocity (km/h)
EFFECT OF CLOSED-LOOP MOTION CUEING ALGORITHM FOR A SIX-DEGREES-OF-FREEDOM DYNAMIC SIMULATOR
(electromyography) device, and human’s center of pressure displacements measuring equipment Technoconcept to check postural stability [4, 5, 6, 7, 8, 50].
Figure 2 illustrates the SAAM moving-base driving simu-lator. It could be operated as with static or dynamic platform by switching the “motion platform” module off and on, respec-tively. As seen in the figure, in general there are three dynam-ical systems of the SAAM driving simulator. They are vehicle dynamics, motion platform dynamics (motion system), human vestibular dynamics (proprioceptive system), neuro-muscular dynamics (i.e., steering maneuvers), and eye tracking. By manipulating or controlling the vehicle dynamics
that moves in the vision system and the motion platform dynamics via motion drive algorithms, their contributions on human vestibular dynamics and eye tracking (in our study here, PD as an objective metric of cognitive load) can be compared.
The motion cueing algorithm, which was a coupling of the two different algorithms (model reference adaptive control (MRAC) and linear quadratic regulator (LQR), seen in Figure 3) explained in [5, 6, 46, 50], was included in the
SCANeRstudio® driving simulation software via dll plugin
in order to accomplish the real-time driving experiments with the participations of the subjects.
3.3. Measurements
PDs were measured to obtain the driver cognitive load levels in real time on the driving simulator at the same driven scenario for the dynamic platform and the static platform conditions seen in Figure 4 via using the SensoMotoric
Instruments (SMI)® glasses [Sensomotoric [52]]. The
sampling frequency for the data registration during the sensor measurements was 60 Hz. Figure 5 illustrates the cali-bration pattern used for the experiments. A three-point-based calibration pattern was chosen and applied in order to calibrate the SMI® eye tracking glasses [SensoMotoric [52]] before experiments with the driving simulator. The partici-pant was asked to look at the points marked with 1, 2 and 3 consecutively. Then the calibration process was accomplished for the experimental data acquisition.
Vehicle level (cabin) data registered by SCANeRstudio®
software can be splitted as command data (steering wheel angle, steering wheel torque, gas pedal input, brake pedal input, etc.), motion platform level (translational and angular accelerations of the hexapod platform), vehicle level data (vehicle dynamics; engine; axle dynamics such as suspension and damping; axle kinematics such as camber angle, toe angle, and caster angle; etc.), frequential analysis of the motion platform and vehicle levels (by using FFT) [8].
Figure 6 shows the 3D accelerations of the vehicle CG during the real-time driving simulator experiments.
Figure 7 depicts the 3D positions of the vehicle CG during the real-time driving simulator experiments.
TABLE 1 Limits of each degree of freedom for the dynamic
simulator [5, 8, 49, 51].
DOF Displacement Velocity Acceleration
Pitch ±22 deg ±30 deg/s ±500 deg/s2
Roll ±21 deg ±30 deg/s ±500 deg/s2
Yaw ±22 deg ±40 deg/s ±400 deg/s2
Heave ±0.18 m ±0.30 m/s ±0.5 g
Surge ±0.25 m ±0.5 m/s ±0.6 g
Sway ±0.25 m ±0.5 m/s ±0.6 g
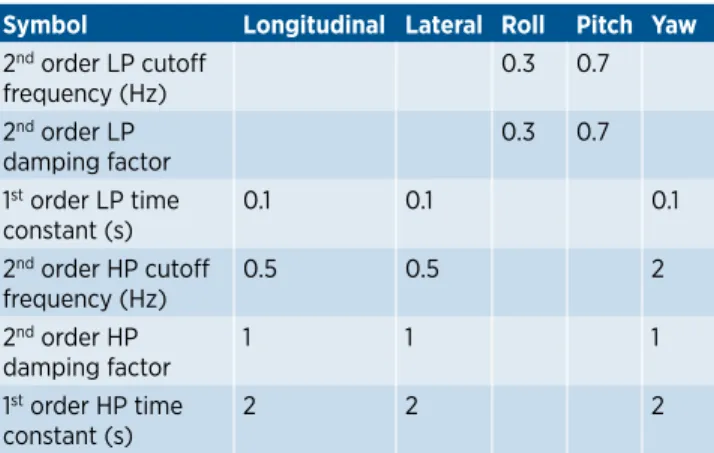
TABLE 2 Classical motion cueing algorithm parameters
[4, 8, 50, 51].
Symbol Longitudinal Lateral Roll Pitch Yaw
2nd order LP cutoff frequency (Hz) 0.3 0.7 2nd order LP damping factor 0.3 0.7 1st order LP time constant (s) 0.1 0.1 0.1 2nd order HP cutoff frequency (Hz) 0.5 0.5 2 2nd order HP damping factor 1 1 1 1st order HP time constant (s) 2 2 2
EFFECT OF CLOSED-LOOP MOTION CUEING ALGORITHM FOR A SIX-DEGREES-OF-FREEDOM DYNAMIC SIMULATOR
3.4. Subjects
The experimental procedure was done to analyze the effect of the participants’ involvement level change (guided and unguided passengers and drivers) at the same motion cueing for the dynamic platform simulator. Twenty-eight subjects (N = 28, 25 males and 3 females) aged (mean, 32.21 years; SD, 8.32 years) and with driving license experience (mean, 13.43 years; SD, 8.11 years) (standard deviation (SD)) participated in experiments of these seven conditions. All the participants had normal or corrected to normal vision. Before the experi-ments, they were asked to drive the same scenario to become accustomed with it.
3.5. Data Analysis
The contributions of the closed-loop motion platform control as well as the displacement scale factor (SF) of the motion platform in 3D on PD as an indicator of mental pressure were assessed. It was evaluated with respect to the correlation with the vehicle CG’s positions and accelerations in 3D in order to confirm which parameter has influence on cognitive load by using an eye tracking system sensor (Figure 5) and
SCANeRstudio® software, respectively.
Two-tailed Mann-Whitney U test and the two-tailed Friedman test with a confidence interval of 95%, which are nonparametric hypothesis tests, were assigned to compare the differences of the participants’ PDs with the closed-loop control condition and with the different SF condition during the same driving scenario with same lighting conditions by using MATLAB Statistic Toolbox® [53]. Pearson’s correlation r with a confidence interval of 95% was used with the help of MATLAB Statistic Toolbox® [53] to test how the PD (cognitive pressure) is correlated to the positions and the accelerations
of the vehicle’s CG in 3D. XLSTAT® was used for the
two-tailed Friedman test [54].
FIGURE 3 Open-loop and closed-loop motion cueing algorithms.
FIGURE 4 Eye movement data acquisition during the
experiments.
EFFECT OF CLOSED-LOOP MOTION CUEING ALGORITHM FOR A SIX-DEGREES-OF-FREEDOM DYNAMIC SIMULATOR
One-dimensional (1D) discrete wavelet transform (DWT) [55] was used as a method to avoid the noise that appears in the high-frequency part of the PD signal.
4. Results and Discussions
We investigated the closed-loop motion platform control and the SF’s effects on driver’s mental load in a six-degrees-of-freedom dynamic driving simulator. Mental workload was
estimated by “pupillometry” method, where the metrics of the change of the PD is used to identify the subject’s cognitive load in real time. Because of this reason, cognitive load is frequently explained as the relationship between the mental requests placed on a subject and the cognitive abilities of that person [14]. Based on this method, the participant’s pupil will enlarge as he/she comes across with a complicated task, and then the pupil will constrict in diameter when the task is finished and the person does not experience any additional mental pressure. This broadly observed effect is used in esti-mating mental workload in human machine interaction [15,
0 20 40 60 80 100 120 -10 -5 0 5 Time (s)
Vehicle longitudinal acceleration (m/
s 2) 0 20 40 60 80 100 120 -4 -2 0 2 4 Time (s) Vehicle latera l accelerations (m/s 2) 0 20 40 60 80 100 120 -0.2 -0.1 0 0.1 0.2 Time (s)
Vehicle vertical acceleration (m/s
2)
FIGURE 6 Vehicle’s center of gravity accelerations (longitudinal, lateral, and vertical).
-2400 -2200 -2000 -1800 -1600 -1400 -1200 -100 0 100 200 300 400 500 60020 21 22 23 24 25 26 27
Longitudinal position of Center of Gravity of the Vehicle (m) Lateral position of Center of Gravity of the Vehicle (m)
Vertical position of
Center of Gravity of the Vehicle (m
)
EFFECT OF CLOSED-LOOP MOTION CUEING ALGORITHM FOR A SIX-DEGREES-OF-FREEDOM DYNAMIC SIMULATOR
36, 37, 38, 39, 40, 56]. We also applied the novel method as of wavelet transform to decrease the data complexity for the registered signals [44, 45, 46] by removing the noise from the high-frequent part of the signal. In Figure 8, the PD change of the driver participants (N = 28) (in millimeters) who partic-ipated in the driving simulator experiments was illustrated.
Classical algorithm refers to a kind of motion cueing algorithm for the driving simulator with a motion platform (dynamic driving simulator). In this type of motion cueing algorithm, the control algorithm is ensured as an open-loop control between motion platform and vehicle dynamics
model. It is explained that there is no feedback from motion platform to vehicle dynamics model.
The red curve shows the classical algorithm, the blue curve indicates the MRAC algorithm, the green curve gives the LQR algorithm, and finally the black curve illustrates the MRAC+LQR (hybrid) algorithm.
Figure 9 depicts the SF effects in time domain for the MRAC, the LQR, and the MRAC+LQR algorithms. The blue curve repre-sents the SF = 0.2, whereas the red curve shows the SF = 1.0.
Table 3 gives the results for the minimum, the maximum, the mean and the standard deviation for the PD in different
0 20 40 60 80 100 120 1.5 2 2.5 3 3.5 4 4.5 5 Time (s) Pupil diameter (mm) classical algorithm adaptive algorithm (MRAC) optimal algorithm (LQR) hybrid algorithm (MRAC+LQR)
FIGURE 8 Pupil diameter change for the operations with open-loop and closed-loop motion cueing algorithms.
0 20 40 60 80 100 120 2 3 4 5 Time (s) Pupil diameter (mm) 0 20 40 60 80 100 120 2 3 4 5 Time (s) Pupil diameter (mm) 0 20 40 60 80 100 120 2 3 4 5 Time (s) Pupil diameter (mm)
MRAC+LQR algorithm (scale factor: 0.2) MRAC+LQR algorithm (scale factor: 1.0) LQR algorithm (scale factor: 0.2) LQR algorithm (scale factor: 1.0) MRAC algorithm (scale factor: 0.2) MRAC algorithm (scale factor: 1.0)
EFFECT OF CLOSED-LOOP MOTION CUEING ALGORITHM FOR A SIX-DEGREES-OF-FREEDOM DYNAMIC SIMULATOR
motion cueing algorithms. It can be deduced that the lowest PD was obtained with LQR algorithm, whereas the highest PD was found with the MRAC+LQR algorithm due to the data acquisition during the driving experiments from the subjects (N = 28). It can be yielded that when the task is complicated, the participants’ PDs enlarge.
Tables 4, 5, and 6 indicate the results obtained from the two-tailed Friedman test. It was revealed that the PD with the
LQR+MRAC algorithm was very significantly larger (Q(28); p =
0.045 < 0.05, p = 0.004 < 0.05, and p < 0.0001, respectively) than
that with the LQR algorithm, with the MRAC algorithm, and with the classical algorithm during the specific driving scenario.
The two-tailed Mann-Whitney U test resulted that the higher motion platform displacement SF (SF = 1.0) ensured a significant lower PD (cognitive load) for the MRAC+LQR algorithm than the lower SF = 0.2 (p = 3.4051e−06). For the MRAC algorithm and for the LQR algorithm, the higher SF supplied nonsignificant higher PD as an objective measure for the cognitive pressure (p = 0.9466 > 0.05 and p = 0.1521 > 0.05, respectively, seen in Table 7).
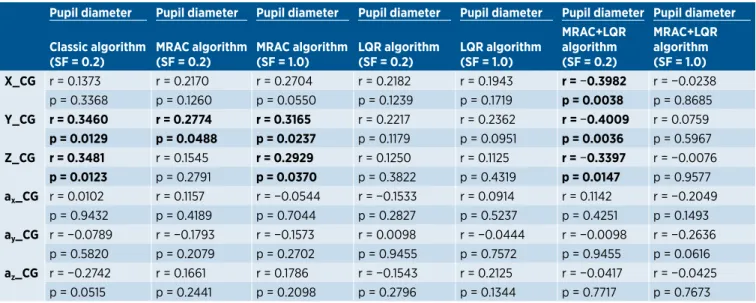
Pearson’s correlation tests showed that the LQR algo-rithms with both SF = 0.2 and SF = 1.0 and the MRAC+LQR algorithm with SF = 1.0 were the least sensitive algorithms in terms of PD to the vehicle’s 3D positions (XCG, YCG, ZCG) as well as to the vehicle’s 3D accelerations (axCG, ayCG, azCG).
Table 8 summarizes the closed-loop motion platform control as well as the motion platform displacement SF on the PD, in order to have an objective measure of the mental load, by correlating the PD with the vehicle CG accelerations (ax_ CG, longitudinal acceleration of the vehicle CG; ay_CG, lateral acceleration of the vehicle CG; az_CG, vertical acceleration of the vehicle CG) as well as the vehicle CG positions (X_CG, longitudinal position of the vehicle CG; Y_CG, lateral position of the vehicle CG; Z_CG, vertical position of the vehicle CG).
It can be inferred that the vehicle CG positions in 3D were significantly negative correlated to the PD for the MRAC+LQR algorithm SF = 0.2 case (r = −0.3982 p = 0.0038, r = −0.4009
p = 0.0036, and r = −0.3397 p = 0.0147 for the longitudinal,
the lateral, and the vertical positions of the vehicle CG, respectively).
It is resulted that the lateral and the vertical positions of the vehicle CG were significantly correlated to the PD for the classical
TABLE 3 Summary statistics for pupil diameters.
Pupil diameter (mm) Minimum Maximum Mean Std. deviation
Classic algorithm (SF = 0.2) 1.683 4.222 3.181 0.418 MRAC algorithm (SF = 0.2) 1.808 4.243 3.155 0.456 LQR algorithm (SF = 0.2) 2.241 3.766 3.044 0.304 MRAC+ LQR algorithm (SF = 0.2) 1.676 4.724 3.495 0.503
TABLE 4 Table of pairwise differences for open-loop and
closed-loop motion cueing algorithms.
Classic
algorithm MRAC algorithm LQR algorithm MRAC+LQR algorithm Classic algorithm 0 0.196 0.667 −0.667 MRAC algorithm −0.196 0 0.471 −0.863 LQR algorithm −0.667 −0.471 0 −1.333 MRAC+LQR algorithm 0.667 0.863 1.333 0 Critical difference: 0.6568
TABLE 5 p-values of Friedman’s test.
Classic
algorithm MRAC algorithm LQR algorithm MRAC+LQR algorithm
Classic algorithm 1 0.869 0.045 0.045 MRAC algorithm 0.869 1 0.254 0.004 LQR algorithm 0.045 0.254 1 <0.0001 MRAC+LQR algorithm 0.045 0.004 <0.0001 1
TABLE 6 Significant differences.
Classic
algorithm MRAC algorithm LQR algorithm MRAC+LQR algorithm
Classic
algorithm No No Yes Yes
MRAC
algorithm No No No Yes
LQR algorithm Yes No No Yes
MRAC+LQR
algorithm Yes Yes Yes No
Bonferroni corrected significance level: 0.0083
TABLE 7 Comparison of pupil diameters due to scale factor (SF) with motion platform simulator.
Pupil diameters with motion platform scale factor: 0.2 and 1.0 (MRAC algorithm) (mean ± sd)
p-values from a two-tailed U test
Pupil diameters with motion platform scale factor: 0.2 and 1.0 (LQR algorithm) (mean ± sd)
p-values from a two-tailed U test
Pupil diameters with motion platform scale factor: 0.2 and 1.0 (MRAC+LQR algorithm) (mean ± sd) p-values from a two-tailed U test Pupil diameter (SF = 0.2) 3.1764 ± 0.4314 p = 0.9466 > 0.05 Pupil diameter (SF = 0.2) 3.0440 ± 0.3039 p = 0.1521 > 0.05 Pupil diameter (SF = 0.2) 3.4952 ± 0.5030 p = 3.4051e−06 Pupil diameter (SF = 1.0) 3.1836 ± 0.3755 Pupil diameter (SF = 1.0) 3.1323 ± 0.2893 Pupil diameter (SF = 1.0) 3.1476 ± 0.3645
EFFECT OF CLOSED-LOOP MOTION CUEING ALGORITHM FOR A SIX-DEGREES-OF-FREEDOM DYNAMIC SIMULATOR
algorithm SF = 0.2 and for the MRAC algorithm SF = 1.0 cases (r = 0.3460 p = 0.0129, r = 0.3481 p = 0.0123 and r = 0.3165 p =
0.0237, r = 0.2929 p = 0.0370 for the lateral and the vertical
posi-tions of the vehicle CG and for the classical algorithm SF = 0.2 and for the MRAC algorithm SF = 1.0 cases, respectively).
It is revealed that the lateral position of the vehicle CG was significantly correlated to the PD for the MRAC algorithm SF = 0.2 case (r = 0.2774 p = 0.0448).
5. Conclusion
The influence of the closed-loop motion platform (coupling effect: MRAC+LQR algorithm) and the motion platform displacement SF on the PD was dealt with as an objective measure of the mental load for the driving simulator during the same scenario with the same lighting conditions. Furthermore, the correlations between the PD and the vehicle CG accelerations and positions in 3D were investigated.
As only for the PD data evaluation, the MRAC+LQR ensured the highest PD than the LQR algorithm and the MRAC algorithm. The MRAC+LQR algorithm provided the lowest PD for SF = 1.0. Finally, the coupling effect with the MRAC+LQR algorithm (hybrid algorithm) supplied the least sensitive algorithm to the PD (cognitive load) for the same driving scenario and the lighting conditions.
To sum up, an ADAS device as being an HMI that can give warning as auditory or visual signals depending on the PDs’ of the drivers. These systems can be adapted to be tested within dynamic driving simulators. This could be via a camera recorder system that can register the eye movements in real time.
Definitions/Abbreviations
ADAS - Advanced driver assistance systems MRAC - Model reference adaptive control LQR - Linear quadratic regulator
HMI - Human machine interaction SMI - SensoMotoric Instruments TEPR - Task-evoked pupillary response ABS - Antilock braking system
ESP - Electronic stability program ACC - Adaptive cruise control PND - Personal navigation device BD - Blink duration
BR - Blink rate
FFT - Fast Fourier transform PSD - Power spectral density PD - Pupil diameter
STFT - Short-time Fourier transform CG - Center of gravity
SAAM - Simulator Automobile of Arts et Métiers DOF - Degree of freedom
EMG - Electromyography LP - Low pass HP - High pass SD - Standard deviation N - Number of subjects 3D - Three dimensional 1D - One dimensional
DWT - Discrete wavelet transform SF - Scale factor
References
1. Aykent, B., Tomaske, W., and Meywerk, M., “Study of the Influence of an Active Roll Controller on a Load-Dependent Vehicle Stability,” SAE Technical Paper 2009-01-1669, 2009, doi:10.4271/2009-01-1669.
TABLE 8 Correlation of pupil diameter with three-dimensional positions and accelerations for the center of the gravity
of the vehicle.
Pupil diameter Pupil diameter Pupil diameter Pupil diameter Pupil diameter Pupil diameter Pupil diameter Classic algorithm
(SF = 0.2) MRAC algorithm (SF = 0.2) MRAC algorithm (SF = 1.0) LQR algorithm (SF = 0.2) LQR algorithm (SF = 1.0)
MRAC+LQR algorithm (SF = 0.2) MRAC+LQR algorithm (SF = 1.0) X_CG r = 0.1373 r = 0.2170 r = 0.2704 r = 0.2182 r = 0.1943 r = −0.3982 r = −0.0238 p = 0.3368 p = 0.1260 p = 0.0550 p = 0.1239 p = 0.1719 p = 0.0038 p = 0.8685 Y_CG r = 0.3460 r = 0.2774 r = 0.3165 r = 0.2217 r = 0.2362 r = −0.4009 r = 0.0759 p = 0.0129 p = 0.0488 p = 0.0237 p = 0.1179 p = 0.0951 p = 0.0036 p = 0.5967 Z_CG r = 0.3481 r = 0.1545 r = 0.2929 r = 0.1250 r = 0.1125 r = −0.3397 r = −0.0076 p = 0.0123 p = 0.2791 p = 0.0370 p = 0.3822 p = 0.4319 p = 0.0147 p = 0.9577 ax_CG r = 0.0102 r = 0.1157 r = −0.0544 r = −0.1533 r = 0.0914 r = 0.1142 r = −0.2049 p = 0.9432 p = 0.4189 p = 0.7044 p = 0.2827 p = 0.5237 p = 0.4251 p = 0.1493 ay_CG r = −0.0789 r = −0.1793 r = −0.1573 r = 0.0098 r = −0.0444 r = −0.0098 r = −0.2636 p = 0.5820 p = 0.2079 p = 0.2702 p = 0.9455 p = 0.7572 p = 0.9455 p = 0.0616 az_CG r = −0.2742 r = 0.1661 r = 0.1786 r = −0.1543 r = 0.2125 r = −0.0417 r = −0.0425 p = 0.0515 p = 0.2441 p = 0.2098 p = 0.2796 p = 0.1344 p = 0.7717 p = 0.7673
EFFECT OF CLOSED-LOOP MOTION CUEING ALGORITHM FOR A SIX-DEGREES-OF-FREEDOM DYNAMIC SIMULATOR
2. Aykent, B., “Effects of Sway Acceleration Control on Rollover Propensity and Assessment of Lateral Specific Forces,” SAE Technical Paper 2010-01-1325, 2010, doi:10.4271/2010-01-1325.
3. Meywerk, M., Aykent, B., and Tomaske, W., “Einfluss der Fahrdynamikregelung au f die Sicherheit von N1-Fahrzeugen bei unterschiedlichen Beladungszuständen,” Elba, Das elekronische BASt-Archiv, 2009.
4. Aykent, B., Paillot, D., Merienne, F., and Kemeny, A., “A LQR Washout Algorithm for a Driving Simulator Equipped with a Hexapod Platform: The Relationship of Neuromuscular Dynamics with the Sensed Illness Rating,” in CONFERE, Venice, Italy, July 5-6, 2012.
5. Aykent, B., Paillot, D., Merienne, F., and Kemeny, A., “The Influence of the Feedback Control of the Hexapod Platform of the SAAM Dynamic Driving Simulator on
Neuromuscular Dynamics of the Drivers,” in Driving
Simulation Conference, Paris, France, 2012.
6. Aykent, B., Paillot, D., Merienne, F., Fang, Z. et al., “Study of the Influence of Different Washout Algorithms on Simulator Sickness for a Driving Simulation Task,” ASME WINVR 2011-5545, 2011, 331-341.
7. Aykent, B., Merienne, F., Paillot, D., and Kemeny, A., “The Role of Motion Platform on Postural Instability and Head Vibration Exposure at Driving Simulators,” Human
movement science 33:354-368, 2014.
8. Aykent, B., “Etude des lois de commande de la plateforme de simulation de conduite et influence sur le mal de simulateur,” Doctoral dissertation, ENSAM, Paris 2013.
9. Aykent, B., Yang, Z., Merienne, F., and Kemeny, A., “Simulation Sickness Comparison between a Limited Field of View Virtual Reality Head Mounted Display (Oculus) and a Medium Range Field of View Static Ecological Driving Simulator (Eco2), 2014.
10. Aykent, B., Merienne, F., and Kemeny, A., “Effect of VR Device-HMD and Screen Display-on the Sickness for Driving Simulation,” 2015.
11. Tomaske, W., Aykent, B., Fortmüller, T., and Meywerk, M., “Objektive und subjektive Bewertung von
Bewegungseindrücken bei Fahrsimulatoren, 4,” 2008. 12. Aykent, B., Merienne, F., Paillot, D., and Kemeny, A.,
“LATREDSIM6 (LATence REDuction pour SIMulateur 6 DOF) (Protection du logiciel à temps réel),” 2015. 13. Palinko, O. and Sciutti, A., “Exploring the Estimation of
Cognitive Load in Human Robot Interaction,” in Workshop
HRI: A Bridge between Robotics and Neuroscience at 9th ACM/IEEE International Conference on Human-Robot Interaction, Bielefeld, Germany, Mar. 3-6, 2014.
14. Wickens, C.D., “Multiple Resources and Performance Prediction,” Theoretical Issues in Ergonomics Sci. 3(2):159-177, 2002.
15. Beatty, J., “Task-Evoked Pupillary Responses, Processing Load, and the Structure of Processing Resources,”
Psychological Bulletin 91(2):276-292, 1982.
16. Pomplun, M. and Sunkara, S., “Pupil Dilation as an Indicator of Cognitive Workload in Human-Computer Interaction,” in Proceedings of the International Conference
on HCI, 2003.
17. Duchowski, A., Eye Tracking Methodology: Theory and
Practice. Vol. 373 (Springer Science & Business Media, 2007).
18. Bergstrand, M., “Automatic Analysis of Eye Tracker Data from a Driving Simulator,” 2008.
19. Klingner, J., Kumar, R., and Hanrahan, P., “Measuring the Task-Evoked Pupillary Response with a Remote Eye Tracker,” in Proceedings of Eye Tracking Research and
Applications, 2008..
20. Palinko, O., Kun, A.L., Shyrokov, A., and Heeman, P., “Estimating Cognitive Load Using Remote Eye Tracking in a Driving Simulator,” in Proceedings of Eye Tracking Research
and Applications, 2010.
21. Palinko, O., Goyal, S., and Kun, A.L., “A Pilot Study of the Influence of Illumination and Cognitive Load on Pupil Diameter in a Driving Simulator,” 2010.
22. Palinko, O. and Kun, A.L., “Exploring the Influence of Light and Cognitive Load on Pupil Diameter in Driving Simulator Studies,” in Proceedings of the Sixth International Driving
Symposium on Human Factors in Driver Assessment, Training and Vehicle Design, (Iowa City: Public Policy
Center, University of Iowa, 2011), 329-336.
23. Tsai, Y.F., Viirre, E., Strychacz, C., Chase, B. et al., “Task Performance and Eye Activity: Predicting Behavior Relating to Cognitive Workload,” Aviation, Space, and Environmental
Medicine 78(Supplement 1):B176-B185, 2007.
24. Kun, A.L., Palinko, O., and Razumenić, I., “Exploring the Effects of Size and Luminance of Visual Targets on the Pupillary Light Reflex,” in Proceedings of Automotive User
Interfaces 2012.
25. Kun, A.L., Paek, T., Medenica, Ž., Memarović, N. et al., “Glancing at Personal Navigation Devices Can Affect Driving: Experimental Results and Design Implications,” in
Proceedings of the 1st International Conference on Automotive User Interfaces and Interactive Vehicular Applications, ACM, 2009, 129-136.
26. Kun, A.L., Paek, T., Medenica, Z., Oppelaar, J.E. et al., “The Effects of In-Car Navigation Aids on Driving Performance and Visual Attention (Vol. 54),” Technical Report ECE, 2009. 27. Salvucci, D.D., “Predicting the Effects of In-Car Interfaces
on Driver Behavior Using a Cognitive Architecture,” in
Proceedings of the SIGCHI Conference on Human Factors in Computing Systems, ACM, 2001, 120-127.
28. Pomarjanschi, L., Dorr, M., Bex, P. J., and Barth, E., “Simple Gaze-Contingent Cues Guide Eye Movements in a Realistic Driving Simulator,” in IS&T/SPIE Electronic Imaging, International Society for Optics and Photonics, Mar. 2013, 865110-865110.
29. Balk, S.A., Moore, K., Steele, J.E., Spearman, W. et al., “Mobile Phone Use in a Driving Simulation Task: Differences in Eye Movements,” J Vis 6(6):872, 2006.
30. Benedetto, S., Pedrotti, M., Minin, L., Baccino, T. et al., “Driver Workload and Eye Blink Duration,” Transportation
Research Part F: Traffic Psychology and Behaviour
14(3):199-208, 2011.
31. Pedrotti, M., Mirzaei, M.A., Tedesco, A., Chardonnet, J.R. et al., “Automatic Stress Classification with Pupil Diameter Analysis,” International Journal of Human-Computer
EFFECT OF CLOSED-LOOP MOTION CUEING ALGORITHM FOR A SIX-DEGREES-OF-FREEDOM DYNAMIC SIMULATOR
32. Sauter, S.L., “Job Stress and Human-Computer Interaction,”
International Journal of Human-Computer Interaction
4(3):3-4, 1991, doi:10.1080/10447319109526018. 33. Czaja, S.J. and Sharit, J., “Stress Reactions to
Computer-Interactive Tasks as a Function of Task Structure and Individual Differences,” International Journal of
Human-Computer Interaction 5(1):1-22, 1993,
doi:10.1080/10447319309526053.
34. Dennerlein, J., Becker, T., Johnson, P., Reynolds, C. et al., “Frustrating Computer Users Increases Exposure to Physical Factors,” in Proceedings of the International Ergonomics
Association, Seoul, Korea, 2003, 24-29.
35. Fujigaki, Y. and Mori, K., “Longitudinal Study of Work Stress among Information System Professionals,”
International Journal of Human-Computer Interaction
9(4):369-381, 1997, doi:10.1207/s15327590ijhc0904_3. 36. Beatty, J., “The Pupillary System,” in Coles, M.G.H., Donchin,
E., and Porges, S.W. (Eds.), Psychophysiology: Systems,
Processes, and Applications (New York, Guilford, 1986), 43-50.
37. Bradley, M.M., Miccoli, L., Escrig, M.A., and Lang, P.J., “The Pupil as a Measure of Emotional Arousal and Autonomic Activation,” Psychophysiology 45(4):602-607, 2008. 38. Goldwater, B.C., “Psychological Significance of Pupillary
Movements,” Psychological Bulletin 77(5):340, 1972. 39. Partala, T. and Surakka, V., “Pupil Size Variation as an
Indication of Affective Processing,” International Journal of
Human-Computer Studies 59(1):185-198, 2003.
40. Võ, M.L.H., Jacobs, A.M., Kuchinke, L., Hofmann, M. et al., “The Coupling of Emotion and Cognition in the Eye: Introducing the Pupil Old/New Effect,” Psychophysiology 45(1):130-140, 2008.
41. Lüdtke, H., Wilhelm, B., Adler, M., Schaeffel, F. et al., “Mathematical Procedures in Data Recording and Processing of Pupillary Fatigue Waves,” Vision Research 38(19):2889-2896, 1998.
42. Nakayama, M. and Shimizu, Y., “Frequency Analysis of Task Evoked Pupillary Response and Eye-Movement,” in
Proceedings of the 2004 Symposium on Eye Tracking Research & Applications, ACM, Mar. 2004, 71-76.
43. Lew, R., Dyre, B.P., Werner, S., Wotring, B. et al., “Exploring the Potential of Short-Time Fourier Transforms for Analyzing Skin Conductance and Pupillometry in
Real-Time Applications,” in Proceedings of the Human Factors and
Ergonomics Society Annual Meeting, Sept. 2008 (Vol. 52, No.
19, pp. 1536-1540, Sage Publications). 44. Marshall, S.P., U.S. Patent 6,090,051, 2000.
45. Marshall, S.P., “The Index of Cognitive Activity: Measuring Cognitive Workload,” in Proceedings of the 2002 IEEE 7th
Conference on Human Factors and Power Plants, 2002, IEEE,
2002, 7-5.
46. Aykent, B., Merienne, F., Paillot, D., and Kemeny, A., “Influence of a New Discrete-Time LQR-Based Motion Cueing on Driving Simulator,” Optimal Control Applications
and Methods 35(4):454-467, 2014.
47. Shi, B., Moloney, K.P., Pan, Y., Leonard, V.K. et al., “Wavelet Classification of High Frequency Pupillary Responses,”
Journal of Statistical Computation and Simulation
76(5):431-445, 2006.
48. Pinzon-Morales, R.D. and Hirata, Y., “Customization of Wavelet Function for Pupil Fluctuation Analysis to Evaluate Levels of Sleepiness,” Journal of Communication and
Computer 10:585-592, 2013.
49. Aykent, B., Merienne, F., Paillot, D., and Kemeny, A., “Influence of Inertial Stimulus on Visuo-Vestibular Cues Conflict for Lateral Dynamics at Driving Simulators,” J
Ergonomics 3(113):2, 2013.
50. Aykent, B., Paillot, D., Merienne, F., Guillet, C. et al., “The Role of a Novel Discrete-Time MRAC Based Motion Cueing on Loss of Control at a Hexapod Driving Simulator,”
Intelligent Control and Automation 6(01):84, 2015.
51. Aykent, B., Merienne, F., Guillet, C., Paillot, D. et al., “Motion Sickness Evaluation and Comparison for a Static Driving Simulator and a Dynamic Driving Simulator,”
Proceedings of the Institution of Mechanical Engineers, Part D: Journal of Automobile Engineering 228(7):818-829, 2014.
52. Sensomotoric Instruments, “Eye & Gaze Tracking Systems,” 2012 53. Jones, B., “MATLAB: Statistics Toolbox; User’s Guide,”
MathWorks, 1997.
54. Adinsoft, S.A.R.L., “XLSTAT-Software,” Version 10, Addinsoft, Paris, France, 2010.
55. Misiti, M., Misiti, Y., Oppenheim, G., and Poggi, J.M., “Matlab Wavelet Toolbox User’s Guide,” Version 3, 2004. 56. Beatty, J. and Lucero-Wagoner, B., “The Pupillary System,” in