Télédétection de la matière en suspension dans l’estuaire de
Saint-Laurent
Thèse présentée
dans le cadre du programme de doctorat en océanographie en vue de l’obtention du grade de PhD
PAR
© Gholamreza Mohammadpour Novembre 2016
Remote sensing of suspended particulate matter concentration
in the St. Lawrence Estuary
Thesis presented
In the doctorate program of oceanography To obtain the degree of PhD
by
© Gholamreza Mohammadpour November 2016
Composition du jury :
Huixiang Xie, président du jury, UQAR
Jean-Pierre Gagné, directeur de recherche, UQAR
Martin A. Montes-Hugo, codirecteur de recherche, UQAR
Pierre Larouche, co-directeur de recherche, Institut Maurice Lamontagne Susanne Craig, examinateur externe, Université de Dalhousie
UNIVERSITÉ DU QUÉBEC À RIMOUSKI
Service de la bibliothèque Avertissement
La diffusion de ce mémoire ou de cette thèse se fait dans le respect des droits de son auteur, qui a signé le formulaire « Autorisation de reproduire et de diffuser un rapport, un mémoire ou une thèse ». En signant ce formulaire, l’auteur concède à l’Université du Québec à Rimouski une licence non exclusive d’utilisation et de publication de la totalité ou d’une partie importante de son travail de recherche pour des fins pédagogiques et non commerciales. Plus précisément, l’auteur autorise l’Université du Québec à Rimouski à reproduire, diffuser, prêter, distribuer ou vendre des copies de son travail de recherche à des fins non commerciales sur quelque support que ce soit, y compris l’Internet. Cette licence et cette autorisation n’entraînent pas une renonciation de la part de l’auteur à ses droits moraux ni à ses droits de propriété intellectuelle. Sauf entente contraire, l’auteur conserve la liberté de diffuser et de commercialiser ou non ce travail dont il possède un exemplaire.
To my lovely family;
Sheila, Veyana, and Sayna
ACKNOWLEDGEMENT/REMERCIEMENTS
Doing a doctorate degree is a group work, and collaboration is a joint part of this period. Here, I have the honor to thank sincerely people who helped me going through my studies counting on their warm support. This work has been done by the department of Oceanography at the l’Institut de la Science de la Mer (ISMER), the University of Québec at Rimouski. I would like to offer my special thanks to professors Arianne Plourde, Jean-Pierre Gagné, and Karine Lemarchand, the respective appointed director, and former and present director of the oceanography program of the ISMER for providing me a nice and friendly ambience. It also is a great honor to be under the direction of professors Martin A. Montes-Hugo, Jean-Pierre Gagné, and Pierre Larouche for my thesis. I am so grateful for their encouraging, support, advises, and directing during my studies.
I would especially thank Mr.’s Gilles Desmeules, Sylvain Leblanc, Bruno Cayouette, Pascal Rioux, and Ms. Melanie Simard, the technical research assistants of the ISMER, who have generously helped me through my field works, sampling methods, and data analyses. They provided me their priceless time and patience to guide me how to analyze my data with remarkable precision. Likewise, the crew of the coast guard boat (Samuel Creed), along with Mr. Alexandre Palardy, who helped me on my field work during June 2013 have my exceptional appreciations. I have also had the chance to work in the labs of Dr. Gagné, benefiting the great help of his student Mr. Mathieu Millour. I’d like to offer him my special appreciations.
I appreciate the “Natural sciences and engineering research council of Canada (NSERC)” for supporting my doctorate project.
Finally, I sincerely and enormously thank my wife Sheila for supporting, encouraging, and standing by my side the whole time, and my daughters Veyana and Sayna for immensely loading me with positive energy, and being my only explanations of the beauty of life.
RÉSUMÉ
Les zones côtières et estuariennes jouent un rôle clé dans les processus biogéochimiques comme les échanges de gaz à effet de serre à l'interface air-mer, la photosynthèse et la régénération des nutriments. Tous ces processus sont liés à la dynamique des matières particules en suspension (MPS). L’estuaire du Saint-Laurent (ESL) est un des plus grands estuaires du monde. On y retrouve un important mélange de propriétés chimiques et optiques résultant de la combinaison des eaux douces en provenance du fleuve St-Laurent (FSL) et des eaux marines du golfe du Saint-Laurent (GSL). L’objectif principal de cette thèse est d’évaluer, développer et valider différents modèles de télédétection optique pour estimer la concentration de MPS dans les eaux de l’ESL.
Cette thèse présente en plus deux objectifs secondaires. Premièrement, caractériser, pour la zone étudiée, les distributions de tailles de la MPS, puis déterminer les propriétés optiques massiques spécifiques de la matière en suspension. Avec ces données certains proxys sont proposés pour étudier les attributs de deuxième ordre de la MPS. Deuxièmement, une revue des effets thermiques induits par la présence des MPS dans les eaux océaniques et littorales est réalisée. Cette synthèse incorpore une analyse des changements potentiels que pourraient subir certaines variables climatiques dues aux variations de chaleur associé à la distribution et à la nature des particules.
Le premier chapitre résume les concepts relatifs à l’optique marine et la télédétection de la couleur des océans dans les eaux estuariennes et côtières. Le deuxième chapitre présente une relation biogéo-optique pour cartographier les distributions CMPS dans l'estuaire supérieur
du Saint-Laurent basé sur des mesures satellitaires de couleur de l’océan à moyenne résolution spatiale. Enfin, l’influence de la composition chimique des particules sur la
télédétection des CMPS est investiguée et une série de nouveaux paramètres sont présentés
pour estimer le contenu organique des MPS dans l’ESL.
Le troisième chapitre traite de la caractérisation des propriétés optiques de la MPS ayant différentes compositions chimiques et tailles dans les eaux de l’ESL. Dans ce chapitre, l’effet de la composition et des tailles sur les propriétés optiques inhérentes des particules et leurs effets sur les signaux optiques détectés par des capteurs optiques sont étudiés.
Le quatrième chapitre propose une revue du rôle des particules dans la modulation de la variabilité spatiale de la température de l’eau, des flux de chaleur à l’interface air-mer et des variables météorologiques locales. La contribution de la MPS et celle de la matière organique dissoute chromophorique (MODC) dans le budget de chaleur dans les eaux côtières et océaniques sont examinées. De plus, le rôle du flux de chaleur induit par les particules dans l’altération des processus de formation de nuage et de précipitations et la dynamique des banquises est analysé.
En conclusion, pour l’ESL, les résultats obtenus dans cette thèse montrent que la concentration et la composition chimique des MPS peuvent être estimées à partir de méthode de télédétection optique avec une exactitude acceptable (c.-à-d.. une erreur d’environ 30 %). L’approche proposée devrait être valide dans d’autres environnements littoraux ayant des propriétés biogéooptiques comparables à celles mesurées dans la région d’étude. Il a été démontré que des changements dans la composition chimique des particules peuvent constituer une importante source de variabilité dans l'évaluation des CMPS estimée par
télédétection dans la région d’étude. Finalement, la discussion du chapitre 3 a révélé une importance comparable de l’effet des particules en suspension et des matières dissoutes sur la température de l’eau et la variabilité des flux de chaleur dans les eaux côtières.
Mots clés : matières particulaires en suspension, distribution de tailles des particules, composition des particules, matière organique dissoute colorée, propriétés optiques inhérentes, télédétection, flux de chaleur, température de l’eau surface, variabilité du climat
ABSTRACT
Estuarine and coastal zones play a key role in biogeochemical processes such as air-water exchange of greenhouse gases, photosynthesis and regeneration of nutrients. All these processes are linked to dynamics of suspended particulate matter (SPM). The St. Lawrence Estuary (SLE) is one of the largest estuaries in the world where a major mixing of chemical and optical properties occurs due to the exchange of water parcels derived from the St Lawrence River (SLR) and the Gulf of St. Lawrence (GSL). The primary objective of this thesis is to evaluate, develop and validate different optical remote sensing models for estimating concentration of SPM in SLE waters.
In addition, this thesis has two secondary objectives: Firstly, mass-normalized optical properties of different chemical and size distribution fractions are characterized over the study area, and optical remote sensing proxies are proposed for studying second-order attributes of SPM. Secondly, a review of particle-mediated thermal effects in oceanic and littoral waters is achieved. Also, this synthesis incorporates an analysis of potential changes on climate variables due to variations on water heat content. associated to different particle distributions and nature.
The first chapter summarizes the actual concepts on marine optics and remote sensing of ocean color in estuarine and coastal waters. In the second chapter, a biogeo-optical relationship is suggested to map CSPM distributions in the upper SLE and based on satellite
ocean color measurements having a moderate spatial resolution. Lastly, the influence of particle chemical composition on remote sensing of CSPM was investigated, and a series of
new parameterizations are shown for estimating organic content of SPM in SLE waters. The third chapter is about the characterization of optical properties of different chemical and size fractions of SPM in SLE waters. In this chapter, the effect of particle
composition and size distribution on the inherent optical properties of particles and their effects on optical signals arriving to the remote sensing sensor are investigated.
The fourth chapter reviews the role of particles in in modulating the spatial variability of water temperature, air-water heat fluxes and local weather variables. Here, the contribution of SPM and chromophoric dissolved organic matter (CDOM) to heat budget components in coastal and oceanic waters was examined. Also, the role of the particle – mediated heat flux in altering the behavior of cloud formation and precipitation, and the dynamics of sea ice was analyzed.
In summary for the SLE, the results obtained during this thesis showed that concentration and chemical composition of SPM can be estimated based on optical remote sensing methods and with an acceptable accuracy (i.e., around 30% error). The proposed approach is expected to be valid in other littoral environments with comparable biogeo-optical properties to those typical measured over the study area. It was demonstrated that changes on particle chemical composition may be an important source of variability on remote sensing estimates of CSPM in our study area. Lastly, the discussion of chapter 3
revealed the comparable importance of particulate and dissolved matter affecting water temperature and heat flux variability in land-influenced waters.
Keywords: Suspended particulate matter, particle size distribution, particle composition, CDOM, inherent optical properties, remote sensing, air-water heat flux, water surface temperature, climate variability
TABLE OF CONTENTS
REMERCIEMENTS/ACKNOWELEDGEMENT ... xi
RÉSUMÉ ... xiii
ABSTRACT ... xvi
TABLE OF CONTENTS ... xix
LIST OF TABLES ... xxiv
LIST OF FIGURES ... xxvi
LIST OF ABREVIATIONS AND ACRONYMS ... xxx
LIST OF SYMBOLS ... xxxiv
CHAPTER 1: GENERAL INTRODUCTION ... 1
1.1BASICOPTICALREMOTESENSINGCONCEPTS ... 1
1.2OPTICALREMOTESENSINGSYSTEMCOMPONENTS ... 2
1.3LIGHTPROPAGATIONINAIRANDWATER ... 2
1.4INHERENTANDAPPARENTOPTICALPROPERTIES(IOPSANDAOPS) ... 4
1.5OPTICALREMOTESENSINGMODELSOFSPM ... 8
1.6OPTICALREMOTESENSINGMODELSFORSTUDYING SECOND-ORDERATTRIBUTESOFSPM ... 9
1.7MASS-SPECIFICOPTICALPROPERTIESOFSPM ... 10
1.8 BIOGEO-OPTICAL WATER COMPONENTS AND HEAT TRANSFER ACROSSTHEAIR-WATERINTERFACE ... 11
1.9.1PHYSICALPROCESSES ... 15
1.9.2TIDALCURRENTS,WAVES,ANDDYNAMICSOFSPM ... 15
1.10OBJECTIVES ... 16
1.11HYPOTHESES ... 17
CHAPTER 2: EFFETS DE LA COMPOSITION DES PARTICULES SUR LES MATIERES EN SUSPENSION DERIVEES DE MERIS : UNE ETUDE SUR L’ESTUARE DE SAINT- LAURENT ... 20
RÉSUMÉ ... 21
PARTICLE COMPOSITION EFFECTS ON MERIS-DERIVED SPM : A CASE STUDY IN THE SAINT LAWRENCE ESTUARY ... 22
2.1INTRODUCTION ... 23
2.2METHODS ... 24
2.2.1STUDYAREA ... 24
2.2.2DATASETS ... 24
2.2.3BIOGEOCHEMICALANALYSIS ... 26
2.2.4ABOVE-WATERRADIOMETRICMEASUREMENTS ... 26
2.2.5CORRECTIONSDUETOSENSORDIFFERENCES ... 27
2.2.6SIMULATEDPARTICLECOMPOSITIONEFFECTS ... 28
2.2.7STATISTICALANALYSIS ... 29
2.3RESULTS ... 30
2.3.1BIOGEO-OPTICALRELATIONSHIPS ... 30
2.3.2SENSITIVITYOFCSPMESTIMATESTOPARTICLE COMPOSITION ... 34
2.4DISCUSSION ... 37
2.4.1REMOTESENSINGOFCSPMANDCPIM/CSPM ... 37
2.4.2THEORIGINOFBIOGEO-OPTICALCOVARIATIONS ... 38
2.8APPENDIX ... 42
2.8.1SHIPBOARDOPTICALMEASUREMENTS ... 42
2.8.2ANALYSISOFPARTICLESIZE ... 42
CHAPTER 3 : PROPRIETES OPTIQUES LIÉES À LA TAILLE ET AUX FRACTIONS CHIMIQUES DES MATIÈRES EN SUSPENSION DANS LES EAUX LITTORALES DU QUÉBEC ... 48
RÉSUMÉ ... 49
OPTICAL PROPERTIES OF SIZE AND CHEMICAL FRACTIONS OF SUSPENDED PARTICULATE MATTER IN LITTORAL WATERS OF QUEBEC ... 50
3.1INTRODUCTION ... 51
3.2DATAANDMETHODS ... 53
3.2.1STUDYAREA ... 53
3.2.2FIELDSURVEYS ... 54
3.2.3BIOGEOCHEMICALANALYSIS ... 54
3.2.4OPTICALMEASUREMENTS ... 55
3.2.5OPTICALPROXIESOFPARTICLECHARACTERISTICS ... 55
3.2.6OPTICALCROSSSECTIONSANDMASS-NORMALIZEDIOPS ... 56
3.2.7STATISTICALANALYSIS ... 57
3.3RESULTS ... 58
3.3.1SPATIALVARIABILITYOFSPMFRACTIONS ... 58
3.3.2RELATIONSHIPSBETWEENSPMFRACTIONSANDIOPS ... 60
3.3.3MASS-SPECIFICOPTICALPROPERTIESOFSPM ... 61
3.3.4OPTICALREMOTESENSINGPROXIES ... 67
3.4DISCUSSION ... 69
3.4.1 SPATIAL PATTERNS OF SPM MICROPHYSICAL CHARACTERISTICS ... 69
3.4.2SPATIALVARIABILITYOFMASS-SPECIFICCOEFFICIENTSOF
SPM ... 70 3.4.3PARTICLESIZEANDCOMPOSITIONEFFECTSONOPTICAL
CROSSSECTIONS... 79 3.4.4OPTICALPROXIESOFPARTICLESIZEANDCOMPOSITION ... 80 3.5CONCLUSIONS ... 80 CHAPTER 4: EFFETS THERMIQUES DÛS À LA PRÉSENCE DE LA MATIÈRE PARTICULAIRE EN SUSPENSION DANS LES EAUX ESTUARIENNES ET LITTORALES ... 88
RÉSUMÉ ... 89
THERMAL EFFECT OF SUSPENDED PARTICULATE MATTER (SPM) IN ESTUARINE AND
LITTORAL WATERS ... 90
4.1.INTRODUCTION ... 91 4.2AIR-WATERHEATFLUXCOMPONENTS ... 93 4.2.1HEATBALANCETERMS ... 94 4.2.2PHYSICALFACTORSINFLUENCINGHEATBALANCETERMS ... 95 4.3REMOTESENSINGOFHEATBALANCETERMS ... 99 4.3.1SATELLITEMEASUREMENTS ... 99 4.3.2SHIPBOARDANDMOORINGMEASUREMENTS ... 100 4.4THERMODYNAMICMODELSCOUPLEDTOCIRCULATION ... 101 4.5IMPACTOFSPMANDCDOMONSSTANDRHR ... 104 4.6PARTICLE-MEDIATEDHEATVARIABILITYANDWEATHERPATTERN .... 107 4.6.1SEAICE ... 107
4.6.2CLOUDINESS ... 108 4.6.3AEROSOLS ... 108 4.6.4CLIMATEFEEDBACKS ... 110
CHAPTER 5: GENERAL CONCLUSION AND PERSPECTIVES ... 120 5.1CONCLUSION ... 120 5.2PERSPECTIVES ... 121 RÉFÉRENCES BIBLIOGRAPHIQUES ... 124
LIST OF TABLES
CHAPTER 2
Table 1 : Biogeo-optical relationships of CSPM as a function of Rrs(708)/Rrs(665). Regression
parameters are derived from the equation: y = A xB. Within parentheses two standard errors.
The number of observations in each case (N) was 10 ... 32 Table 2 : Simulated influence of mineral content of particulates on Rrs(708)/Rrs(665)
variability. Definition of regression parameters, uncertainties, and N as the list of abbreviations and acronyms ... 36 CHAPTER 3
Table 1 : Summary of biogeochemical variables during June 2013. Acronyms UE, SF, LE, FSPM and FPIMare defined in the Table of acronyms. N is the number of sampling per
sub-regions. ... 59 Table 2 : Spearman Rank correlations between particulate IOPs and SPM mass fractions. The statistical confidence level at 95 and 99% is symbolized with * and **, respectively ... 62 Table 3 : Particle size and chemical composition effects on mass-normalized IOPs. Spearman correlations for ai* and bi* are computed at a wavelength of 440 and 550
statistical confidence level at 95 and 99% is symbolized with * and **, respectively ... 65 Table 4 : Particle size and chemical composition effects on optical remote sensing proxies. Spearman rank correlations having a statistical confidence level at 95 and 99% are symbolized with * and **, respectively. N the number of observations is 23 ... 68 Table 5 : Mass-normalized absorption and scattering coefficients of SPM, PIM and POM in the SLE and different littoral environments. Acronyms , aSPM*, bSPM*, aPOM, aPIM, bPOM, bPIM and CSPM are defined in Table 1 ... 71 Table S1 : Spearman rank correlation between particulate IOPs of different SPM size fractions, , and FPIM. For each comparison, first, second, third and fourth value
corresponds to the wavelength of 440, 556, 665 and 708 nm, respectively. The number of sampling locations is 23 in all cases. The statistical confidence level at 95 and 99% are symbolized with * and **, respectively. ... 83 Table S2 : Relationships between optical remote sensing proxies and mass-normalized IOPs of SPM. For each Spearman Rank correlation coefficient, the statistical confidence level at 95 and 99% are symbolized with * and **, respectively. Mass-normalized absorption and scattering coefficients correspond to a of 440 and 550 nm, respectively ... 84 Table S3 : Relationships between size and chemical fractions of SPM. Each relation and statistical confidence is described in table 2. N the number of stations is 23 ... 85 Table S4 : Relationship between chlorophyll a concentration and . Each relation and statistical confidence is described in Table S2 ... 86 CHAPTER 4
LIST OF FIGURES
CHAPTER 1
Figure 1 : Factors influencing upwelling sunlight leaving the air-water interface ... 4 Figure 2. Light absorption components in coastal waters ... 6 Figure 3. Heat budget components in coastal waters ... 13 CHAPTER 2
Figure 1 : Study area; sampling locations during June 2012 (M1 to M10, inset A) ... 25 Figure 2 : Spectral remote sensing reflectance spectra in the SLE. Number next to each Rrs
curve indicates the concentration of SPM measured in situ, wavelengths used in equation (11) (pink solid circles), spectral Rrs slopes (pink broken line) ... 32
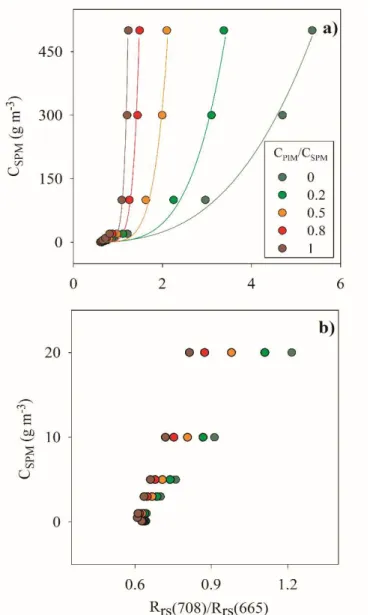
Figure 3 : Biogeo-optical relationships for estimating CSPM. a) CSPM versus
Rrs(708)/Rrs(665), b) CPIM/CSPM versus Rrs(708)/Rrs(665). Labels of data points
identify each sampling location, power-type regression model (dash line) ... 33 Figure 4 : Simulated particle composition effects on CSPM estimates. a) Variation of CSPM as
a function of Rrs(708)/Rrs(665) for particle assemblages having different chemical
composition, power-type regression models (solid lines), b) idem to a) but for the CSPM range measured during June 2012 ... 35
Figure A1 : Sampling locations for June 2013 surveys. SLE sub-regions, Lower estuary (LE, L6 to L44), Saguenay Fjords (SF, L1 to L5), and upper estuary (UE, L12 to L14), GSL: Gulf of Saint Lawrence, Maximum turbidity zone mean boundaries (hatched area). Study area during June 2012 is highlighted with a rectangle ... 44 Figure A2 : Response of NIR-visible optical proxy of Rrs(708)/Rrs(665) to optical properties
of SPM. GP = ap(665) bp(708) (ap(708) bp(665))-1.a) particulate absorption ratio.
Datapoints in the lower range (inset), b) particulate scattering ratio. SLE sub-regions for June 2013 surveys, UE (triangles), SF (rectangles) and LE (circles), are shown in Figure A1. Linear regression equation (upper left corner), modeled GP (dash line), between parentheses are two standard errors. ... 45 Figure A3. Exponential-type regression equation (upper right corner), modeled CPIM/CSPM (dash line), between parentheses are two standard errors ... 46 CHAPTER 3
Figure 1 : Spectral variations of mass-normalized optical coefficients for SPM size and chemical fractions. a) particulate absorption, b) particulate scattering. Each bar corresponds to the arithmetic average over the whole study area; uncertainty bars symbolize 2 standard errors. Subscript i and superscript j symbolize size and chemical fractions, respectively ... 63 Figure 2 : Sub-regional variations of mass-normalized optical coefficients of SPM. a) particulate scattering at = 440 nm, b) particulate absorption at = 550 nm. Each bar and uncertainty corresponds to the arithmetic average 2 standard errors of each sub-region (UE, SF and LE are defined in Table of acronyms. Subscript i and superscript j as in Figure 1 ... 66
Figure S1 : Study area. Sampling locations for the UE (green triangles), LE (blue rectangles), and SF (red circles) are indicated. GSL is the Gulf of St. Lawrence. ... 82
CHAPTER 4
Figure 1 : Net heat flux at the ocean-atmosphere interface ... 96 Figure 2 : The penetration of light spectra in coastal waters ... 98
LIST OF ABREVIATIONS AND ACRONYMS
AATSR Advanced along track scanning radiometer AO Atlantic oscillation
AOGCM Atmosphere-ocean general circulation model AOPs Apparent optical properties
ATOVS Advanced TIROS operational vertical sounder AVHRR Advanced very high-resolution radiometers BOI comp Bio-optical index for particle composions BOI size Bio-optical index for particle size fractions CDOM Chromophoric dissolved organic matter CDR Climate date records
Chl Chlorophyll-a concentration
CTD Conductivity, temperature, and depth DOM Dissolved organic matter
e Emissivity of the sea surface
EUMETSAT European organization for the exploitation of meteorological satellites Fr Fresnel reflectivity
GAC Global area coverage GBN Global buoy network
GHRSST Group for high resolution sea surface temperature GOES Geostationary operational environmental satellite GTS Global telecommunication system
HIRS High resolution radiation sounder HyspIRI Hyperspectral infrared imager
IASI Infrared atmospheric sounding interferometer
ISAR Infrared sea surface temperature autonomous radiometer LDV Laser Doppler velocimetry
LE Lower estuary
LIDAR Light detection and ranging
M-AERI Marine-atmosphere emitted radiance interferometer MEI Multivariate ENSO index
MERIS Medium resolution imaging spectrometer MHS Microwave humidity sounder
MIRS Microwave integrated retrieval system NAO North Atlantic oscillation
NAP Non-algal particulates
NESDIS National environmental satellite, data, and information service NIR Near-infrared
NOAA National oceanic and atmospheric administration PIM Particulate inorganic matter
PIV particle image velocimetry POM Particulate organic matter PSD Particle size distribution PSU Practical salinity units
RHR Radiant heat rate
RMSE Root mean square error SAR Synthetic aperture radar
SF Saguenay Fjord
SISTeR Scanning infrared sea surface temperature radiometer SLE Saint Lawrence Estuary
SLR Saint Lawrence river
SPM Suspended particulate matter
SSEC Space science and engineering center SSM/I Special sensor microwave imager SST Sea surface temperature
TIROS Television infrared observation satellite TOA Top of the atmosphere
UE Upper Estuary
UV Ultra violet
VOS Voluntary observing ships
LIST OF SYMBOLS
Wavelength nm
Heat capacity W m-2 kg-1 K-1
t Fresnel reflection coefficient
Laplacian of temperature ℃2 m-2
Horizontal viscosity m2 s-1
Heat flux at the depth h W m-2 s-1
Environment velocity m s-1
Coefficient of latent flux K W m-2 kg-1 K-1
Coefficient of sensible flux K W m-2 kg-1 K-1
, Constant pressure specific heat of air K W m-2 kg-1 K-1
( , ) Spectral downwelling at the depth z W m-2 nm-1
( , ) Net irradiance profiles at the depth z W m-2 nm-1
( , ) Upwelling irradiances at the depth z W m-2 nm-1
Irradiance in blue band W m-2
Incident spectral radiance in zenith and azimuth
directions μW m
-2 sr-1 nm-1
spectral radiance in zenith and azimuth
directions μW m
-2 sr-1 nm-1
Evaporative latent heat W m-2 s-1
Scattering phase function sr-1
( ) Single-scattering reflectance sr-1
Ω’ Solid angle of the incident light beam °
µ Medium refractive index
Latent heat flux W m-2 s-1
Sensible heat flux W m-2 s-1
Radiative heat flux W m-2 s-1
Complementary downwelling sky radiance Wsr−1m−2
Upwelling sea radiance Wsr−1m−2
Optical depth m
( ) Solar transmission function -
a( ) Total absorption coefficient m-1
( ) Water absorption coefficient at a specific
wavelength m -1
z
L
,
,
z
L
,
,
,
ap( ) Particulate absorption coefficient m-1
( )
Absorption coefficient of chromophoric dissolved organic matter at a specific wavelength
m-1
( ) Absorption coefficient non-algal particles at a
specific wavelength m-1
( ) Phytoplankton absorption coefficient at a
specific wavelength m-1
ap*( ) Mass-specific absorption coefficient for
particulate matter
m2 g-1
Specific heat of seawater W m-2 kg-1 °C-1 ( ) Attenuation coefficients of particulates with
blue/green colors m-1
( ) Attenuation coefficients of particulates with
red/yellow colors m-1
∗ Friction velocity m s-1
( ) Sea-surface albedo at a specific wavelength -
Air density Kg m-3
∆ Air-sea difference of temperature ℃
b( ) Total scattering coefficient m-1
bp( ) Scattering coefficient for particulate matter m-1
bb( ) Total backscattering coefficient m-1
bbeff( ) Backscattering efficiency
bbp( ) Particulate backscattering coefficient m-1
bbw( ) Water backscattering coefficient m-1
beff( ) Scattering efficiency Dimensionless
bbeff( ) Backscattering efficiency Dimensionless
bp*( ) Mass-specific particulate scattering coefficient m2 g-1
BOI size Biogeo-optical proxy for size distribution of
SPM
dimensionless
BOI comp Biogeo-optical proxy for chemical composition
of SPM
dimensionless
c( ) Total beam attenuation coefficient m-1
Chl Chlorophyll-a concentration mg m-3
CPIM Concentration of particulate inorganic matter g m-3
CPOM Concentration of particulate organic matter g m-3
CSPMMERIS MERIS-derived concentration of suspended
particulate matter
g m-3
Ed(λ) Spectral downwelling irradiance at a specific
wavelength
W m-2 nm-1
FSPMi
Contribution of size fraction i to the total mass
of SPM dimensionless
FSPMPIM
Inorganic fraction of suspended particulate matter
%
Mixed-layer depth m
Lg(λ) Reference radiance at a specific wavelength μW m-2 sr-1 nm-1
Lsky(λ) Sky radiance at a specific wavelength μW m-2 sr-1 nm-1
Lu(λ) Total water upwelling radiance at a specific
wavelength
μW m-2 sr-1 nm-1
Lw(λ) Spectral water-leaving radiance at a specific
wavelength
μW m-2 sr-1 nm-1
mSPM Mass of suspended particulate matter g m-3
nw Water refractive index
Net heat flux through the sea surface W m-2 s-1
r Average internal Fresnel reflection
T Temperature ℃
R(λ) reflectance at a specific wavelength sr-1
q Heat transfer coefficient W m-2 K-1
RHR(z) Radiant heat rate at specific depth ºC s-1
Rrs(λ) Remote sensing reflectance at a specific
wavelength
sr-1
SPM Suspended particulate matter g m-3
PIM Particulate organic matter g m-3
POM Particulate inorganic matter g m-3
U Wind speed above the air-sea interface m s-1
Z Depth m
α Thermal expansion coefficient of seawater ℃-1
Differential Junge slope
Number of particulates per
µm σa( ) Mass-specific absorption cross section m2 g-1
CHAPTER 1
1. GENERAL INTRODUCTION
1.1BASIC OPTICAL REMOTE SENSING CONCEPTS
Remote sensing is the scientific discipline that studies the characteristics of an object having a direct contact. Thus, remote sensing is a broad term that includes optical, thermal, microwave and acoustic measurements. Optical remote sensing measurements are obtained within the spectral range of UV-visible (300-700 nm) and near-mid IR (700-3000 nm).
Optical remote sensing measurements derived from satellites allow us to have synoptic observations of the object under investigation. Likewise, these methods provide the analysis of long-term regional trends on biogeochemical variables such as primary production, the fate of pollutants, and sediment transport in littoral waters (Jacobi et al., 2015; Balch et al., 2002; Coulombier et al., 2012b). However, traditional methods for monitoring SPM are based on costly and time-consuming oceanographic surveys that have a limited coverage, spatially and temporally.
1.2OPTICAL REMOTE SENSING SYSTEM COMPONENTS
An optical remote sensing system is constituted by four elements: 1. the light source, 2. the target or object to be detected, 3. the receiver or sensor, and 4. the optical medium between the receiver and the target. Passive optical remote sensing systems have the sun as the light source and can detect reflected energy coming from the target. Unlike passive optical systems, active optical systems have a laser as a light source. These systems are currently known as LiDARs or light detection and range.
1.3LIGHT PROPAGATION IN AIR AND WATER
The Penetrated beam in a water body can be absorbed or scattered. The photon is absorbed if it is permanently removed from the light beam. However, scattering redirects the angle of the light beam pathway. Unlike scattering which barely depends on the wavelength of the light beam, absorption highly depends on wavelength variation. The spectral beam attenuation coefficient c(λ) of a medium describes the fraction of incident beam intensity attenuated per meter of the medium.
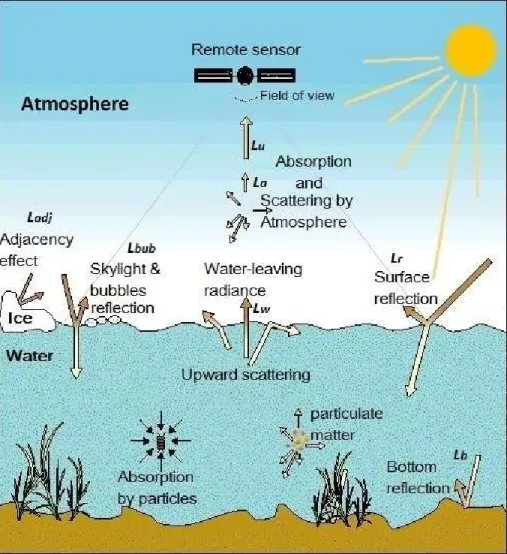
In studying biogeochemical processes at littoral surface waters, the goal is to measure the water-leaving electromagnetic signals reflected from water constituents towards the remote optical sensor. An optical remote optical sensor must deal with various interfering factors that influence the photon’s path length. These radiance contributions causing interference include the effect of atmosphere and aerosols, bottom reflection, reflection by air bubbles, and adjacency effects (Figure 1).
Lw + Lbub = Lu – Ls – Lb - Ladj (1)
where is water-leaving radiance, is the total upwelling radiance, is the surface reflected radiance, is the atmospheric radiance including Rayleigh scattering of gases and aerosols, is the bottom reflected radiance, is the adjacency reflected radiance, and is the bubble-reflected radiance. Surface reflected radiance ( ) is the portion of the incoming solar radiation that is reflected by the water surface (Schaepman-Strub et al. 2006). The radiance by atmosphere ( ) includes two contributions; Rayleigh scattering of gases and aerosols (Gordon, 1997; Wang, 2010). The radiance by adjacent objects (Ladj) (e.g., ice,
land) may cause light field distortions when they are very reflective or absorbing compared with the target to be detected (Lyapustin and Kaufman 2001). High wind speeds and breaking waves continuously produce bubble layers near the sea surface. The radiance due to bubble layers (Lbub) mainly affects Lw due to an increase in light scattering (Ma et al. 2015). Lw is
composed by elastic (i.e., scattering) and inelastic (i.e., fluorescence) contributions (Mobley, 1994). Reflection by the bottom ( ) in optically shallow waters can increase or decrease the water-leaving radiance depending bottom depth, inherent optical properties of water, and bottom reflectivity (Kostadinov et al. 2009).
Figure 1. Factors influencing upwelling sunlight leaving the air-water interface (adapted from www.dmu.dk)
1.4INHERENT AND APPARENT OPTICAL PROPERTIES (IOPS AND AOPS)
In optical remote sensing, two major concepts are used the most often: inherent optical properties (IOPs) of particulates that are independent of illumination conditions, and apparent
optical properties (AOPs) that closely depend on IOPs and the ambient illumination conditions (Mobley 1994). The variability in IOPs have a major influence on Lw by causing
scattering and absorption of photons. Indeed, light attenuation occurs due to either absorption, or scattering of light beam from its direct path by water molecules, dissolved matter, and particulates in the medium (Mobley 1994):
c(λ) = a(λ) + b(λ) (2)
where a(λ) and b(λ) are the spectral beam absorption and scattering coefficients in m-1 units,
respectively. In a water column, the sum of absorption coefficient of all single constituents form the bulk IOP:
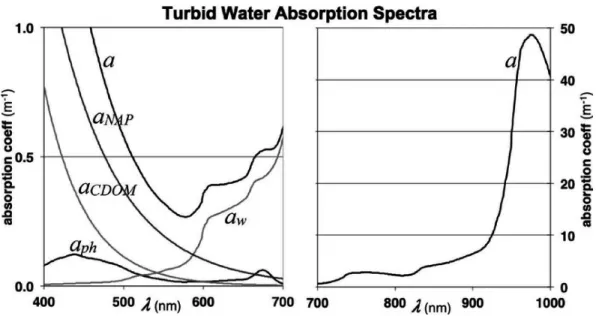
a(λ) = aw (λ) + aph (λ) + aNAP (λ) + aCDOM (λ) (3)
where aw(λ) is the absorption coefficient of water molecules. aph (λ) is the absorption
coefficient of phytoplankton, which is determined by the composition and concentration of pigments. aNAP (λ) is the absorption coefficients of non-algal particles (NAP). NAP is a
composite of detritus, suspended organic matter, zooplankton, and bacteria. aCDOM (λ) is the
absorption coefficient of chromophoric dissolved organic matter (CDOM). Operationally, CDOM is defined the material that passes through a filter of nominal pore size 0.2 µm (Bricaud et al. 1981). Figure 2 shows the schematic absorption spectra of water components within visible and near IR wavelengths. aw(λ) is the least variable among other absorption
Figure 2. Light absorption components in coastal waters (Turpie 2013)
Similarly, bulk scattering and backscattering (the fraction of light scattered at angled > 90 ̊ relative to incident beam direction) coefficients can be written as:
b (λ) = bw (λ) + bp (λ) (4)
bb (λ) = bbw (λ) + bbp (λ) (5)
where bw(λ), bp(λ), bbw (λ), and bbp (λ) are the scattering and backscattering coefficients for
water and particulates, respectively. Scattering properties of particulates are directly related to computations of remote sensing reflectance. Particle scattering highly depends on size, geometry, and refractive index of all components of the particulate (Loisel et al., 2006). For instance, phytoplankton has a smaller scattering coefficient compared to other particulates in coastal waters due to the high water content (Aas, 1996), except cocolihophores that are associated with high values of scattering coefficient due to their calcium carbonate content (Balch et al., 2002).
Apparent optical properties of particulates depend on inherent optical properties and the light geometry. This concept is illustrated using the definition of Rrs in the relationship
between IOPs and AOPs (Mobley 1994):
( ) = ( )( ) (6)
where is a remote sensing reflectance and an AOP, is water-leaving radiance, and is down-welling irradiance. The forward simulation of radiance distribution due to SPM includes water-leaving radiance at a specific wavelength, Lw(), and downwelling irradiance
signal due to SPM just above the water surface at a specific wavelength, Ed(,0+). These
variables are essential to computing the remote sensing reflectance Rrs() of SPM. The
interrelationship between IOPs and Rrs() is shown as (Mobley 1994):
( ) = ( )( )= ( ) ( )( ) (8)
where is remote sensing reflectance, is the proportionality factor that depends on both IOPs and AOPs of particulates, ( ) is particles absorption coefficient, and ( ) is particle backscattering coefficient.
Variations in optical properties of water depend on the type of water body. Natural waters are classified into two water types: case 1 and case 2 waters. Case 1 corresponds to waters where chlorophyll is the major responsible for variation in optical properties within the water column. In case 1 waters, we undertake that there is a strong covariation between optical properties at any specified wavelength and the pigment concentrations. However, in Case 2 waters, components other than chlorophyll, such as yellow substances or chromophoric dissolved organic matter (CDOM) and suspended matter contribute to this covariation (Mobley 1994). Unlike case 1 waters that single-variable biogeo-optical models could be used for deriving the water optical properties, case 2 waters require more complex algorithms
due to the spectral overlap of water constituents that causes a strong dependency between different components (Zarco-Tejada et al. 2000).
1.5OPTICAL REMOTE SENSING MODELS OF SPM
Radiative transfer models are used for developing biogeo-optical models based on IOPs of SPM and simulated radiance field. A radiative transfer model allows to track the fate of a photon in the water column, whether it is absorbed, scattered, or produced (e.g. bioluminescence). Briefly, the RTE expression is (Zaneveld et al. 2005):
(7)
where is the incident spectral radiance in (zenith at a specific direction, azimuth) direction , is the radiance created by scattering in direction in the medium, τ is the optical depth, µ is the medium refraction index, is the scattering phase function, ω(τ) is the single-scattering reflectance and Ω′ is the solid angle of the incident light beam. Currently there is no known general analytical solution to this equation, except when θ=0 (Zaneveld et al. 2005), which incorporates a derivative and an angular integral of the solution being sought (i.e. the directional radiance field L). To estimate the AOPs from IOPs (the forward approach), one needs to numerically solve the RTE as a function of the boundary (illumination) conditions. Inherent optical properties of particles can be computed based on apparent optical properties by using inversion models.
There are two types of remote sensing reflectance models for estimating suspended and dissolved matter based on linear relationships between SPM concentration and reflectance at certain wavelengths: single-wavelength, and, multiple-wavelength models. Remote sensing
L
z
d d d z L
, , 1 , , ~
z
L
,
,
,
L
,
,z
,
~reflectance at a single wavelength has been used as a proxy to estimate the concentration of particle assemblages in numerous studies (Gordon and Castaño 1987, Nechad et al. 2003, Zhang et al. 2006). Despite wide usage, single-wavelength models are sensitive to changes in particle characteristics and associated effects on scattering and absorption (Doxaran et al. 2003). By contrast, algorithms with band ratios are less sensitive to this natural variability. Indeed, band ratios minimize second-order effects and variability due to illumination conditions (Doxaran et al. 2003, Ruddick et al. 2008). These algorithms are widely used in studying the dynamics of suspended and dissolved matter in coastal waters (Gilerson et al. 2010, Montes-Hugo et al. 2012, Mohammadpour et al. 2015).
Estimating the characteristics of particle assemblages by biogeo-optical models is associated with uncertainties due to the optical variability of particles in littoral waters. Likewise, high absorption of light within UV-green wavelengths due to CDOM may cause bias on CSPM estimates due to highly absorptive characteristic within UV-blue wavelengths
(Huang et al. 2012). Finally, the optical properties of particulates per unit mass at a region may change through time (Lucotte et al., 1986; Xi et al., 2013). Indeed, biogeo-optical models need to be validated within reasonably short periods due to high dynamism of littoral waters (Wei et al. 2004, Yu et al. 2016).
1.6 OPTICAL REMOTE SENSING MODELS FOR STUDYING SECOND-ORDER ATTRIBUTES OF
SPM
Passive optical remote sensing techniques can be used for studying the second-order attributes of SPM (i.e., chemical composition and size distribution of SPM) in coastal waters (Neukermans et al. 2016, Woźniak et al. 2016, Organelli et al. 2016). These algorithms are constructed on particle backscattering ( ) and absorption ( ) coefficients at specific
wavelengths. Likewise, particulate absorption coefficient ( ) has been utilized for studying the variation in organic fraction of SPM in littoral waters (Neukermans et al. 2012, Woźniak 2014). The magnitude of ( ) has been used in developing algorithms for estimating particle chemical composition (Stramski et al. 2008, Martinez-Vicente et al. 2013). Likewise, the spectral slope of ( ) has been anticipated to be as an indicator of particle size distribution (Loisel et al. 2006, Kostadinov et al. 2009). In summary, understanding the variation of the optical properties of the second-order attributes of SPM, plays a key role in improving biogeo-optical models in coastal waters.
1.7MASS-SPECIFIC OPTICAL PROPERTIES OF SPM
The mass-specific absorption, σa, and scattering, σb, coefficients, known as optical cross
sections of particles per unit mass, are influenced mainly by their natural characteristics such as particle composition, refractive index, density, and size distribution, due to their dependency on characteristic variations per unit mass (Neukermans et al. 2012). Optical cross-section of particulates play a key role in developing optical remote sensing models. Likewise, they are highly useful in detecting and discriminating biogeo-optical properties of particulates. Particulate mass-specific absorption and scattering coefficients are given by:
∗ = (9)
∗ = (10)
where is the concentration of SPM, and and are the absorption and scattering coefficients of SPM, respectively. Unlike a*
SPM, optical cross sections are not empirical.
Instead, they must be computed based on models such as those based on Mie theory. The variation of optical cross sections of particulates depends on particle density and refractive
index. The partial regression coefficients from this multiple linear regression are the mass-specific scattering cross sections for the particulate inorganic and organic matter (PIM, POM), indicated as and , and are given by (Stavn and Richter 2008):
( ) = ( ) (11)
( ) = ( ) (12)
where ( ) and ( ) are, the particle scattering cross sections for mineral and organic fractions of particulates, respectively, ρ is the particle density, v is the volume of a single (mineral or organic) particle, and is the volume fraction of dry organic matter in the organic particle. Optical cross sections of particles in terms of particle size, shape, and density, play key role in the simulation of water turbidity in littoral waters through the parameterization of turbulent kinetic energy within the water column (Bowers 2003, Peng and Effler, 2012; Rottgers et al., 2014).
1.8BIOGEO-OPTICAL WATER COMPONENTS AND HEAT TRANSFER ACROSS THE AIR-WATER
INTERFACE
The attenuated solar energy in coastal waters is partially transformed to heat depending on environmental and biogeochemical conditions of the water body such as zenith angle and water turbidity. Main components affecting light absorption and temperature variation in oceanic clear waters is phytoplankton (Morel 1988). The heat transfer related to absorption is as follows (Modest 2003):
where q is the heat transfer coefficient, T is a reference temperature, and T is temperature.
Any relatively warm object emits electromagnetic waves to different directions of the surrounding space by the Planck’s law of black body radiation. The total exchange of heat
at the air-water interface can be partitioned as (Komori et al. 1993):
= + + (14)
where is the sensible heat flux, is the latent heat flux, and is the radiative heat flux in Wm-2 (Figure 3). These partitions are explained in more details in chapter 4. The
relationship between radiative heat transfer and temperature fluctuation at the air-water interface is Modeled (Qiu and Kelly 1993, Isobe et al. 2014). More specifically, Manizza et al. (2005) parameterized the thermal effect of phytoplankton assemblages in terms of biological heating by:
( ) = 0.58 + + (15)
Where ( ) is downward radiative flux at the depth z, I0 is surface irradiance, IRED and IBLUE
are 21% of I0 (reanalysis product available in NCEP-NCAR), and and are the
attenuation coefficients at red and blue wavelengths, respectively, derived by (Morel 1988):
= 0.225 + 0.037 ℎ . (16)
= 0.0232 + 0.074 ℎ . (17)
Equations (15-17) approve the feedback of suspended and dissolved matter to solar radiation within UV-IR wavelengths through increasing the water surface temperature at the top layer of watercolumn (Siegel et al. 1995, Isobe et al. 2014).
Figure 3. Heat budget components in coastal waters (adapted from www.luther.edu)
Particle-mediated heat radiation performs environmental feedbacks in coastal and estuarine waters. Indeed, biological heating contributes in modifying sea-ice cover, vertical mixing, and surface heat flux in high latitude waters (Manizza et al. 2005). The increase of the temperature at the water surface thickens the mixed layer in the atmosphere and increases the vertical velocity of air (Mechem et al. 2012). This process can slightly change the direction of weather fronts and impact the cloudiness over the target region (Senatore et al. 2014). In summary, particle mediated heat exchange at the air-water interface can play a key role in manipulating biogeochemical and environmental processes in coastal waters.
1.9THE ST.LAWRENCE ESTUARY (SLE)
The SLE is a unique environment in terms of the dynamics of dissolved and suspended particulates, primary production, tidal currents, and resuspension processes that control the advection and turbulent diffusion of SPM (El-Sabh and Silverberg 1992). The estuary covers an area of 12,850 km2, which begins at the upper limit of the salt-water intrusion near Quebec
City, and extends 400 Km downstream to Pointe-des-Monts. The SLE is a transitional environment where the waters of the Atlantic and those of the Great Lakes converge (Forrester 1970). At the Quebec City, the drainage region of the St. Lawrence River hosts ~375 km3 yr-1 of fresh water (El-Sabh and Silverberg 1990a). The SLE has been traditionally
divided into two subregions such as the upper estuary, which covers the area between Ile d’Orleans and the mouth of the Saguenay fjord, and the lower estuary, which is extended from the Saguenay fjord until Pointe-des-Monts. The average depth of the upper estuary varies around 60 m with the lowest depth along the south shore of the estuary. while the lower estuary can be as deep as 250 – 400 m due to the Laurentian channel (El-Sabh and Silverberg 1992).
Considering complex physical and biogeochemical processes, the SLE is a suitable environment to develop remote sensing tools to study the biogeochemical processes and dynamics in this region, and expand those parameterizations to other estuarine and coastal waters in the world. Various studies on the SLE have revealed significant characteristics of estuarine waters and their influence on ocean color. These studies include the performance of bio-optical models on SPM estimates and the effect of particle composition on their performance (Larouche and Boyer-Villemaire 2010, Montes-Hugo et al. 2012, Montes-Hugo and Mohammadpour 2012, Mohammadpour et al. 2015), particle chemical composition (Gobeil et al. 1981, Tremblay and Gagné 2007, 2009), particle size distribution (Chanut and Poulet 1979, Poulet et al. 1986), particle dynamics (d’Anglejan and Smith 1973, Gagné et al.
2009, Coulombier et al. 2012a), physical processes (Bourgault et al. 2001, 2005, 2014), and the influences of teleconnections (Assani et al. 2010).
1.9.1PHYSICAL PROCESSES
In the upper estuary, tidal currents are responsible for more than 90% of variations in currents (Saucier and Chassé 2000). Strong salinity gradient at the water surface characterizes this region due to the fresh water discharge by the SLR near Quebec City, which alters the salinity within the range of 0 – 20 psu from Quebec City to the mouth of the Saguenay fjord. This process intensifies the stratification conditions, and hence, weakens vertical circulations (Nieke et al. 1997). In the lower estuary, salinity varies between 20 and 30 psu due to tidal oscillations in the vertical shear of the geostrophic current. This resonant oscillation causes the density gradients to influence the upwelling zone near the mouth of the Saguenay fjord (Forrester 1970, Therriault and Levasseur 1985).
1.9.2TIDAL CURRENTS, WAVES, AND DYNAMICS OF SPM
The SLE have salt marshes that serve to dissipate energy of tidal currents and waves. In the SLE, factors controlling the concentration of dissolved and suspended matter include the river discharge and their concentrations of geochemical traces, tide amplitude, estuarine geometry, mixing processes, and biological production. In the upper estuary, wind-driven waves and density gradient in the frontal regions cause sediment resuspension within shallow regions and the zone separating discharged fresh water of the St. Lawrence River from ocean salt water (Coulombier et al. 2012b). Likewise, the maximum turbidity zone in the upper
estuary supplies large sediments through tidal currents that induce cyclic seasonal erosion and a sedimentation rate as high as several centimeters per year (Troude and Sérodes 1990). Meybeck et al. (2003) showed the average daily yields of SPM in the SLE varied within 10 – 50 kgkm-2day-1. Likewise, the sedimentation rate from free-drifting sediment traps in the
SLE moved from ~4.5 mm. year-1 in spring to ~1 mm. year-1 in fall (Tremblay and Gagné
2009). However, the conditions in the lower estuary are partially different from the upper estuary. The lower estuary, has more marine characteristics with respect to the upper estuary. This region is more exposed to waves and tidal currents, and tidal flats contain more fine sand. The lower estuary contains lower concentrations of suspended matter with respect to the upper estuary, which explains the role of currents and waves in particle dynamics and transport in this region (Coulombier et al. 2012a). Indeed, shear instabilities at the surface create barocliny and vertical fluxes of mass that are responsible for vertical distribution of nutrients and suspended particles (Bourgault et al. 2001). Likewise, in the lower estuary, the predominant northwesterly winds blow parallel to the southern shoreline and create the Gaspé current that displaces water mass and water constituents from the upper estuary and Saguenay fjord towards the Gulf of St. Lawrence (Koutitonsky and Bugden 1989).
1.10OBJECTIVES
The objectives of this thesis are:
• To evaluate the performance of different optical remote sensing models for estimating SPM in SLE waters
• To determine mass-specific optical coefficients for different chemical and size fractions of SPM in SLE waters
• To review literature regarding how particulate and dissolved matter influence the surface water temperature and local climate
1.11HYPOTHESES
To achieve our goals in this research, the following assumptions are considered: • First hypothesis: Optical remote sensing can be used to obtain reliable CSPM
estimates in surface waters of the SLE.
• Second hypothesis: Second-order attributes of SPM can be estimated in SLE waters based on optical remote sensing models
1.12GENERAL METHODOLOGY
The general methodological approach includes three tools. Firstly, field surveys for developing and validating the in-water biogeo-optical relationships. Secondly, simulations, and lastly, implementations of satellite-based models of SPM based on in-water algorithms. The first tool comprised oceanographic surveys during June 2012 and June 2013, during which, biogeochemical measurements were performed based on sampling and filtrating surface seawater (< 2m of depth) at the target stations. We performed above-water remote sensing measurements during the 2012 survey, to determine apparent optical properties of surface water. The data obtained were used for developing optical proxies to estimate the SPM concentration in the SLE. Likewise, we measured particle attenuation and absorption coefficients and particle size distribution at each target station during June 2013. Those
measurements allowed us to characterize optical cross sections of particles based on particle mass, chemical composition, and size distribution in the sampling region during this period. The third and final tool we used was a radiative transfer model (Hydrolight 2.0, Sequoia Inc.) constrained by in situ measured IOPs, in order to simulate remote sensing reflectance (Rrs) values of MERIS spectral band ratios Rrs(708)/Rrs(665) and Rrs(753)/[Rrs(665)-
Rrs(708)]. In general, the combination of these measurements and methods allowed us to
achieve the specified objectives, although they individually have their advantages and disadvantages.
1.13STRUCTURE OF THE THESIS
The thesis is divided in five chapters. The first chapter covers the general introduction, explaining the essential perceptions about optical remote sensing and optical properties of water constituents in coastal regions. In the second chapter, we will explain the fundamental concepts of particle optics and the effects of particle concentration on bio-optical proxies. Moreover, we will discuss the influence of particles chemical composition on the satellite-derived SPM concentration. The third chapter explains how chemical composition and size distribution of particles affect the particle optical cross sections in our study area. Likewise, it considers the effect of particle size distribution and chemical composition on the optical proxies enlisted to estimate SPM concentration. The fourth chapter reviews the role of particles in radiant heat transfer and their influence on the variation of SST. The effect of teleconnections on particle concentration and attributes within estuarine and complex case II waters – with an interest in the SLE – have also been described. Finally, the fifth chapter covers the general conclusions and perspectives of the thesis.
CHAPTER 2
EFFETS DE LA COMPOSITION DES PARTICULES SUR LES MATIERES EN SUSPENSION DÉRIVÉE DE MERIS : UNE ETUDE SUR L’ESTUARE DE
SAINT- LAURENT
Ce premier article, intitulé « Particle composition effects on MERIS-derived SPM: a case study in the Saint Lawrence Estuary», fut corédigé par moi-même ainsi que par les professeurs Martin A. Montes-Hugo, Robert Stavn, Jean-Pierre Gagné, et Pierre Larouche. Il fut accepté pour publication dans sa version finale en 2015 par les éditeurs de la revue Canadian Journal of Remote sensing. En tant que premier auteur, ma contribution à ce travail fut l’essentiel de la recherche sur l’état de l’art, le développement de la méthode, et l’exécution des tests de performance. Le professeur Martin A. Montes-Hugo, second auteur, a fourni l’idée originale. Il a aidé à la recherche sur l’état de l’art, au développement de la méthode ainsi qu’à la révision et la rédaction de l’article. Les professeurs Robert Stavn, Jean-Pierre Gagné, et Jean-Pierre Larouche ont aidé à la recherche sur l’état de l’art ainsi qu’à la révision de l’article. Une version abrégée de cet article a été présentée à la conférence International Geoscience and Remote Sensing Symposium, à Québec (Québec, Canada) à l’été 2014.
Mohammadpour G., Montes-Hugo M.A., Stavn R., Gagne J.P., Larouche L. Particle composition effects on MERIS-derived SPM: a case study in the Saint Lawrence Estuary. Canadian Journal of Remote Sensing. Vol. 41, issue 6, 2015, doi: 10.1080/07038992.2015.1110012
Résumé
Un modèle optique empirique pour estimer la concentration de particules en suspension (CSPM) a été développé dans la partie supérieure de l’estuaire du Saint-Laurent, basé sur la
réflectance (Rrs) mesurée par télédétection correspondant aux canaux spectraux 7 et 9 (centrés
sur des longueurs d’onde de 665 et 708 nm, respectivement) du capteur MERIS (Medium Résolution Imaging Spectromètre). La sensibilité de CSPM au changement du contenu en
minéraux des particules en suspension a été examinée en utilisant des valeurs simulées de Rrs. Pour les mesures de juin 2012, les valeurs observées de Rrs(708)/Rrs(665) en fonction de
CSPM peuvent être modélisées par une relation de type puissance (y = 235.7 x8.321, r2 = 0.7,
N = 10). De plus, des simulations numériques et une analyse de régression de type II révèlent que le paramètre exposant de ce modèle biogéo-optique diminue lorsque les particules en suspension deviennent plus riches en matière organique.
PARTICLE COMPOSITION EFFECTS ON MERIS-DERIVED SPM: A CASE STUDY IN THE SAINT LAWRENCE ESTUARY
Mohammadpour Gholamreza1, Martin A. Montes-Hugo1*, Robert Stavn2,3,
Jean-Pierre Gagné1, Pierre Larouche4
1Institut des Sciences de la Mer de Rimouski, Université du Québec à Rimouski, 310 Allée des Ursulines, Office P-216, G5L 3A1, Rimouski, Québec, Canada
2Visiting scientist, Naval Research Lab, Stennis Space Center, MS, USA 3Department of Biology, University of North Carolina/Greensboro, USA 4Institut Maurice-Lamontagne, Pêches et Océans Canada, Québec, Canada
*Author to whom correspondence should be addressed; Tel.: +1-418-723-1986 (ext. 1961),
Fax: +1-418-724-1842, E-Mail: martinalejandro_montes@uqar.ca
Abstract. An empirical optical model for estimating the concentration of suspended particulate matter (CSPM) was developed in the upper part of the Saint Lawrence Estuary
based on remote sensing reflectance (Rrs) measurements corresponding to MERIS (MEdium
Resolution Imaging Spectrometer) spectral channels 7 and 9 (i.e., centered wavelengths 665 and 708 nm, respectively). Sensitivity of CSPM estimates to changes on mineral content of
suspended particulates was investigated based on simulated Rrs values. For June 2012
measurements, CSPM varied with Rrs(708)/Rrs(665) values following a power-type
relationship (y = 235.7 x8.321, r2 = 0.7, N = 10). Also, numerical experiments and analysis of
regression type II showed that exponent parameter of this biogeo-optical model decreased as suspended particulates become more enriched in organic matter.
2.1INTRODUCTION
The study of the distribution of suspended particulate matter (SPM) in littoral environments has several applications in civil engineering and ecology including the characterization of coastal erosion patterns (Fettweis et al., 2012), the monitoring of harmful algae blooms (Miller et al., 2006), and the managing of fisheries (Gernez et al., 2014). The characterization of SPM dynamics based on discrete ship-based measurements is costly in estuarine and coastal areas due to the large temporal and spatial variability of water constituents. Overcoming these limitations is possible by performing a synoptic mapping of SPM based on optical measurements derived from satellite sensors (Miller and McKee, 2004). Although several remote sensing algorithms based on visible and near-infrared (NIR) wavelengths have been proposed for characterizing the concentration of SPM (CSPM) in
littoral surface waters (Doxaran et al., 2002; D'Sa et al., 2007; Nechad et al., 2009; Montes-Hugo and Mohammadpour, 2012), their use cannot be generalized across different environments due to variations in regression model coefficients associated with changes in water optical composition including variability of particle attributes (e.g., mineral content).
Here we investigate how parameters of an empirical biogeo-optical relationship for estimating CSPM and based on MERIS (MEdium Resolution Imaging Spectrometer)
radiometric bands 7 and 9 (i.e., centered wavelengths 665 and 708 nm, respectively) are influenced by changes in particle chemical composition. The experiments were conducted with samples obtained in the upper part of the Saint Lawrence Estuary (SLE) and during June of 2012. The main working hypothesis states that non-linear variation of remote sensing reflectance ratio Rrs(708)/Rrs(665) as a function of CSPM is strongly related to particle
This deviation from linearity is linked to the combination of two SPM chemical components (i.e., mineral vs organic matter) with different indices of refraction.
The results of this contribution have three important applications. First, they will help to generalize biogeo-optical models of CSPM across different littoral environments. Second, they
will provide key information about the bias of CSPM estimates due to changes in particle
composition. Lastly, they will be useful for estimating the fraction of inorganic material in suspended solids if the relationship between CSPM and Rrs is known a priori.
2.2METHODS
2.2.1STUDY AREA
The lower estuary waters are brackish (salinity = 0-25 psu), relatively shallow (i.e., bottom depth < 50 m), and characterized by high spatial and sub-daily variations of CSPM values (1
to 400 g m-3) (Yeats, 1988). Minerals dominate the chemical composition of suspended
particulates by contributing up to 95% of SPM mass (Sundby, 1974; Yeats, 1988). The size spectrum of suspended particulates is strongly influenced by the presence of small particles (~5 µm in diameter) (Poulet et al., 1986). The concentration of CDOM or chromophoric dissolved organic matter, as reflected by its absorption coefficient (aCDOM), is very high (up
to 2 m-1 at 412 nm) with respect to other SLE sub-regions (Nieke et al., 1997).
2.2.2DATASETS
Field surveys were performed during June 14 of 2012 and encompassed 10 locations situated NE of the Orleans Island (M1 to M10, Figure 1). Discrete water samples for chlorophyll a concentration (chl), aCDOM, CSPM, and concentration of particulate inorganic
matter (CPIM) were obtained at 2 m depth by using a Niskin bottle (12 L). Also at each
location, spectral radiance measurements for remote sensing reflectance calculations were made with a hand-held radiometer (see Above-water radiometric measurements).
2.2.3BIOGEOCHEMICAL ANALYSIS
The concentration of SPM in g m-3 was measured gravimetrically after filtering a volume
of seawater through pre-weighed GF/F filters (47 mm, pore size = 0.7 µm, Whatman) (Aminot and Chaussepied, 1983). The precision of CSPM determinations was 15%. The
inorganic fraction of SPM was obtained after removing the organic components of the original sample by combustion at 450°C for 6 h. The analysis of Chl includes the following steps: 1) filtration of 0.5 L samples using GF/F membranes (25 mm, pore size = 0.7 µm Whatman), 2) storage of samples in liquid nitrogen and during 72 h, 3) 24-h extraction of pigments in cold (i.e., 4-5°C) 90% acetone and dark conditions, and 4) fluorescence measurements of extracted samples and standards (Mueller et al., 2003). The Fluorometer used in this study (TD-10AU, Turner Designs) allowed Chl determinations with a precision of 4%. Water samples for aCDOM determinations were obtained with clean amber glass bottles
and immediately filtered through 0.2 µm membranes (nucleopore, Whatman). Filtrates were kept in dark conditions at 4oC till processing at ISMER. Spectral a
CDOM measurements were
performed with a dual beam UV-visible spectrophotometer (Perkin-Elmer Lambda-35) and using Nanopure water as a baseline (Mueller et al., 2003).
2.2.4ABOVE-WATER RADIOMETRIC MEASUREMENTS
The radiometric data were collected under clear skies and calm wind conditions (i.e., wind speed < 4 ms-1, wave height < 0.3 m) using a portable spectrometer (ASD FieldSpecPro RS,
spectral range = 350-1000 nm, spectral resolution 10 nm). Spectral radiance measurements of sky and water components were obtained at 1 m from the air-water interface. To compute Rrs, three types of radiance measurements were made: the total water upwelling radiance, Lu,
Rrs() = g() (Lu() - Fr() Lsky())/( Lg()) (1)
Ed() = Lg()/g() (2)
where Fr is the Fresnel reflectivity, Lu - Fr Lsky is equivalent to the water leaving radiance
(Lw), and Ed is the downwelling irradiance. Upward (i.e., Lu and Lg) and downward (i.e., Lsky)
radiance components were measured at 40° with respect to the vertical, and 135° with respect to the solar azimuth (Mobley, 1994). The final magnitude of Lu, Lsky and Lg was computed
by averaging three samples having an integration time of 0.65, 0.14, and 0.03 s, respectively. Fr is equal to 0.02 and Fr Lsky represents the Ed fraction due to diffuse photons going to the
ASD sensor after being retro-reflected against the air-water interface. Lg is measured using a
Spectralon plaque with a known spectral reflectivity (i.e., g = 0.995 and 0.998 at a
wavelength of 665 and 708 nm, respectively) and assuming a Lambertian reflectance distribution function.
2.2.5CORRECTIONS DUE TO SENSOR DIFFERENCES
To obtain synthetic MERIS-derived Rrs values, in situ Rrs measurements were weighted
by the response function of the spaceborne imager (Froidefond et al., 2004):
( ) =
∑ () , ()
∑ () , () (3)
where i is the wavelength and j stands for MERIS radiometric channels 7 and 9, Si,j() is the