How and Why do Investors Trade Votes, and What Does it Mean?
34
0
0
Texte intégral
(2) CIRANO Le CIRANO est un organisme sans but lucratif constitué en vertu de la Loi des compagnies du Québec. Le financement de son infrastructure et de ses activités de recherche provient des cotisations de ses organisations-membres, d’une subvention d’infrastructure du ministère de la Recherche, de la Science et de la Technologie, de même que des subventions et mandats obtenus par ses équipes de recherche. CIRANO is a private non-profit organization incorporated under the Québec Companies Act. Its infrastructure and research activities are funded through fees paid by member organizations, an infrastructure grant from the Ministère de la Recherche, de la Science et de la Technologie, and grants and research mandates obtained by its research teams. Les organisations-partenaires / The Partner Organizations PARTENAIRE MAJEUR . Ministère du développement économique et régional et de la recherche [MDERR] PARTENAIRES . Alcan inc. . Axa Canada . Banque du Canada . Banque Laurentienne du Canada . Banque Nationale du Canada . Banque Royale du Canada . Bell Canada . BMO Groupe Financier . Bombardier . Bourse de Montréal . Caisse de dépôt et placement du Québec . Développement des ressources humaines Canada [DRHC] . Fédération des caisses Desjardins du Québec . GazMétro . Hydro-Québec . Industrie Canada . Ministère des Finances du Québec . Pratt & Whitney Canada Inc. . Raymond Chabot Grant Thornton . Ville de Montréal . École Polytechnique de Montréal . HEC Montréal . Université Concordia . Université de Montréal . Université du Québec à Montréal . Université Laval . Université McGill . Université de Sherbrooke ASSOCIE A : . Institut de Finance Mathématique de Montréal (IFM2) . Laboratoires universitaires Bell Canada . Réseau de calcul et de modélisation mathématique [RCM2] . Réseau de centres d’excellence MITACS (Les mathématiques des technologies de l’information et des systèmes complexes) Les cahiers de la série scientifique (CS) visent à rendre accessibles des résultats de recherche effectuée au CIRANO afin de susciter échanges et commentaires. Ces cahiers sont écrits dans le style des publications scientifiques. Les idées et les opinions émises sont sous l’unique responsabilité des auteurs et ne représentent pas nécessairement les positions du CIRANO ou de ses partenaires. This paper presents research carried out at CIRANO and aims at encouraging discussion and comment. The observations and viewpoints expressed are the sole responsibility of the authors. They do not necessarily represent positions of CIRANO or its partners.. ISSN 1198-8177.
(3) How and Why do Investors Trade Votes, and What Does it Mean? Susan E. K. Christoffersen*, Christopher C. Geczy†, David K. Musto‡, Adam V. Reed§ Résumé / Abstract L’analyse classique de la gouvernance d’entreprise suppose que les actionnaires votent selon les modalités choisies par la firme, par exemple un vote par action. Mais si les coûts associés à la séparation et à l’échange des votes sont suffisamment faibles, alors les actionnaires votent selon les modalités qu’ils ont eux-mêmes choisies. Nous présentons le cas d’un marché actif de votes au sein du marché des mises de fonds sous forme d’emprunts (equity loans), où nous constatons qu’en moyenne les votes se vendent pour rien. Nous supposons que l’asymétrie d’information provoque cette réallocation des votes, et nous étayons cette hypothèse à travers l’étude transversale des votes : le nombre d’opérations est plus important pour les compagnies dont l’écart acheteur-vendeur est plus élevé ainsi que pour celles dont les résultats sont plus faibles, particulièrement lorsque le vote est clos. Cette étude montre aussi que la réallocation des votes permet de soutenir les propositions des actionnaires et de s’opposer à celles des gestionnaires. Mots clés : transaction de votes, gouvernance d’entreprise, prêt d’actions,. asymétrie d’information.. The standard analysis of corporate governance is that shareholders vote in the ratios that firms choose, such as one-share-one-vote. But if the cost of unbundling and trading votes is sufficiently low, then shareholders vote in the ratios that they themselves choose. We document an active market for votes within the equity-loan market, where we find that the average vote sells for zero. We hypothesize that asymmetric information motivates these vote reallocations, and we find support for this view in the cross section of votes: there is more trade for higher-spread firms and more for poor performers, especially when the vote is close. We also find that the vote reallocations correspond to support for shareholder proposals and opposition to management proposals. Keywords: vote trading, corporate governance, equity lending, information. asymmetry.. *. McGill University and CIRANO. University of Pennsylvania. ‡ Corresponding author. Finance Dept., Wharton School, 3620 Locust Walk, Philadelphia PA, 19104; Phone 215-8984239, e-mail [email protected]. § The University of North Carolina. †.
(4) “Within hours of a crucial vote, British Land attacked the credibility and methods of dissident shareholder Laxey Partners, revealing that it had borrowed 90% of the shares with which it will vote at today's annual meeting. British Land yesterday asked Laxey to reveal how it came to triple its stake in the company from 2.9% to 9% over three days last week when normal trading reflected no such movements. Laxey chairman Colin Kingsnorth admitted he had borrowed 41.7m of the 46.6m shares he had declared an interest in. He told the board there was no set length of time for the trade but 'it is market etiquette to hold the borrowed stock for at least a week'. British Land chairman John Ritblat is furious but will not be able to stop Laxey voting against him.”1 If shareholders could trade their voting rights, what would they do? The economic, legal and finance literatures all offer theoretical analysis of corporate vote trading, but aside from anecdotes, no empirical evidence on what actually occurs. The goals of this paper are to first provide such evidence, and then offer and test a explanation for what we find. Votes are the direct control of public firms by the public, so much can turn on whether they trade.. And while an additional trading opportunity might seem obviously beneficial,. existing work is mixed on the benefits of the opportunity to trade votes. Because vote trading unties control rights from cash-flow rights, it jeopardizes the efficiency gains of tying one share to one vote (Grossman and Hart, 1988, and Harris and Raviv, 1988). Similarly, an investor’s desire to buy votes alone rather than votes plus cash-flow rights might signal an objective other than shareholder value (Cole, 2001). Also, the equilibrium market price of a vote may be small even if its value without trading is large, because if the buyer is expected to acquire enough votes to prevail even without a shareholder’s vote, that vote is worth nothing to anybody (Grossman and Hart, 1988). On the positive side, vote trading can restore efficiency when capital-gains taxes discourage share trading (Blair, Golbe and Gerard, 1989) and may alleviate the free-rider problem of Grossman and Hart (1980) by allowing better management to buy control without paying their value-added by buying shares (Neeman and Orosel, 2003). As the above examples illustrate, analyses of vote trading focus on a particular scenario, one where shareholders choose between competing teams of firm managers whose public and 1. “British Land slams shareholder Laxey”, Sarah Marks, Evening Standard, July 16, 2002.. 1.
(5) private values are common knowledge. In this scenario, votes aggregate voters’ preferences arising from their exposures to these values.. This is a manifestly important scenario to. understand, but votes can aggregate more than preferences. In particular, votes can aggregate dispersed information about the values of the competing outcomes, and this aggregation could also be important to the vote trade. Since the dispersion of information can be a poor match to the dispersion of shareholdings, vote trading can improve the aggregation of this information. The causes and consequences of vote trading are thus a key and open question. The obstacle to addressing this question has been the lack of relevant data. We overcome this obstacle by turning, as suggested by Harris and Raviv (1988), to the equity-loan market. Since equity loans transfer ownership without economic exposure, and since votes accrue to record-date owners, record-date equity loans are well-suited for the vote trade.. We have. assembled two large equity-loan databases so we can observe both prices and quantities of these vote trades for a wide cross section of U.S. firms. To characterize the economic role of the trades, we relate them to the cross section of the proposals at stake, the circumstances of the firms and the voting outcomes. Our first, basic, result is that the lending market does in fact host a vote market. This is readily apparent in Figure 2, which contrasts loan volume on voting record dates with volume on surrounding dates, showing a record-date spike. Considering this first result, our second result is a surprise: the average vote sells for zero. This can be seen in Figures 3 and 4, which contrast loan pricing on voting record dates with pricing on surrounding dates, as reported by the two databases, showing zero record-date movement. Thus, the lenders are not so much selling their votes as yielding them. Since shareholders are likely better off voting their interests than giving their votes away, we propose a hypothesis: vote trading is motivated by asymmetric information.. 2.
(6) Shareholders do not know how to vote their interests, and are taking their chances that the votes transfer to investors who do know how and who share their preferences. This is similar in spirit to the “swing voter’s curse” identified in the political context (Feddersen and Pesendorfer, 1996), but with the additional tactic of yielding available in the corporate context. The asymmetric-information hypothesis makes testable predictions for the cross section of votes. Most directly, vote trading should increase with asymmetric information. We take this to the data by proxying with the firm’s bid/ask spread, and Figure 5 shows the result: as the spread goes up, so does the vote trade. Also, the benefit of yielding votes to better-informed investors increases with the importance of the proposal at stake, so vote trading should as well. By contrast, if information were symmetric then the incentive to yield a vote would decrease as it became important; there would be nothing to gain but, to the extent preferences differ, more to lose. What we find, with a variety of proxies, is a robust increase: vote trading is greater for poor performers, whether we look at accounting or market performance, and among these poor performers, it is greater when the voting outcome is closer. Also, as management becomes more entrenched, trading for shareholder proposals goes up, whereas trading for management proposals goes down, a contrast we relate to recent findings on corporate governance. The ultimate significance of the vote trade lies in how the votes are cast. We cannot observe this directly but we can observe how vote trading relates, in the cross section, to outcomes. We find that the relation is consistently against management: vote trading correlates with support for shareholder proposals and opposition to management proposals, both in the fraction of votes cast and in the likelihood that the proposal wins. The rest of the paper is in five sections. Sections I and II cover the background and the data. Section III provides the basic results on prices and quantities of vote trades, Section IV. 3.
(7) relates vote trading to the cross section of firms, proposals and outcomes, and Section V summarizes and concludes.. I.. Background. I.A. Overview of Vote Trading Shares tie voting rights to cash-flow rights, but only for a moment – the market close of. the record date. Ownership the moment before or the morning after is irrelevant. So even with no financial engineering, a market for votes is feasible, analogously to the market for dividends. If one group sells at the cum-date close and buys back at the ex-date open, and another group does the opposite, then they have successfully traded votes, plus an overnight of economic exposure. If options are available, this exposure could be hedged with puts and calls. But while this is all feasible, it may not be economical. Market makers must charge for the possibility that trades of economic exposure are adversely selected (Bagehot, 1970), so the combined transactions costs of one side selling and buying and the other side buying and selling, plus the hedges, could be prohibitive. The efficient solution to the transactions-cost problem is the equity loan. Equity loans convey no economic exposure, so market makers have no reason to charge for adverse selection when borrowing from the first group or lending to the second. In fact, votes are the only thing that loans do convey, since shares are returned and dividends reimbursed.2 Loans therefore reduce the transaction to its bare essentials, so as Harris and Raviv (1988) observe, the equityloan is a logical host for the market for votes.. 2. Though dividends are reimbursed, they can be worth more to the borrower than to the lender (Christoffersen, Geczy, Musto and Reed, 2003).. 4.
(8) Equity loans solve the trading cost problem but they may risk regulatory intervention, at least in the U.S. Most immediately, trading votes separately from their underlying interests can be illegal (Manne, 1964, and Easterbrook and Fischel, 1983). However, case law dating to Schreiber v. Carney (447 A.2d 17, Del. Ch. 1982) in 1982 has considerably narrowed the circumstances where it can be found illegal, and since then (as of 2001), “courts have not struck down a single instance of alleged vote buying.”3 Summarizing the courts’ decisions, Cole (2001) concludes that a vote trade is legal unless 1) the vote-seller gets a legally-enforceable consideration, 2) the consideration is the main reason for how the vote-seller votes, and 3) the seller must cast his vote in a particular way. Since the record-date lender never possesses or casts the vote, it is unclear whether equity loans are at all susceptible to failing this test, but it could be a risk that traders consider. Another regulatory friction is that not everybody can borrow shares in order to be their temporary owner. Regulation T requires non-exempt traders to have a “permitted purpose” to borrow, where a permitted purpose is a short sale or failed delivery (12 CFR 220.10(a), and see also Fabozzi (1997), pp 104-5). An investor hoping to borrow shares to be their temporary owner would have to construct a permitted purpose, for example by shorting to himself. After April 1, 1998 Regulation T became less binding, as broker/dealers servicing large numbers of retail accounts were exempted from this permitted purpose rule.4 In many other markets, such as Canada and the UK, there is no permitted purpose law so evidence of a voting market in the US would strongly suggest that similar markets operate. 3. Cole (2001), p. 798. Under the new amendments to Regulation T on April 1, 1998, a broker/dealer was considered exempt if: 1) the broker/dealer had 1,000 active accounts for persons other than brokers, dealers, or persons associated with a broker/dealer; or 2) the broker/dealer had $10 million in annual gross revenues from transactions with such persons; or 3) The broker/dealer derives 10 percent of its annual gross revenues from transactions with such persons. See http://www.nasdr.com/pdf-text/9843ntm.txt. 4. 5.
(9) elsewhere.. In fact, the practice of vote trading has been publicly acknowledged, at least. anecdotally, in the UK. The two salient cases are British Land, referenced in the press clipping at the top of this paper, and P&O Princess.5 These events have provoked recent deliberation by the Bank of England’s Stock Lending and Repo Committee.6 On the supply side there are very few restrictions on broker/dealers in lending shares, as outlined in the SECs Eleventh Report by the Committee on Government Operations (1991). Brokers can lend any shares purchased on margin under SEC Rule 15c3-3 and they can lend those shares fully purchased by an individual who has not responded to the proxy statement within 15 days. Also, Bethel and Gillan (2002) point out that brokers can vote shares held in street name for routine votes and show these votes tend to support management. A related issue of recent interest is the voting rights of investors whose shares have been loaned without their knowledge or encouragement.. The salient example of this would be. investors holding shares on margin. The SEC Committee on Government Operations, and also Apfel et al (2001), note that the laws on vote allocations are vague in these situations,7 and they also suggest that incentives are weak for brokers to avoid this scenario through loan recalls.8. 5. In the P&O Princess case Mr. Defriez had identified a risk that voting of borrowed stock at an extraordinary general meeting to approve the merger with Carnival under a dual listed company structure could potentially lead to an outcome against the wishes of the long-term shareholders. Also he had reason to believe that some borrowers of P&O Princess stock might be planning to tender it into Carnival’s partial share offer, which is for upto 20% of shares in P&O Princess, potentially crowding out long-term shareholders. (See Footnote 7 for reference) 6 http://www.bankofengland.co.uk/markets/slrcdec02.pdf 7 “However, as indicated above, there is no guidance in the rule [NYSE Rule 452] itself or from the Exchange in any other form as to how a member firm is to handle a situation where it receives proxy voting instructions for more shares than it holds in record ownership. … If we suppose, for example, that a firm has received customer instructions for 10,000 shares than it holds as record owner, then the firm presumably may select for discard all voting instructions, up to a maximum of 10,000, that it finds objectionable. It might specifically select for discard those customer instructions (up to 10,000) that oppose the management’s proposals, or it might specifically select for discard those customer instructions (up to 10,000) that are not compatible with the preferences of a particular favored customer.” SEC (1991), p. 28-29. 8 “Moreover, there is absolutely no incentive for firms to recall loans for this reason. There is no penalty whatever for not having sufficient shares to honor customer voting instructions, and recalling the shares is costly.” Ibid, p. 30.. 6.
(10) Finally, there is an extensive literature that tries to measure the value of a vote by comparing the value of dual class shares with and without voting rights (for example, see Zingales (1994)). This has been a fruitful line of research but as DeAngelo and DeAngelo (1985) observe, the firms issuing dual class shares are by construction firms concerned with ownership and voting rights where one would expect to see a high value associated with the vote. The key to our methodology is that we consider all firms and thus have no such bias.. I.B. The Equity-Loan Market Three features of the equity-loan market are important to our analysis.9 The first is that. equity loans, which settle same-day, transfer ownership of record. Thus, record-date loans redirect votes to whomever winds up with the shares. The second is that borrowers do not reimburse votes to lenders, so the investor who gets them can keep them. The third feature is that equity loans are priced through interest-rebate reductions.. Borrowers provide cash. collateral, and lenders rebate some of the interest they earn on it. For most stocks the rebate rate is the same rate, known as the general collateral rate, but for some stocks the rate is lower. These stocks are said to be on special, and the shortfall of their rebates from the general collateral rate is their specialness. Thus, the relative pricing of equity loans is apparent in their relative specialness. A stock is more expensive to borrow on a given date, such as a voting record date, if and only if its specialness is higher on that date.. 9. For a more thorough description of the equity market, readers are referred to D’Avolio (2002) and Geczy, Musto and Reed (2002).. 7.
(11) II.. Data We combine data from several sources. First, there are two proprietary databases. One,. which we call here the “custodian” database, is the same database used in Reed (2002) and Geczy, Musto and Reed (2002), where it is described in more detail. The database contains the rebate rate, size, start and termination date and a few other statistics of all loans, about a quarter million, of U.S.-listed equities made by a large custodian bank, acting as lending agent for its custodial clients, between November 1998 (11/98) and 10/99.. For our purposes here the. important database-specific facts are that the specialness implicit in a loan is observable only if the data provider considers the loan to be Medium or Large, rather than Small10, and that the rebates are wholesale rates charged to brokers, as opposed to the retail rates the brokers charge their customers. So we do not observe the complete cross section of specialness every day – on the typical day, we observe the specialness of about 3,200 stocks – and what we observe is a lower bound on the cost to the end-user, most representative of the cost to major investors such as large hedge funds. Similarly, it is an upper bound on the revenue accruing to the loaned shares’ beneficial owner. Specialness is quoted as an annual interest rate. For example if the specialness of a stock is 3%, and an investor borrows $1MM worth of it for 5 calendar days, then his specialness cost (with 102% collateral) is (3/100)(5/360)($1MM)(1.02) = $425. The other proprietary database, which we call here the “prime broker” database, contains rebate rates for a larger cross-section of firms, including all firms listed on the Russell 3000, but it does not have quantities loaned. This data comes from a large prime brokerage, and it is the. 10. The specialness implicit in a cash-collateral loan is defined as the GC rate for the loan’s size minus the loan’s rebate rate (annualized), if the loan is Medium or Large. If the loan is Small, it is not used for calculating specialness. For non-cash-collateral loans the specialness is defined as the lending fee minus 20bp. The specialness of a stock on a given day is the value-weighted average of the specialness of all Medium and Large loans of the stock that day. These calculations are identical to those in Geczy, Musto and Reed (2002); see that paper and Reed (2002) for more discussion.. 8.
(12) same data used in Evans, Geczy, Musto and Reed (2003), which describes it in more detail. We use this data ensure that our initial results of price from our one lender are robust on a wider market. We match the proprietary data with publicly available information from the CRSP, Compustat, TAQ, and IRRC (Investor Responsibility Research Center) databases. From CRSP, we gather information on trading volume, shares outstanding, and relative performance compared to other firms in the same two-digit SIC code for the year November 1997- October 1998. From Compustat, we gather bond rating on senior debt as of September 1998 and evaluate this compared to the average for their two-digit SIC code. TAQ provides our measure of asymmetric information, CLSPRD, the average closing spread in October 1998 as a percent of the average bid and ask price on October 30, 1998. The most significant matching is with the IRRC data. First, the results in Figure 2 use a long list of 16,961 pairs of CUSIPs and voting record dates from 11/98 through 10/99. Of these, 6,186 are both in the CRSP data and covered by ten trading days before and after within the sample period. In Tables 1 and 2, however, the sample is trimmed significantly as we look more precisely at the voting outcomes data associated with these record dates. This data consisted of 1,886 firm and record date non-routine proposals of which 1,818 matched with our data. Note that because these proposals are nonroutine, their outcomes do not include broker votes (Bethel and Gillan (2002)). Another 21 observations were removed since the vote either never occurred or was never fully recorded by IRRC. The voting outcomes data includes a basic description of the proposal and an indicator of whether it is a management or shareholder proposal. It also outlines the votes for, against, abstaining, and needed as a percent of either total votes cast or total shares outstanding as dictated in the proxy. We use this data to flag close votes; if the vote. 9.
(13) for proposal i is within 5% (on either side) of the vote necessary, then CLOSEi is 1, and otherwise it is 0. By this rule, 88 of the 1,886 votes are close. It is important to note that the wording of the proxies is such that a vote “for” can be interpreted as a vote in favor of the proposal. IRRC also separately provides a corporate governance index as constructed by Gompers, Ishii, and Metrick (2003). In our matched sample, the index takes on integer values ranging from 2 to 16 where a higher number indicates a weaker corporate governance structure. The data is reduced 1,542 when matched with this indicator. Following Karpoff, Malatesta, and Walkling (1996) we group proposals by their descriptions into three subsets: External, Internal, and Compensation. External proposals refer to the company’s interactions with other companies, such as mergers and acquisitions, poison pills, spin-offs, supermajority provisions and the sale of the firm. Internal proposals relate to the internal operations of the company, such as elections of directors or board members, amendments to governance procedures and changes to voting rights of directors/board members or to committee structure or composition. Compensation proposals are those related to payments to directors or executives, such as adopting a bonus plan or amending a stock option/award/bonus plan, excluding stock option plans for employees in general. The only difference between our classification and that used in Karpoff, Malatesta, and Walkling (1996) is the inclusion of spin-offs and firm sell-offs as external issues. This classification also reflects the factors Pozen (1994) highlights as influencing institutional activism: antitakeover measures, executive compensation, and governance structures. Proposals regarding name changes or changing authorized common stock were classified as “other.”. 10.
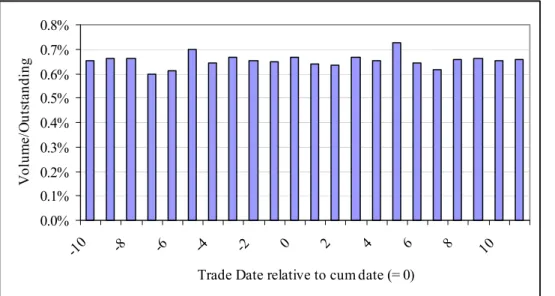
(14) III.. Big Picture on the Markets for votes In this section we address the basic empirical questions: do investors trade votes, and if. so, at what price? We start with the spot market, and then move on to the lending market.. III.A. Trading Votes in the Spot Market The spot market trades economic exposure along with votes, but traders who want just. votes might still transact there. They must pay the spread but the only economic exposure they need to bear is overnight; they could buy at the close of the cum-date and sell at the open of the ex-date. They could further reduce this exposure if they could find counterparties interested in non-standard settlement, as outlined above. We cannot address the question of whether such trades ever occur but we can address whether their incidence is high enough to boost the stock’s trading volume above its prevailing level. Our method is to compare trading volume on the cum-date to the twenty days on either side. To be consistent with the lending results below, our sample is all cum-dates in the IRRC data from 11/11/98 to 10/12/99 (this way, the settlement dates for trades 10 days before or after fall between 11/01/98 and 10/31/99, our custodian-data sample period). This yields 6186 record dates. For every record date i, let Vi,t be the relevant stock’s percentage trading volume on date t, where date 0 is defined as the cum-vote date, i.e., 3 trading days before the record date, and percentage trading volume is shares traded divided by shares outstanding. For every t we average Vi,t across i; the result is presented as Figure 1. Figure 1 shows no sign of a relation between trading volume and voting rights. The average is 0.65% across all 21 days, and is 0.66% on the cum-vote date and 0.64% on the ex-. 11.
(15) vote date. We cannot rule out that some traders find the spot market economical for exchanging votes but the incidence of such exchanges must be small.. III.B. Trading Votes in the Lending Market We can easily change venue to the lending market by repeating the above procedure on. the same 6186 record dates, replacing percentage trading volume in the spot market with percentage lending-volume by our custodian-data provider, while offsetting three days to align the markets. That is, we replace Vi,t with Li,t, the number of shares loaned by the custodian, divided by shares outstanding, on trading date t, where date 0 is now the record date, not the cum-date. We again average across i for each t, and the result is in Figure 2. The connection between voting and lending is clear and strong. Loans that convey votes are in much greater quantity than loans in general; loaned shares spike from 0.21% on average to 0.26% on the record date, a difference that is far beyond the prevailing volatility. Because each loan separates votes from economic exposure, one might have expected less lending on record dates, because this moves corporate control toward one-share-one-vote. But we find more lending, moving control away from one-share-one-vote. So the lending market does in fact host a voting market.. III.C. The Price of a Vote What price do the borrowers pay for the votes? We can find out by replacing loan. quantity L with loan pricing P, which as discussed above is in units of specialness. We let Pi,t be the average specialness of the loans that comprise Li,t, and analogously to before we take the average of Pi,t across i for each t and plot the time series. This is somewhat noisy, compared to. 12.
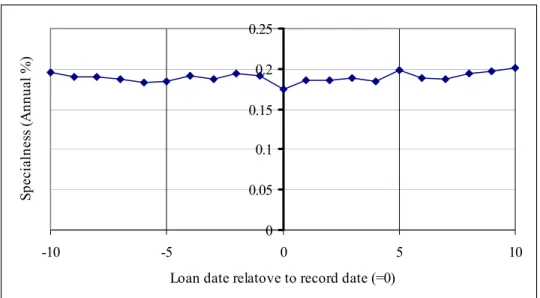
(16) the time series above, because some stocks loan on some of the days but not others, so the sample changes slightly as t goes from -10 to 10. The result is in Figure 3. The figure shows no price increase at all, but because the comparison across t is not exactly apples-to-apples, it is worth constructing a comparison that is. We identify all the record dates such that we observe specialness on the record date and on at least one of the twenty surrounding dates. There are 2019 such dates. For each record date we then subtract the average non-record-date specialness from the record-date specialness, and find the average difference to be 0.6bp. That is, the extra cost of borrowing a share when it conveys a vote, compared to when it does not, is a 0.6bp decrease in the interest received on the collateral used to borrow the share. The standard error of the 0.6bp is 0.4bp, so it is not significantly greater than zero, and we can reject that the true difference is greater than 2bp, which itself would be trivial (note that these are annualized rates, so a 2bp interest-rate reduction for one day implies $0.56 less income on $1MM of collateral). One possible objection to this test is that the firms our data provider loans may be biased toward firms whose votes are less interesting. For example, GMR show that this database often does not include merger acquirers. To address this concern we repeat the test on a different database with no possibility of sample bias. This is the prime-broker data described above, which is unbiased because it gives the specialness every day for all the 3000 largest U.S. stocks, whether or not the stocks actually loan out. We repeat the procedure above with the Pi,t from the custodian database replaced by the Pi,t from the prime-broker database. The result is in Figure 4. The prime broker data show the result to be robust. The average vote can be had for nothing, or more precisely, for the usual price of shorting the relevant stock. Specifically, the average specialness is 14.5 bp on the record date and 13.7bp on the other dates, so the difference. 13.
(17) is 0.8bp and it is not statistically or economically significantly different from zero.11 From this we conclude that lenders are yielding, rather than selling, their votes. Since this can only make the lenders worse off if they already know how to vote in their interests, we further hypothesize that the voting market is driven by asymmetry of information. In the next section we take this hypothesis to the cross section of vote transactions.. IV.. Cross Section of the Market for Votes The results of the previous section are a puzzle. Why would someone give away his. votes? We hypothesize that he does not know how to vote, and gives the decision away on the hope that the recipient both shares his preferences and knows how to vote them. The goal of this section is to test this hypothesis on the cross section of vote lending. The first subject of the tests is asymmetric information. If asymmetric information is indeed the motive for lending, then lending should increase as asymmetry of information about the firm increases.. This is a. relatively straightforward test since a firm’s bid/ask spread is widely accepted as a proxy for asymmetry of information about the firm. The next set of tests addresses the relative gravity of the votes. There is little motive to lend trivial votes; the market is presumably driven by the important votes. Thus, lending reflects asymmetry of information, it should grow as the vote grows more important. By contrast, if shareholders were symmetrically informed, we would expect lending to shrink as importance grows: borrowers would have no information to add, and might have different preferences, so the risk would be all downside and would be larger for more important votes.. 11. Interestingly, when we split out the firms concurrently involved in merger attempts, we find that record-date specialness is actually lower by 3bp, though this is also not statistically different from zero.. 14.
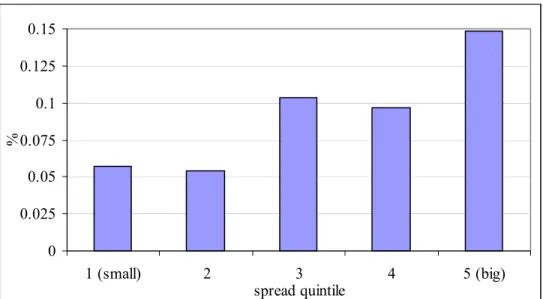
(18) To take this hypothesis to the cross section of votes, we need measures of their relative importance. Relative importance could reflect the significance of the issue at stake, and it could also reflect the probability that a given vote will be pivotal. Proxying for this probability is straightforward, because we can, for the larger firms whose outcomes are reported by the IRRC, simply look at how close the vote turned out to be. Proxying for the relative importance of proposals is trickier because the literature provides little guidance as to which proposals are more important. The existing theory on vote trading, Harris and Raviv (1988) and Blair, Golbe and Gerard (1989), focuses on managerial performance, so we proxy for performance, in two ways: stock return, relative to industry, and bond rating, relative to industry. This gives us one proxy keyed to market prices, and one keyed to accounting data.. As performance decreases, the importance of the firm’s proposals should. increase and so, by the hypothesis, should the transfer of votes. Throughout this section we take vote lending to be excess record date lending, defined in accordance with the previous section as the loan volume on the record date minus the average loan volume on the twenty surrounding days. We look at this, rather than simply the record-date loan volume, because loan volume varies from firm to firm with the level of short-selling of the firm, and since the level of short selling could correlate with some of our proxies, such as stock return, we would run a serious risk of misattribution if we did not net out the prevailing level of short-selling of the firm.. III.A. Relation to Asymmetric Information and Importance of the Vote Since a firm’s bid/ask spread is generally viewed as a product of asymmetric information. about the firm – in particular, the incidence of trading by investors who know more about the. 15.
(19) firm than the market maker knows (Bagehot, 1970, Glosten and Milgrom, 1985, etc.) – it is the natural proxy for the uneven distribution of information about the firm. Because outside factors could simultaneously affect both spreads and lending, we avoid confusion by measuring spreads over a sample period that predates our loan data. Specifically, we take a firm’s spread to be its average closing spread during October 1998 (the month prior to our sample period) divided by its October 1998 close, i.e., the midpoint of its closing bid and ask on October 30, 1998. Since our data on closing bids and asks covers NYSE only, all results with spreads are NYSE-only. To gauge the relation between spreads and lending, we first sort all stocks into spreadquintiles, with the lowest-spread stocks in quintile 1.. We then calculate the average excess. record-date lending for each quintile, and plot the result as Figure 5. The relation in Figure 5 is strong in the predicted direction. Vote transfers climb as asymmetry of information increases. To establish the statistical significance of the relation, we regress excess record-date lending, denoted by XLOANi for record date i, on spreads, denoted by CLSPRDi, and test whether the slope is significantly positive. The fitted model, labeled REG1 in Panel A of Table I, shows that the slope is positive with a t-statistic of 2.44, so the relation is indeed significantly positive.. This supports one dimension of our hypothesis that the. maldistribution of information is an important incentive to yield votes. The other dimension is the importance of the vote. We approach this at two levels: the importance of the proposal, and the probability that a given share’s vote will be pivotal. For the importance of the proposal we have two proxies, one for market performance and the other for accounting performance, and for vote closeness we look at the actual closeness of the vote, as revealed at the meeting. We have outcomes for 1,886 proposals so this is the universe we start with for these tests.. 16.
(20) We take proposal i to be close, and thus set CLOSEi to 1, if the vote for the proposal was within 5% of the vote needed for passage. Otherwise, CLOSEi is 0. For proposal i, UPERFi is 1 if the total return of the associated stock from 11/97 to 10/98 (i.e. the year just before our sample period) is less than return of its industry (i.e. the equal-weighted average return of all stocks with the same two-digit SIC code), and 0 otherwise. We have UPERF observations for 1,734 of the 1,886 proposals. From Compustat we take the long-term senior bond rating from the most recent fiscal quarter-end as of 9/98; if this is below the median for the company’s industry then the relative rating URATEi is 1, and otherwise it is zero. This statistic is available for 848 of the 1,886 proposals. So both UPERF and URATE indicate lagging firms, the former by reference to stock performance and the latter by reference to bond ratings, which are generally associated with accounting ratios. The question is whether CLOSE, UPERF and URATE relate positively to vote-driven borrowing, and we address this question with dummy-variable regressions where the dependent variable is again XLOAN. We first run simple regressions on the three explanatory variables separately, then we run multiple regressions that interact CLOSE with UPERF, and then with URATE. The multiple regressions allow the effect of a close vote to be different for lagging vs. leading firms. Results are collected in Panel A of Table I. The simple regressions show, by either the stock-price or bond-rating measure, significantly more vote reallocations for lagging firms.. Closeness is not significant. unconditionally, but it is for votes of less creditworthy firms, and at lower significance, lowerreturn firms. At the point of means, the effect on vote-borrowing for proposals of lagging firms is large, from 0.12% to 0.20% for firms with lagging stock returns, and from 0.16% to 0.28% for firms with lagging default risk. Therefore, the data support both dimensions of the hypothesis.. 17.
(21) The remaining question is whether asymmetric information and firm performance are significant conditional on each other, which we can resolve by including both in one regression. What we find, in regressions 4 and 5 in Panel A of Table I, is that URATE and UPERF enter significantly in the presence of CLSPRD, and that CLSPRD enters insignificantly when the other variable is UPERF and significantly when it is URATE. So the evidence is mixed on the significance of asymmetric information, conditional on firm performance, but strong on the influence of firm performance on vote lending.. III.B. Relation to the Proposal and Firm Governance Does vote trading reflect what the vote is about, or who proposed it? The chronology is. potentially important here. Traders must decide whether to borrow or lend votes before the relevant proposals are publicized, because the record date precedes the distribution of proxies. So the content of the proposals can affect the decision to borrow or lend only if it is somehow predictable, or privately known by some traders, as of the record date. In this section we address the influence of proposals on vote lending by relating vote-lending first to the content of the proposals, as revealed later in proxies, and then to information that is relevant to proposals, and that was definitely available to all investors on the record date. The major categories of proposals, considering the extensive literature analyzing shareholder proposals separately from management proposals (e.g., Gordon and Pound, 1993, Karpoff, Malatesta and Walkling, 1996, Wahal, 1996, Gillan and Starks, 2000) is into shareholder proposals on the one hand, and management proposals on the other. So all proposals are first sorted by their proposers into one group of 212 shareholder proposals, and another of 1575 management proposals.. We then subdivide these groups into external, internal and. 18.
(22) compensation proposals, as described in Section II, and we flag them with the indicator variables EXTERN, INTERN and COMP. Proposals that do not fall into exactly one category score zero on all three and so are captured by the intercept. We run one regression of XLOAN on EXTERN, INTERN and COMP for shareholder proposals and one for management proposals, and we report the results as REG1 on the left and right sides, respectively, of Panel B, Table I. The regressions turn up just one statistically significant relation: when management proposes a change in compensation, more votes change hands. This is intuitive, since such proposals would intuitively be salient, though we cannot tell if traders knew on the record date that this issue would come up. What voters can know, on the record date, is the firm’s current state of corporate governance. This is a likely influence on the content of upcoming proposals, so our empirical question is whether it influences the vote trade. One way to find out is to relate XLOAN to a corporate-governance index. The index of Gompers, Ishii and Metrick (2003) is useful for this purpose because it reduces a firm’s array of provisions to one number, where a higher number indicates that a firm’s provisions are less shareholder-friendly, or in other words, that management is more entrenched.. Since shareholder proposals are more important when. management is more entrenched, and therefore more insulated from other forms of discipline, our hypothesis predicts a positive relation between this index and XLOAN among these proposals. Among management proposals the prediction is less clear, since it is unclear how entrenchment should affect the importance of proposals that management chooses to put to a vote.. In recent work, however, Weber, Joos and Balachandran (2003) find that “poorly-. governed firms are more likely to adopt equity-based compensation plans without shareholder. 19.
(23) approval,”12 and conclude that in general, management avoidance of putting decisions to vote grows as governance worsens. Though their measure of governance differs from the index we use, this suggests that the importance of management proposals, and therefore the reallocation of votes, should decline as the index increases. We determine the relation of vote trading to managerial entrenchment by first defining CGINDEXi to be the Gompers, Ishii, and Metrick (2003) measure of corporate governance for the firm associated with proposal i. For management and shareholder proposals separately we first regress XLOAN on CGINDEX alone, and then we add in the category indicators. Results are labeled REG 2 and REG 3, respectively, in Panel B of Table I. Entrenchment enters every time, and indeed, reallocation of votes for shareholder proposals goes up and reallocation for management proposals goes down as entrenchment increases. There is still a separate effect of management proposals regarding compensation, though at the 10% significance level.. III.C. How abnormal lending influences the voting outcome The economically important consequence of vote borrowing is its effect on outcomes.. We do not directly observe how the borrowed votes are cast, but we can observe how the variation in borrowed votes relates to the variation in outcomes. To this end we define FORi and AGAINSTi to be the percentage vote for and against proposal i and we regress it first on just XLOAN, and then to allow the relation to differ across categories, we regress it on the category indicators and XLOANi interacted with the category indicators, and also with the dummy OTHER which indicates proposals that do not fall in the three categories. There are two regressions for shareholder proposals and four for management proposals; results are in Table II. Note we do not 12. The quote is from the abstract of Weber, Joos and Balachandran (2003).. 20.
(24) include regressions of AGAINST on XLOAN for shareholder proposals since in this case all votes are out of votes cast and there are no abstentions so AGAINST=100-FOR. Lending, we find, corresponds to support for shareholder proposals and opposition to management proposals. In the shareholder-proposal multiple regression, three of four proposal types interacted with XLOAN come in positive, with external proposals showing a statistically significant relation. In the management-proposal multiple regression with FOR as the dependent variable, both compensation proposals and internal proposals enter negatively, with internal proposals entering significantly. Among management proposals, the significant relation is again to opposition. When the dependent variable is AGAINST, three of four interaction variables enter positively with both internal and compensation entering significantly. To close the loop with our earlier results in Panel B of Table I, we first found more lending associated with management proposals regarding compensation, and now we find evidence that these loans vote against the proposal. These results associate vote-borrowing with a particular side of the vote, the positive side for proposals by shareholders, and the negative for proposals by management. This is the opposite side of the vote from that associated with broker votes in Bethel and Gillan (2002), who argue that brokers may have ulterior motives for siding with management. We argue that uncertain voters allow their votes to be borrowed, taking the chance that the borrowers’ preferences are aligned with their own. We cannot know whether the lenders would have voted this way if they knew everything, but we find reason for them to believe that their borrowers are at least not aligned with management. Does the support and opposition translate to victory and defeat? For a final test, we define SHRWIN as the 1 if shareholders win a vote and we regress this on XLOAN and proposal types. Shareholders are presumed to win if a shareholder proposal wins or a management. 21.
(25) proposal loses. In our sample, about 3.7% of the observations are shareholder wins, but this differs vastly between management and shareholder proposals; shareholders win only 2% of management proposals, compared to 17% of shareholder proposals. Because SHRWIN is a dummy variable, the last three columns of Table II are executed using probit analysis. For both shareholder proposals and management proposals, vote reallocations significantly (with p-values of 5.1% and 5.3% respectively) increase the probability of a shareholder win. In the big probit model in the last column, we find that the interaction terms between excess lending and vote proposals are generally positive and weakly significant. These findings suggest an important role in the reallocation of voting power that the vote market allows.. V.. Summary and Conclusion A market for votes is not necessarily a good thing, but we argue that it addresses an. important problem. In the model of Harris and Raviv (1988), a company maximizes its own value but does not maximize society’s value when it floats its shares separately from its cash flows. We find that votes float separately from shares whether companies want this or not, but this may do more good than harm because it helps cure an inefficiency that is abstracted from in Harris and Raviv (1988) and related work. The vote market cures the inefficiency arising from votes being distributed differently from information about how to vote them. Transactions in votes can move shares to investors more willing and able to vote them properly. Of course, they can move votes to any hands at all and in principle could hinder governance, but the evidence here associates vote transfers with less support for incumbent management, which alleviates this concern.. 22.
(26) We argue that the lending market is the efficient venue for trading votes, and while we find no evidence of vote-trading in the spot market, we find clear evidence of it in the lending market. The price of these loans is the price charged for the votes, so it is intriguing that the price is zero. Investors are yielding their votes, not selling them, so it follows that information asymmetry is the cause. They would be better off voting in their interest if they knew how, so logically they don’t know how. We find more evidence for this view in the cross section of record dates: as information about the firm grows more asymmetric, and as the vote grows more important, so does the quantity of reallocated votes. Because this quantity corresponds to support for shareholder proposals and opposition to management proposals, it does not appear that management or its allies use this market to subvert governance. The U.S. market for votes operates in spite of regulation designed to frustrate it. Other major economies do not impose such regulation, so it stands to reason that their markets for votes are more robust, and consequently, the ratios of votes to shares that their issuers choose have even less to do with the ratios their investors experience. It could be that the benefits Grossman and Hart (1988) and Harris and Raviv (1988) identify for one-share-one-vote are thus not attainable, but it could also be that society is better off with votes reallocating to investors who know what they’re doing.. 23.
(27) References Apfel, Robert C., John E. Parsons, G. William Schwert and Geoffrey S. Stewart, 2001, Short sales, damages and class certification in 10b-5 actions, NBER Working Paper 8618. Bethel, Jennifer E., and Stuart L. Gillan, 2002, The impact of the institutional and regulatory environment on shareholder voting, Financial Management Journal, 31(4), 29-54. Blair, Douglas H., Devra L. Golbe, James Gerard, 1989, Unbundling the voting rights and profit claims of common shares, Journal of Political Economy, 97(2), 420-443. Christoffersen, Susan, Chris Geczy, David Musto and Adam Reed, 2003, The limits to dividend arbitrage: implications for cross-border investment. Working Paper, McGill, Wharton and UNC. Cole, Douglas R., 2001, E-proxies for sale? Washington Law Review 76, 793-858.. Corporate vote-buying in the internet age.. D’Avolio, Gene, 2002, The market for borrowing stock, Journal of Financial Economics, 66(23), 271-306. DeAngelo, Harry, and Linda DeAngelo, 1985, Managerial ownership of voting rights: A study of public corporations with dual classes of common stock, Journal of Financial Economics 14, 3369. Duffie, Darrell, Nicolae Garleanu and Lasse Heje Pedersen, 2001, Securities Lending, Shorting and Pricing, Journal of Financial Economics, 66(2-3), 307-339. Easterbrook, Frank H. and Daniel R. Fischel, 1983, Voting in corporate law, Journal of Law and Economics, 26, 375-390. Evans, Richard, Chris Geczy, David K. Musto and Adam V. Reed, 2002, Impediments to Short Selling and Option Prices, Wharton School and University of North Carolina Working Paper. Fabozzi , Frank J. (ed), 1997, Securities Lending and Repurchase Agreements, Frank J. Fabozzi Associates, New Hope PA. Feddersen, Timothy and Wolfgang Pesendorfer, 1996, The Swing Voter’s Curse, American Economic Review, 86(3), p. 408-424. Geczy, Chris, David K. Musto, and Adam V. Reed, 2002, Stocks are special too: An analysis of the equity lending market, Journal of Financial Economics, 66(2-3), 241-269. Gillan, Stuart L. and Laura T. Starks, 2000, Corporate Governance Proposals and Shareholder Activism: The Role of Institutional Investors, Journal of Financial Economics, 57(2), 275-305.. 24.
(28) Glosten, Lawrence and Paul R. Milgrom, 1985, Bid, Ask and Transaction Prices in a Specialist Market with Hetergeneously Informed Traders,” Journal of Financial Economics, 14(1), 71-100. Gompers, Paul, Joy Ishii, and Andrew Metrick, 2003, Corporate governance and equity prices, Quarterly Journal of Economics, 118(1), p. 107-155. Gordon, Lilli A. and John Pound, 1993, Information, ownership structure, and shareholder voting: Evidence from shareholder sponsored corporate governance proposals, Journal of Finance, 48, 697-718. Grossman, Sanford J., and Oliver D. Hart, 1980, Takeover bids, the free-rider problem and the theory of the corporation, Bell Journal of Economics 11, 42-64. Harris, Milton and Artur Raviv, 1988, Corporate governance: voting rights and majority rules, Journal of Financial Economics, 20, p. 203-235. Karpoff, Jonathon M., Paul H. Malatesta, and Ralph A. Walkling, 1996, Corporate governance and shareholder initiatives: Empirical evidence, Journal of Financial Economics, 42, 364-395. Manne, Henry G., 1964, Some theoretical aspects of share voting, Columbia Law Review, 64, 1427-1445. Maug, Ernst, 1998, Large Shareholders as Monitors: Is there a trade-off between liquidity and control? Journal of Finance, 53(1), p. 65-98. Maug, Ernst, How effective is proxy voting? Information aggregation and conflict resolution in corporate voting contests, Working Paper, Humboldt University. Maug, Ernst and Kristian Rydqvist, 2001, What is the function of the shareholder meeting? Evidence from the US proxy voting process, Working Paper. Neeman, Zvika and Gerhard O. Orosel, Corporate vote-trading as an instrument of corporate governance, Working Paper, Boston University. Pozen, Robert C., 1994, Institutional investors: The reluctant activists, Harvard Business Review, Jan-Feb, 140-149. Securities and Exchange Commission, 1991, Short-selling activity in the stock market: Market effects and the need for regulation (Part 1), Eleventh Report by the Committee on Government Operations, Dec. 6, House Report 102-414, 102 Congress First Session. Shleifer, Andrei, and Robert W. Vishny, 1986, Large shareholders and corporate control, Journal of Political Economy 94, 461-488. Wahal, Sunil, 1996, Public pension fund activism and firm performance, Journal of Financial and Quantitative Analysis 31, 1-23.. 25.
(29) Weber, Joseph, Peter R. Joos and Sudhakar V. Balachandran, 2003, Do voting rights matter: Evidence from the adoption of equity-based compensation plans. MIT Sloan School of Management Working Paper 4442-03. Young, Philip J. and James A. Millar and G. William Glezen, 1993, Trading volume, management solutions, and shareholder voting, Journal of Financial Economics, 33, p. 57-71. Zingales, Luigi, 1995, What determines the value of corporate votes? Quarterly Journal of Economics, 110(4), p. 1047-1073. Zingales, Luigi, 1994, The value of the voting right: A study of the Milan stock exchange experience, Review of Financial Studies, 7(1), p. 125-148.. 26.
(30) 0.8% Volume/Outstanding. 0.7% 0.6% 0.5% 0.4% 0.3% 0.2% 0.1%. 10. 8. 6. 4. 2. 0. -2. -4. -6. -8. -1 0. 0.0%. Trade Date relative to cum date (= 0). Figure 1. Spot-Market Volume around cum-vote date. Trade date (where cum-vote date is 0) is on the horizontal axis, and trading volume divided by shares outstanding is on the vertical axis. Sample is all 6186 cumdates of CRSP stocks from 11/11/98 to 10/12/99.. 0.30%. Loaned/Outstanding. 0.25% 0.20% 0.15% 0.10% 0.05% 0.00% -10 -9 -8 -7 -6 -5 -4 -3 -2 -1. 0. 1. 2. 3. 4. 5. 6. 7. 8. 9 10. Loan Date relative to record date (= 0). Figure 2. Loan-Market Volume around voting record date. Loan date (where record date is 0) is on the horizontal axis, and shares loaned by our data provider, divided by shares outstanding, is on the vertical axis. Sample is all 6186 record dates of CRSP stocks from 11/16/98 to 10/15/99.. 27.
(31) Specialness (Annual %). 0.25 0.2 0.15 0.1 0.05 0 -10. -5. 0. 5. 10. Loan date relatove to record date (=0). Figure 3. Loan Pricing around voting record date; Custodian Bank data. Loan date (where record date is 0) is on the horizontal axis, and specialness of loans by our data provider is on the vertical axis. The average for a given date is across those stocks with loans outstanding on that date. Sample is all 6186 record dates of CRSP stocks from 11/16/98 to 10/15/99.. Specialness (Annual %). 0.2. 0.15. 0.1. 0.05. 0 -10. -5. 0. 5. 10. Loan date relative to record date (=0). Figure 4. Loan Pricing around voting record date; Prime Broker data. Loan date (where record date is 0) is on the horizontal axis, and specialness charged by the prime broker is on the vertical axis. The average is across the same panel on each date. Sample is all 2908 record dates of Russell-3000 stocks from 11/16/98 to 10/15/99.. 28.
(32) 0.15 0.125 0.1 %. 0.075 0.05 0.025 0 1 (small). 2. 3 spread quintile. 4. 5 (big). Figure 5. Excess Record-Date Lending, sorted by trading spread. The 6186 record dates are sorted by the percentage bid/ask spread in October 1998. Spread quintiles are on the horizontal axis and the average excessrecord date lending for the quintile is on the horizontal axis.. 29.
(33) Table I Dependent Variable is Excess Vote-Day Loan Volume The sample is all nonroutine proposals of large firms, as defined and collected by the Investor Responsibility Research Center, such that there are 10 trading days before and after the record date of the proposal within the period 11/1/98 through 10/31/99. In each regression the dependent variable is XLOAN, defined as the number of shares loaned on the record date of a proposal minus the average number of shares loaned over the ten trading days before and the ten trading days after, divided by the number of shares of the firm outstanding, and multiplied by 100 (i.e. in percentage terms). CLSPRD is the average closing spread (in percent of average bid and offer price) for the stock in October 1998. UPERF is 1 if the firm’s total stock return for the year ending 10/31/98 was below the average total return of stocks with the same two-digit SIC code, and is 0 otherwise. URATE is 1 if the firm’s longterm senior bond rating, as of 9/30/98, was below the median rating for firms with the same two-digit SIC code. CLOSE is 1 if the vote for the proposal was within 5% of the vote required for passage, and is 0 otherwise. EXTERNAL, INTERNAL and COMP are 1 if the proposal is an External, Internal or Compensation issue (as defined in the text), respectively, and are 0 otherwise. CGINDEX is the corporate governance index where a larger value indicates a weakening of corporate governance as defined by Gompers, Ishii, and Metrick (2003). T-statistics are below, in italics. Panel A REG 1 REG 2 REG 3 REG 4 REG 5 REG 6 REG 7 REG 8 Intercept CLSPRD. 0.067 5.52 1.86 2.44**. UPERF. 0.073 9.73. 0.08 7.94. 0.05 3.83**. URATE. 0.067 5.56 0.636 0.75 0.056 3.13**. 0.082 4.15**. 0.057 3.50 2.56 2.01**. 0.072 9.45. 0.073 9.56. 0.049 3.79**. 0.045 3.38**. 0.123 4.97**. CLOSE. 0.031 1.04. UPERF*CLOSE. -0.0047 -0.12 0.0888 1.45*. URATE*CLOSE. Observations Panel B. Intercept External Internal Compensation. 0.0727 3.60** -0.074 -1.57. 0.1976 2.10** 1168. 1734. 848. 1141. 710. 1734. 1734. Shareholder Proposal REG 1 REG 2 REG 3. Management Proposal REG 1 REG 2 REG 3. 0.0818 1.69 0.0502 0.92 -0.030 -0.60 -0.039 -0.74. 0.069 5.45 -0.83 0.406 -0.003 -0.08 0.035 2.34**. 0.0129 3.95**. -0.089 -1.66 0.089 1.69* 0.034 0.72 0.036 0.73 0.011 3.41**. 209. 209. 1575. CG Index. Observations ** 5% significance * 10% significant. 0.0833 8.10. 212. -0.061 -1.93. 30. 0.144 6.37. -0.0068 -2.74**. 0.130 5.22 0.005 0.14 -0.004 -0.09 0.024 1.52* -0.007 -2.79**. 1333. 1333. 848.
(34) Table II Votes For and Against and Voting Outcomes of Proposals The sample is all nonroutine proposals of large firms, as defined and collected by the Investor Responsibility Research Center, such that there are 10 trading days before and after the record date of the proposal within the period 11/1/98 through 10/31/99. In the first four columns, the dependent variable is FOR, defined as the percentage of votes for the proposal. In the fifth and sixth columns, the dependent variable is AGAINST, defined as the percentage of votes against the proposal. The dependent variable in the last three columns is a dummy variable indicating if a shareholder has won a proposal, SHRWIN, defined as 1 if votes FOR are greater than votes NEEDED in a shareholder proposal (SP) and votes FOR are less than votes NEEDED in a management proposal (MP). XLOAN is defined as the number of shares loaned on the record date of a proposal minus the average number of shares loaned over the ten trading days before and the ten trading days after, divided by the number of shares of the firm outstanding, and multiplied by 100 (i.e. in percentage terms). EXTERNAL, INTERNAL and COMP are 1 if the proposal is an External, Internal or Compensation issue (as defined in the text), respectively, and are 0 otherwise. There are also three interaction variables included which multiply EXTERNAL, INTERNAL and COMP by XLOAN. The last three columns are estimated using probit analysis. T-statistics are below, in italics. DepVar FOR SP Intercept XLOAN. 27.39 17.60 26.13** 2.70. External Internal Compensation Ext*XLOAN Int*XLOAN Comp*XLOAN Other*XLOAN Observations 212 ** is significant at the 5% level * is significant at the 10% level.. 11.16 1.72. 24.16** 3.29 23.69** 3.51 -0.57 -0.08 29.76** 2.43 -7.46 -0.48 39.99 1.45 36.13 1.25 212. DepVar FOR MP 82.39 218.67 -1.03 -0.77. 1575. 83.23 121.62. -0.63 -0.33 -9.74** -4.81 -0.75 -0.90 4.20 0.66 -14.82** -2.70 -2.07 -1.26 3.90 1.49 1575. 31. DepVar AGAINST MP 12.66 36.71 3.74** 3.07. 1575. 7.07 11.93. -4.07** -2.49 3.07* 1.75 9.06** 12.55 -0.25 -0.05 9.92** 2.09 2.78** 1.96 0.57 0.25 1575. SP. DepVar SHRWIN MP All. -1.05 -9.14 1.20* 1.95. 212. -2.11 -26.15 0.43* 1.94. 1575. -1.97 -15.09. 0.89** 4.23 0.96** 5.39 -0.47** -2.50 0.79 1.43 1.03* 1.85 0.60* 1.91 -0.12 -0.21 1787.
(35)
Figure

Documents relatifs
monday tuesday wednesday. thursday
Data related to the total number of voting rights and shares comprising the share capital Corporate name: AFFINE ISIN Code FR 0000036105.. Date of
Data related to the total number of voting rights and shares comprising the share capital Corporate name: AFFINE ISIN Code FR 0000036105.. Date of
Data related to the total number of voting rights and shares comprising the share capital Corporate name: AFFINE ISIN Code FR 0000036105.. Date of
Data related to the total number of voting rights and shares comprising the share capital Corporate name: AFFINE ISIN Code FR 0000036105.. Date of
Data related to the total number of voting rights and shares comprising the share capital Corporate name: AFFINE ISIN Code FR 0000036105.. Date of
Data related to the total number of voting rights and shares comprising the share capital Corporate name: AFFINE ISIN Code FR 0000036105.. Date of
Data related to the total number of voting rights and shares comprising the share capital Corporate name: AFFINE ISIN Code FR 0000036105.. Date of
