Lefebvre : Université du Québec à Montréal (UQAM) and Inter-university Centre on Risk, Economic Policies and Employment (CIRPEE). Address for correspondence : Pierre Lefebvre, Economics, UQAM, CP 8888, Succ. Centre-Ville, Montréal, QC, Canada H3C 3P8; Tel.: 514-987-3000 #8373; Fax: 514-987-8494
lefebvre.pierre@uqam.ca
Merrigan: UQAM and CIRPEE Verstraete: UQAM
The analysis is based on Statistics Canada’s Survey on Labour and Income Dynamic (SLID) restricted-access Micro Data Files, which contain anonymized data collected in the SLID and are available at the Québec Inter-university Centre for Social Statistics (QICSS), one of the Canadian Research Data Center network. All computations on these micro-data were prepared by the authors who assume the responsibility for the use and interpretation of these data. This research was funded by the Social Sciences and Humanities Research Council of Canada and the Fonds québécois de la recherche sur la société et la culture. We would like to thank participants at the Annual Symposium of the Population, Work and Family Research Collaboration (Gatineau, December 2006), ESPE Conference (Chicago, June 2007), SCSE (Québec, June 2007) EALE Conference (Oslo, September 2007).
Cahier de recherche/Working Paper 08-24
Dynamic Labour Supply Effects of Childcare Subsidies: Evidence from a Canadian Natural Experiment on Low-Fee Universal Child Care
Pierre Lefebvre Philip Merrigan Matthieu Verstraete
Abstract:
This paper shows that a temporary incentive to join the labor market or to work more can also produce substantial life-cycle labor supply effects. On September 1997, a new childcare policy was initiated by the provincial government of Québec, the second most populous province in Canada. Licensed and regulated providers of childcare services began offering day care spaces at the subsidized fee of $5 per day per child for children aged 4. In successive years, the government reduced the age requirement, created new childcare facilities and spaces, and paid for the additional costs entailed by this low-fee policy. No such important policy changes for preschool (including kindergarten) children were enacted in the nine other Canadian provinces over the years 1997 to 2004. Using annual data drawn from Statistics Canada’s Survey on Labour and Income Dynamic and a difference-in-differences quasi-experimental methodology, the paper estimates the dynamic labor supply effects of the program. The results demonstrate that the policy had long-term labor supply effects on mothers who benefited from the program when their child was less than 6. A striking feature of the results is that they are driven by changes in the labor supply of less educated mothers.
Keywords: Mother’s labour supply, preschool and primary school children, childcare
policy, treatment effects, natural experiment
1. Introduction
On September 1 1997, a new childcare policy was initiated by the provincial government of Québec, the second most populous province in Canada. Childcare service providers licensed by the Department of the Family began offering day care spaces at the reduced parental fee of $5 per day per child for children aged 4 (all monetary amounts are expressed in Canadian dollars). In successive years, the government reduced the age requirement and by September 2000, the low-fee policy applied to all children aged 0 to 59 months (not eligible for kindergarten). The government also promised to progressively increase the number of subsidized $5 per day spaces, targeting a number of 200,000 for 2007. The number of subsidized spaces increased from 74,000 partially subsidized spaces (available in early 1997) to 198,000 spaces, totally subsidized, by March 2007. Families’ childcare arrangements changed dramatically over time as the policy favored regulated subsidized center-based care (as well as family-based care under the supervision of subsidized not-for-profit centers). This new childcare regime was integrated with a policy of full-time instead of half-day publicly-provided kindergarten in a school setting and with $5 per day before- and after-school day care for kindergarten-age and grade-school children. Since January 12004, the fee per day has been fixed at $7 rather than $5 for both type of childcare services (preschool and those offered within public schools).
Lefebvre and Merrigan (2008), with annual data from 1993 to 2002 drawn from Statistics Canada’s Survey of Labour and Income Dynamics (SLID) and a difference-in-differences (DD) approach, estimate a substantial effect of the policy on a diversity of labour supply indicators (participation, annual weeks and hours worked, and earned income) for a sample of Canadian mothers with 1 to 5-year-olds children. The estimated effect of the policy on the participation of mothers with preschool children in Québec for year 2002 is 8.1 percentage points (the observed participation rate is 69 percent in 2002). In addition, Baker et al. (2005) using the first two cycles
(1994 and 1996) and the last two cycles (2000 and 2002) from Statistics Canada’s National Longitudinal Survey of Children and Youth (NLSCY), analyze the impact of Québec’s childcare policy on childcare use, maternal work (mothers in two-parent families only), and diverse behavioral outcomes measuring the “well-being” of both children (0 to 4-year-olds or sub-samples of those children) and parents. They also produce estimates showing substantial labour supply effects of the policy. This unexpected low-fee policy changed substantially the labour supply of mothers with preschool children.
The identification of dynamic or life-cycle mechanisms explaining labour supply choices are often plagued by simultaneity problems. In this paper, we use this Canadian “natural experiment” to overcome simultaneity issues and test the hypothesis that childcare subsidies incentives can also cause changes in the labour supply of mothers when the policy is no longer contemporaneously effective, that is when all the mother’s children are in school. There are several dynamic mechanisms that can explain why childcare subsidies can have lasting effects on labour supply. For example, the subsidy, by increasing labour force experience when the child is young, has positive effects on future wages which can further increase labour supply. A more precise description of these life-cycle mechanisms will be made in section 4. The identification strategy is based on the fact that several cohorts of mothers affected by the program no longer have children aged from 0 to 5 in their household and no longer benefit from the childcare subsidies directed to preschool children. Once all children are in school there is no longer any major relative advantage for Québec mothers over those in the Rest of Canada (RofC) in terms of fixed costs of labour force participation. A static model predicts that childcare policies targeted towards mothers with no preschool child will have no effect on mothers with all children in school.
In order to evaluate the potential long-term or life-cycle effects of Québec’s universal childcare policy, both DD and difference-in-difference-in-differences (DDD) estimators are computed with
annual data from the SLID (1996 to 2004) for two groups of Québec’s mothers: those with at least a child aged 6 to 11 and no children less than 6, and those with at least a child aged 12 to 17 and no children less than 12; and comparative groups of mothers from the RofC and Ontario. We find that the program had substantial dynamic labour supply effects on mothers in Québec, in particular for cohorts of mothers who had a high probability of receiving subsidies from the child’s birth to his/her fifth birthday. For example, we find that the policy increased annual hours worked in 2004 for mothers with at least one child aged 6 to 11 years-old in Québec by 217 hours. Interestingly, Lefebvre and Merrigan (2008) find that the impact of the policy on all mothers with at least one child 1 to 5 years old to be 231 hours in 2002.
The paper is structured as follows. Section 2 briefly describes Québec’s childcare regimes (preschool subsidies program, kindergarten policy changes started in 1997) and changes in the utilization of these services by families with preschool children. Section 3 reviews some of the relevant studies on the effects of day care subsidies on mothers’ labour supply. Section 4 presents and explains the econometric strategy to estimate the dynamic effects of the policy. In Section 5, the data set is presented and descriptive statistics are shown as an introduction to Section 6 where the estimates of the long-term effects of the program appear. The paper concludes with a discussion of the results and final remarks.
2. Childcare policy in Québec and across Canada
Several measures can be used to reduce the burden of childcare expenditures and encourage the labour market participation of mothers with young children. In Canada, two major policy instruments have been implemented over the last 20 years: (1) at the federal and provincial level, a fiscal deduction or tax credits for day care expenses; (2) at the provincial level, childcare fee subsidies that depend on family income and are geared to low-income families. In some provinces, small subsidies are directed to licensed centers and regulated day care providers and are based on start-up costs,
fixed costs of providing childcare and costs that vary per number of children. As described lower, this last approach was favored in Québec for the implementation of its low-fee policy and as this policy became a universal childcare policy over the years, very large subsidies were made available to regulated day care providers.
Québec’s universal childcare policy for preschool children
On September 1 1997 licensed and regulated childcare facilities (not-for-profit centers, family-based day care and for-profit day care center), under agreement with Québec’s Department of the Family, started offering spaces at the reduced fee of $5 per day per child for children aged 4 on September 30. On September 1 1998 and on September 1 1999 respectively, the 3-year-olds and 2-year-olds (on September 30) became eligible for the low-fee spaces. On September 1 2000, all children aged less than 59 months (not entitled for kindergarten because their fifth birthday is after September 30) became eligible for reduced price childcare spaces. For the period analyzed, roughly 80% of total costs were covered by the government subsidy. In 1996-1997, the subsidies which partially covered fixed costs and were directed to license and regulated childcare facilities amounted to 166 million dollars, while low-income families receiving a fee-subsidy according to eligibility criteria received 122 million dollars. Since 2002-2003, nearly all day care subsidies are directly attributed to day care providers (see Table A3 for the budgetary credits of the program and by setting from 1996 to 2009). Table 1 presents the evolution of the number of spaces partly or totally subsidized by the government from 1993-1994 to 2006-2007 by type of childcare setting as well as the total number of children in Québec for different age groups by year. We observe that non-profit services are the main beneficiaries of the policy. The yearly increases in subsidized spaces from 1998 and onwards are all quite substantial. The table shows that in 2004-2005, 51% of all children aged 0 to 4 had access to a subsidized space or 64% of all children aged 1 to 4 (according to the number of spaces in March 2005). Table 2 presents the breakdown of children benefiting from the
program by age and setting in the years 2000 and 2004 and shows the number of children that have been exposed to subsidized childcare services over the years (these administrative data are not publicly available for the years before 2000). The last three columns of Table 2 indicate a notable regression of entry age in childcare and a large progression of the proportion of children having experienced childcare by age four. In 2000, 34% of all children aged 0 to 4 were in low-fee childcare services, 45% in 2003 (statistic not shown) and 49% in 2004. We cannot trace any such elaborate picture relative to the evolution of childcare services for other provinces in Canada, but the number of children in subsidized day care spaces is very small relative to Québec.1
Kindergarten as day care
Publicly provided (pre) kindergarten for (4) 5-year-olds implies an implicit subsidy for day care. All provinces offer publicly provided free kindergarten for 5-year-olds in a school setting under the auspices of the Department of Education. All programs are for a half-day (2 hours and 30 minutes) during the school year, except in Québec (which is for a full day since the fall of 1997), New-Brunswick, and Nova-Scotia. In most provinces parents are free to register their child in kindergarten as it is not a legal requirement (a large majority of eligible children do attend kindergarten). In Ontario, most School Boards offer a half-day of junior kindergarten for 4-year-olds. Again, most eligible children attend these kindergartens. In Québec since the fall of 1997, almost all 5-year-olds attend full-time kindergarten while a large number attend before- after-school subsidized day care settings. Despite these differences, the only major change in kindergarten policy over the period of our study occurred in Québec. Furthermore, the fact that in Ontario most 4 and 5-year-olds are enrolled in (junior) kindergarten suggests that this province offers an interesting comparison group as an alternative to the whole of Canada. In addition Ontario is the most populous province with the
1 For some partial and tentative estimates, see the OECD (2004) study on Canadian childcare which deplores the state of patchy day care statistics in Canada.
highest per capita income but with an economy very similar to Québec being a very important exporter of manufactured goods to the United States.
Childcare use in Canada: what are the arrangements and how much are used?
It is difficult to obtain a larger picture of day care utilization, arrangements, and reasons for the use of day care across Canada. The last national survey on childcare use was conducted in 1988. Other than licensed centers and family-based regulated day care, parents can choose unregulated day care in their own home or in someone else’s home by a relative or by a non-relative. Provincial and federal policies provide tax relief for childcare spending as long as receipts are presented to income tax authorities.
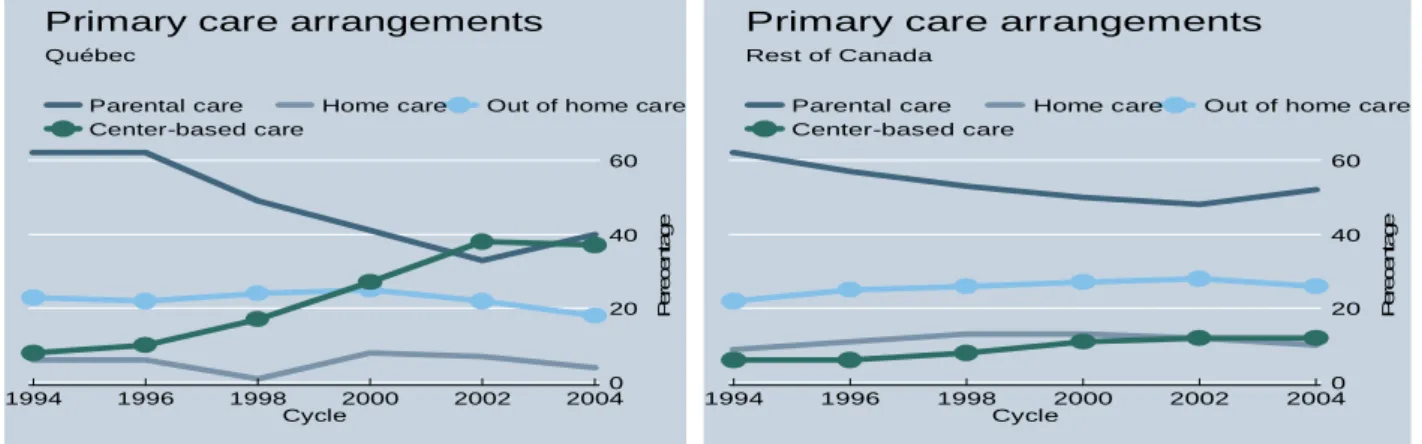
The NLSCY asks parents if they use childcare services for the purpose of studying or work and for each mode of childcare used, the number of hours per week. Figure 1 presents graphs for Québec and the others provinces (RofC) of the principal care (mutually exclusive) arrangements used by parents with children aged 0 to 5 for the 6 cycles of the NLSCY. From the third wave of the survey (1997-1998) on, it appears that a larger percentage of Québec’s children are in center-based care (including before- and after-school care) relatively to the RofC, and that this type of care is growing rapidly in Québec compared to the RofC where this arrangement ranks third. Family-based day care outside of the child’s own home is the most widely used mode of day care across Canada. Figure 2 graphs the mean hours per week (children are attributed 0 hours if parents do not report use of childcare) children spend in the primary care arrangement, by children’s age, for Québec and the RofC. As could be expected looking at the shifts affecting the principal mode of care, there is a large increase in the average hours children spend in day care for each age group (less than 1 to 4 year-olds) in Québec compared to the RofC since 1997-1998. Children aged 5, as expected, spend less time in childcare than 4-year-olds and the rise of hours in day care for them is smaller than for younger children. To summarize, the tables and figures presented so far show important shifts in day
care use, modes, and intensity occurring in Québec after the introduction of the childcare policy in 1997 but not in the RofC. No such important policy changes for preschool children (including kindergarten) were enacted in the RofC over the years 1997 to 2004.
3. A review of studies related to work incentives and childcare cost
The decision of a mother with a preschool child to participate in the labour market necessarily involves some childcare arrangements. Although some parents have access to childcare by relatives at no monetary cost (or may coordinate their hours of work with their spouse in order not to use non-parental childcare), most incur some childcare expenses in order to work.
The labour force participation decision of mothers is particularly difficult to analyze because it is sensitive not only to the cost of childcare but also to its quality, availability, convenience, reliability, and security. Two main issues have been addressed in the related research literature. First is the relationship between the cost of childcare, the labour market decisions of mothers of young children and the choice of the principal mode of childcare. The other is how much does a childcare subsidy that reduces work-related expenses and increases a mother’s net wage increase the labour force participation rate of mothers? This last question has been studied in the context of transition from welfare to work and of policies helping low-income families to access employment, thus possibly reducing child poverty.
Examining the American empirical evidence, Blau and Currie (2007) conclude that the link between childcare prices and labour supply is weak. There are a number of studies of the same nature in Europe: for France, Chroné et al. (2004); for Sweden, Gustafsson and Stafford (1992) and Lundin et al. (2007); for Italy, Del Boca (2002), Del Boca and Vuri (2006); for Germany, Wrohlich (2004); for England, Viitanem (2005). One of the main motivations for this literature is to infer, based on estimated models, the impact of varying childcare subsidies on employment. In most of the
studies, results show a small effect of prices on labour supply but a greater impact on the likelihood of using formal childcare.
Some natural experiments provide more insight on the incentives affecting the employment decisions of mothers of preschool children. For the USA, Gelbach (2002) and Cascio (2006) study respectively the effects of kindergarten, and of the expansions of kindergartens into American public schools, on the employment rate of single mothers with a youngest child aged 5. Intuitively, this group of mothers should be more sensitive to “variations of the cost” and availability of childcare, since their budget/time constraint is generally tighter than that of married women. Both studies find positive effects of kindergarten on the employment rate of these single mothers. In Gelbach’s case, free kindergarten increases the employment rate of single mothers of preschool children by 4 to 5 percentage points, while the positive effects range from 7.3 to 8.1 points for Cascio. For Argentina, Berlinski and Galiani (2007) analyzing a large expansion of pre-primary school facilities between 1991 and 2001 obtain similar results for maternal employment conditional on full tape-up of the new places. However, these three studies do not examine life-cycle considerations of the policy.
For Norway, Schone (2004) exploits the introduction of a new family policy program with a different motivation and work disincentives. From January 1999 on, all parents with 1 and 2- year-olds who did not use publicly subsidized day care became entitled to a ‘‘cash-for-care’’ (CFC) subsidy. DD and DDD estimates show the effect of the CFC-subsidy to be a decrease of 8 points in participation rates of eligible mothers. As suggested by the author, a natural extension of the study would be to examine if the CFC-subsidy has permanent effects or if mothers do return to work when the CFC-period ends. For France, Piketty (2005) analyzes the extension of a similar parental home-care allowance, for up to three years, (the “Allocation Parentale d’Éducation”- APE started in 1985-1987 for mothers having a third child who decide to stop working. In 1994, the program was extended to mothers giving birth to a second child (for families with a first child aged less than 3).
His estimates suggest that for women with a second child born after July 1994, labour force participation of eligible mothers decreased between 11 and 19 points depending on socio-economic controls and trends included in the regressions. When the second child is 36 months old, Piketty’s results show that there are no dynamic effects. Most mothers with two children return to their previous job and this, in turn, reflects the important job protection “insiders” benefit from in France’s rigid labour market.
Lefebvre and Merrigan (2008), as well as Baker et al. (2005), use DD methods and estimate a strong positive impact of Québec’s universal childcare policy on the labour supply of mothers with preschool children. These papers identify the effects of a universal childcare policy using Québec’s policy as a natural experiment. Therefore, they do not rely on structural modeling for the identification of the policy’s effects and simultaneity issues are less relevant in these analyses. Also, the price reduction of childcare costs is large and clearly exogenous.Lefebvre and Merrigan (2008) estimate the short-term effects from 1999 to 2002 of the childcare policy with the same data set used in this paper. The main results are found for a sample of mothers with at least one child aged between 1 and 5. They show that for hours, earnings, and weeks, the effects of the policy substantially increase each year from 1999 to 2002 as more spaces are created. Hence, the largest impacts are observed in 2002 when the number of subsidized childcare spaces reached their maximum over the period studied. In 2002, the effects on participation, earnings, annual hours and weeks worked of the childcare policy are respectively between 8.1 and 12 percentage points, $5,000-$6,000 (2001 dollars), 231 to 270 annual hours at work, and 5 to 6 annual weeks at work.
4. Conceptual issues and econometric modeling Conceptual issues
In a static model of labour supply, the Québec child care policy should have no effect on the labour supply of mothers without any children of preschool age because it is one-off and
“temporary”. Only a dynamic model can explain policy effects on these mothers. In order to explain the dynamic effects of the policy and for the purpose of clarity, it is helpful to describe in detail the change in policy.
Before the “$5 per day regime”, refundable tax credits based on child care expenses and family income at the provincial level (in Québec)2 and a deduction of childcare expenses for the lowest earner at the federal level were the core of childcare policy. The declared child care expenses used to compute deductions and credits are capped in both federal and provincial returns. The basic effect of these policies is to produce non-linearities in family or individual budget constraints for households with preschool children and increase the net wage of working mothers.
Under the new regime, a subsidized space in an authorized childcare facility cost $5 per day for 10 to 11 hours of day care. However, the parents had to commit to 260 days per year to keep their space all year. Given that almost all parents use less than 50 hours of childcare per week, the policy basically introduced a fixed cost of $1,300 per year for the use of a subsidized space. On the other hand, it substantially increases the net wage of mothers who obtained such a space. Both the provincial tax credit for childcare expenses and federal deduction remained in the tax form after the change in policy. However, expenses in a subsidized facility cannot be used for the provincial tax credit but can be deducted in the federal return.
The approximate gross cost for day care services in child care centers was between $20 and $25 per day before the new childcare regime. The price in unregulated family settings and by “nannies” is more difficult to ascertain. Baril, Lefebvre and Merrigan (2003) show that for a middle-income family who sent receipts to both federal and provincial governments, the estimated net daily price for childcare was approximately $11 per day for a $22 per day gross price. For the highest income
2 At the provincial level, only Québec has a tax credit for childcare expenses; in the other provinces it is a fiscal deduction.
families, the net price would have been approximately $16 per day, while for working families with the lowest income, the net price was approximately $5 per day. Welfare mothers on the path back to participation paid $3 per day, but this price remained at $3 after the regime switch. Therefore, the reduction in price was very important for middle and high income families using income tax credits and deductions.
Our understanding is that before the new regime a non negligible proportion of families were using unregulated providers and informal services without receipts. For those families, we presume the price decrease was even more important. Also, anecdotal evidence suggests that liquidity constraints played a role in labour force participation choices. Finally, low-priced child care services were simply hard to find. In this regard, the provincial government, in addition to subsidizing approximately 80% of the operating cost of childcare facilities, also spent substantial amounts for the construction of childcare not-for-profit centers, thus increasing the supply of spaces.
In order for the policy to cause changes in the labour supply of mothers with children in school and no children of preschool ages, it is necessary that some of these mothers who integrated or reintegrated permanently the labour market when the child is of preschool age in the new regime would not have reintegrated the labour market, even when the child started grade school in the counterfactual situation.
Of course, under the new policy, effects differ depending on the labour supply choice in the counterfactual world of no “$5/day day care”. When the policy was implemented for 4- and 5-year-olds in September of 1997, a majority of mothers with children of these ages were already working. In fact, in the first year of the policy no new spaces were created (Table 1). The only beneficiaries were families with a child care space for their 4-year-old. For these mothers, the dynamics are less interesting. In a standard life cycle, the policy corresponds to a temporary unforeseen change in the budget constraint that will last for two years (one year of subsidized child care and one year of full
time free kindergarten) and of additional expected changes in the budget constraint for several years if the mother expects to have children later. The policy will not have any effect on participation for these women, but it could have an effect on hours worked, and its sign will be ambiguous. Most studies find that the causal impact of increased wages at the intensive margin of labour supply is small.
For many mothers not participating, under the old regime, several expect returning or start to work when the child enters grade school. In this case, the new policy has an unambiguous policy effect on participation when the child is 4, but they would, under any realistic assumptions, also participate when the child starts school, new policy or not. To find an effect on participation after all children leave preschool, we must ask why mothers who, under the old regime, would not have reentered or start working even when all children are in grade school, reenter or enter the labour market in the new situation? We believe that the answer lies with human capital. For periods with lower childcare costs, work yields higher consumption. But participation will also stop the depreciation of human capital accumulated in school and in former jobs, and it also permits the accumulation of new human capital acquired on the job. This changes the expected evolution of future wages so that women who never expected to work while raising children re-evaluate their life-time utility and return or start working. The increase in work experience (Gladden and Taber, 2000, 2006) can increase real wages and thus increase labour supply for several periods. Habit persistence (Shaw, 1994; Boyer, 1991) can also lead to permanent effects of short-term increases in labour supply. This paper does not seek to identify which mechanisms are at play but to empirically evaluate, if any, the life-cycle effects of Québec’s universal childcare policy. We believe that the case of Québec’s policy is very well suited to find these dynamic effects because the incentive switch (relative to the RofC) is turned off exogenously once the child starts school, and because this
low-fee childcare policy has significantly enhanced the labour supply of mothers with preschool children.
Some of the preceding referenced studies have shown that Québec’s universal childcare program had a strong impact on the labour supply of mothers with preschool children. And, as can be seen in Figures 1 and 2, the policy greatly affected the main mode of care chosen by parents and the number of hours children spend in day care. Hence it is important to keep in mind that, because of the substantial increases of regulated day care spaces that occurred over time, it is more likely that mothers of 6 to 11-year-olds with no children aged less than 6 and belonging to the 2004 cohort, have benefited substantially more from the childcare policy relatively to the preceding cohorts. Furthermore, because of the policy’s gradual implementation, the number of total additional hours of day care use because of the policy is surely much higher for the 2004 cohort than for the 2002 cohort.
In the introduction, we mentioned that the new policy includes a $5 per day for before- and after-school day care program. Theoretically, this aspect of the policy could also affect the labour supply of mothers with only children in school. However, the price change was much smaller and could only marginally affect mothers’ labour supply decisions, possibly at the intensive margin, which in general is shown to be considerably inelastic to wage changes in past econometric work. Econometric evidence presented in a later section will support the hypothesis that the before and after-school program had no effect on labour supply.
Conceivably, the policy could have incited families from other provinces to move to Québec. However, migration in Québec from other provinces is very low because of the language barrier since 80% of the population in Québec is French speaking. Similarly, fertility behavior is not at issue because fertility rates are low and have been nearly constant from 1997 to 2005 in both the RofC and Québec.
Our a priori hypothesis about the policy’s long-term effects is that its gradual implementation should be reflected by a pattern of increasing effects over time as found for mothers with pre-school children. The labour supply of “recent” cohorts of mothers with 6 to 11-year-olds and no children aged less than 6 should be more responsive to the policy than “older” ones, if the policy is effective in the long-term. From 1999 onwards, mothers from Québec in this sample have potentially benefited from the policy. It is important to include a specification where the long-term effects of the policy change for the post-policy years because each cohort of mothers was treated differently. For example, mothers from the 1999 cohort with a child who is 6 benefited from the policy of a free full-time kindergarten when the child was 5 in 1998, and from subsidized day care when he/she was 4 in 1997. For the 2000 cohort, mothers with a child aged 6 benefited from subsidized day care in 1998 and free full-time kindergarten in 1999. For the 2001 cohort, mothers with a child aged 6 benefited from subsidized day care in 1998 and 1999 and free full-time kindergarten in 2000; mothers with a child who is 7 benefited from the free full-time kindergarten in 1999 and subsidized day care in 1998, and so on.
The first part of our econometric strategy to estimate the policy’s potential long-term effects is to compare the labour outcomes of Québec’s mothers with at least one child aged between 6 and 11 and no children less than 6, to similar mothers in the RofC from 1996 to 2004 (DD estimators). The second part of our econometric strategy consists in verifying the robustness of the results obtained in the first part by adding another comparison group of mothers not affected by Québec’s policy: mothers with at least one child aged between 12 and 17 and no children less than 12. Therefore we also estimate DDD models. Clearly, a more interesting strategy would have been to compare mothers by age of the children because the policy was implemented gradually on the basis of the age of children. Unfortunately, the SLID does not supply a sufficient number of observations in Québec to proceed with such an analysis.
Econometric modeling
Our primary econometric approach is based on a DD procedure that is now well established in labour economics (Angrist et Krueger, 1999). The year 1999, for reasons explained in the section on conceptual issues, can be considered as the first year of possible life-cycle effects. In order to assess these effects, we turn to a DD specification, differentiated by period, presented by Francesconi and Van der Klaauw (2007):
Yit = α + θQi + γI(t≥s) +
∑
= 2004 1999 t it it tD Q β +Φ′ Xit + εit. (1)The life-cycle effects can be represented by a series of year-specific dummies from 1999 to 2004 interacted with a Québec dummy, thus reflecting the gradual increases in the number of regulated day care spaces and the increasing numbers of mothers having benefited from the policy. The parameter βt represents a time-specific effect of the policy; Xit is a vector of socioeconomic control
variables and Φ is a vector of parameters. Qit takes the value of 1 if the mother lives in Québec, 0
otherwise; Iit is an indicator function which takes the value of 1 if the period of observation includes
mothers having benefited from the policy (1999 to 2004) and Dit are yearly dummy variables. Yit
represents different labour market outcomes. The following restrictions yield the standard DD estimator: β1999= β2000= β2001 =β2002= β2003= β2004. For sake of robustness, we also present estimations
where Ontarian mothers are an alternative control group to all RofC mothers.
To test the sensitivity of the results to different specifications, we estimate two models. The first is a standard DD specification where the policy effects are constrained to be the same for each period. The second is a DD specification where the policy effects are unconstrained by period. In order to measure the robustness of the results obtained with the DD estimators we add an additional control group to our data set: mothers with at least one child aged 12 to 17 and no younger child than 12. We then estimate DDD models. This will purge from the DD estimators any post-policy effect
specific to Québec that is different from the childcare policy. The DDD model differentiated by period becomes:
Yit = β0 + β1Qit + β2 I(t≥s)+β3Cit+ β4Qit I(t≥s)+ β5QitCit + β6Cit I(t≥s) +
∑
= 2004 1999 t it it it tD C Q β +Φ′ Xit + εit (2)In this model, we add the variable Cit, which takes the value of 1, if there is a child between 6 and
11 in the household, and 0 otherwise. Finally, we estimated the models with time-trends that are specific to Québec and the RofC. Because, the results were not sensitive to the inclusion of these trends, we discuss the results without them.
5. Data set
The data used for our empirical analysis are provided by Statistics Canada’s Longitudinal Survey of Labour and Income Dynamics (SLID), a nationwide survey on household and personal income as well as labour force participation. The individuals for this survey are sampled through the Labour Force Survey (LFS) which covers all provinces with the exception of the three Territories, native reserves, the military and individuals residing in institutions. Conceived originally as a rotating panel survey, the first panel was produced in 1993. The same individuals were interviewed every year from 1993 to 1998. In 1996, a second panel was introduced covering the years 1996 to 2001. In 1999, a third panel was started to replace the first cohort of respondents. The last panel started in 2002. Since 1996, the SLID is composed of two cohorts representative of the total population of individuals aged 16 or more.
First, from the years 1996 to 2004 (latest year the data set is available), we sampled mothers aged between 18 and 55 years-old in a single-mother or two-parent family, with at least one child less than 18. Second, we kept only mothers with a least one child aged 6 to 11 and with no children less than 6 for DD regressions and added mothers with at least one child 12 to 17 and no children less than 12 for DDD regressions. Finally, we separated our sample of mothers by two levels of education which
we define as follows: “high-education” mothers (a university diploma or more) and “low-education” mothers (those with less than a university education). Four labour market variables were chosen to analyze labour supply outcomes: 1. Labour market participation for two of the 12 months of the year (the information is available for any of the twelve months); 2. Number of weeks worked during the year; 3. Number of hours worked during the year; 4. Annual earnings gained from all jobs (2001 dollars). Since we are using mothers as the unit of analysis, all means and regression results use the weights computed by Statistics Canada for the analysis of job market variables. Because OLS standard errors underestimate standard errors (see Donald and Lang, 2007), all standard errors are bootstrapped using Statistics Canada’s bootstrap weights.
A descriptive analysis
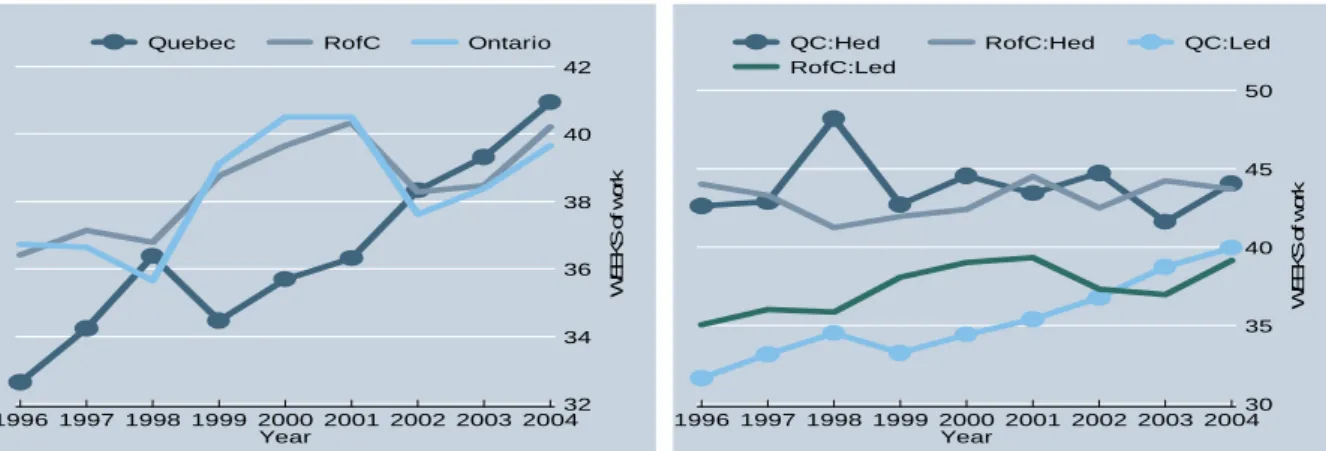
Figures 3A to 6A contain graphs tracing the time series evolution of the four labour market variables studied for the years 1996 to 2004 for mothers in Québec, the RofC and Ontario. Figures 3B to 6B are done by the education levels of mothers. For purposes of concision, we constrain our descriptive analysis to the sample of mothers with at least one child between 6 and 11 and no children less than 6.
Figure 3A presents the percentage of all mothers working in the month of April in Québec, the Rest of Canada (RofC) and Ontario (descriptive statistics and estimation results are very similar when using other months). It shows that the gap between participation rates for the RofC and Québec is quite important and stable from 1996 to 2001. From 2001 on, we observe that the participation rate for the RofC is rather stagnant while it increases rapidly in Québec. Figure 3B indicates that the driving force behind these increases is mainly the rise in participation of low-education mothers. The participation rate of high-education mothers is mostly unchanged by Québec’s childcare policy and it is roughly similar to that of mothers with the same level of education from the RofC. On the contrary, the participation rate of Québec’s mothers with no university education jumps dramatically
starting in 2002 from around 65% in 2001 to approximately 75% in 2004. The new opportunity offered by subsidized childcare seems to have strongly modified their working behavior in the long run. In the RofC, the participation rate of low-education mothers decreases from 2001, with an important rebound in 2004. In the rest of this section we will concentrate on the figures by education levels of the mothers because of their importance for our econometric results.
Figures 4A-B and 5A-B present the same time series but for annual average weeks worked and hours worked. Starting in 2000-2001, as can be seen on the Figures 4B and 5B, there is a marked growth for weeks and hours worked by low-education mothers in Québec relatively to the RofC. Looking at the same figures, one clearly sees that these two labour variables are roughly the same in Québec and the RofC for high-education mothers. Thus, the patterns by education level display evidence of a strong, long lasting, positive effect of the policy for low-education mothers. It is not clear the policy had any long-term impact on the average working weeks and hours of more educated mothers. Not surprisingly, the patterns for hours (Figures 5) closely mimic the patterns for weeks (Figures 4).
The Figures 6A and 6B present the time series for annual average earnings ($2001). Figure 6B shows an earning gap in favor of low-education mothers from the RofC during almost the entire period of study. However, having stagnated around at $15,000 from 1996 to 2001, the earnings of Québec’s low-education mothers start rising in 2002 and definitively close the gap a year later.
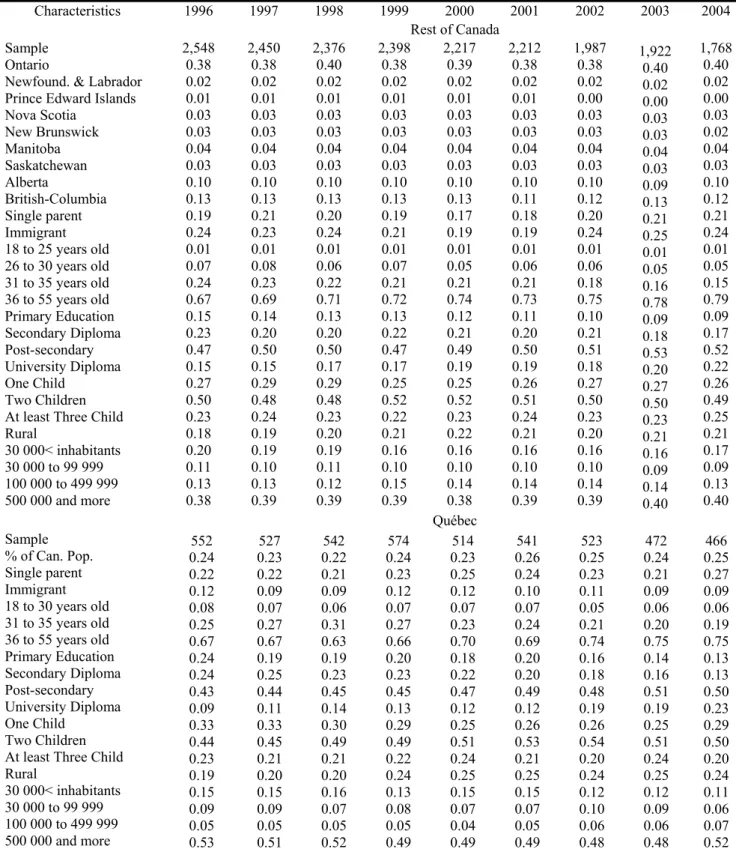
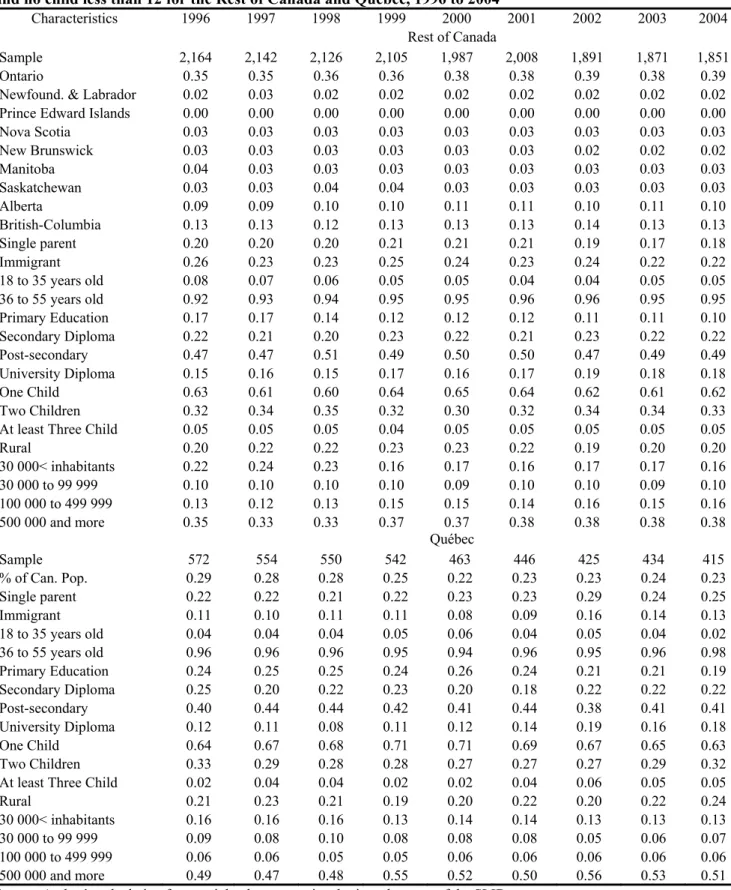
The two panels of Tables A1 and A2 (for the RofC and for Québec, and by ages of children) present the mean values in the regressions. These statistics show that mothers in both regions are very similar except for the proportion in single-parent households, immigration status, and university educated mothers at the beginning of the period of study. The Tables identify the socioeconomic control variable used: provinces, family and immigration (not born in Canada) status, age group and education level of the mother, number of children in household and size of community.
6. Econometric results
Four specifications were estimated for each dependent variable. The first is a specification with constant program effects over the years 1999 to 2004 (β1999 = β2000=…= β2004) (see equations (1) and
(2)). The second specification lets policy effects vary by year for the years 1999 to 2004. Finally the third and fourth specifications are identical to the first and second specifications except that we constrain the effects of the policy to be 0 for the years 1999 to 2001.
Before commenting on the specification we retain for a detailed analysis we briefly discuss the results from a more general specification and a DDD approach, equation (2) (conclusions from DD estimates are basically the same), appearing in Table 3. We concentrate our remarks on the specification with year specific effects of the policy, under the label “Unequal Policy Effects”, that shows an increasing pattern for the size of the effects, as each year more and more mothers having benefited from the day care policy are present in the sample. In the final year, 2004, all women with children 6 to 11 had benefited from the policy, although for a different numbers of years. However, for the first three years, 1999 to 2001, the effects of the policy are very small and statistically insignificant. Two reasons can explain this: (1) a smaller proportion of women, compared to 2002-2004 have benefited from the policy; (2) Less human capital gains from returning or starting work when the child is younger. These results support our assumption that the before- and after-school day care program had no labour supply effects as this policy was implemented in late 1997 and thus could have affected labour supply decisions of mothers with children in school. Therefore, our analysis will focus on the results obtained from specifications where the year-specific effects of the policy for 1999, 2000, and 2001 are constrained to be null (Tables 4 and 5). This constraint substantially lowers the standard errors for the estimated effects for years 2002 to 2004.
Tables 4 and 5 present, respectively for all mothers and for two sub-samples of mothers: with no university education (noted LED) and university educated (noted HED), the estimated effects of the
policy for all samples and specifications computed with the DD and DDD methods. Under the columns labeled DD, mothers in Québec with at least one child 6 to 11 and no child less than 6 are compared to similar mothers from the RofC. Under the columns labeled DDD, we add mothers with at least one child between 12 and 17 and no child less than 12 to the DD sample.
We start our discussion of the DD results with the full sample of mothers (Table 4, panels A, B, C and D), under the label Equal policy effects. For all labour supply indicators except earnings (Panel D), we observe a positive albeit, in a majority of cases, not very statistically significant effect of the policy. The effects are estimated to be slightly higher with the DDD method, but standard errors are higher as well. For participation (Table 3, panel A) and for the DD and DDD estimators with equal effects of the policy respectively, we find that the policy increased participation by approximately 5 and 6 points. This, in turn, means that the participation rate of Québec’s mothers would have been 70% or 69% without the program. Given that the effect of the child care program is clearly heterogeneous, we interpret our effects as treatment on the treated effects.
Under the label, Unequal policy effects, we find that the DD effects of the program increased from 2002 to 2003, but remained stable from 2003 and 2004. Statistical significance is observed only for 2003. The DD effects for 2002, 2003, and 2004, are respectively 3.3 points, 6 points and 5.6 points for participation. The DDD effects (Table 4, panel A, column 4) are slightly higher. The pattern of increasing effects is clearer for annual weeks and hours worked. For annual hours worked (Table 4, panel C, column 3), the year-specific DD effects of the policy are 93, 91 and 145 hours. We estimate that without Québec’s policy the mean annual hours worked by Québec’s mothers would have been, for the years 2002, 2003 and 2004 respectively, 1,197, 1,203 and 1,229. The DDD effects are considerably higher for this case and significant for 2002 and 2003. For annual weeks worked (Table 4, panel B), the DD effects (column 3) are 2.02, 2.70 and 3.91 and, again, the DDD effects are higher. Only with the DDD estimator did we find marginally significant effects for
earnings (Table 4, panel D. columns 2 and 4), and they are quite large: $3,617 for the DDD estimator with equal effects; $3,915, $2,342 and $4,512 for the specification with year-specific effects. Therefore, the hypothesis that the effects should increase as more mothers within an age group benefit from the policy when their child or children were less than 6 is supported by the data.
Three mechanisms are at play to explain the increasing pattern of effects. First, as time goes by, there are more mothers whose children could have been in subsidized care in the 6-11 age groups strictly because of age. Moreover, the number of subsidized places also increased every year from 1999 to 2004 so that the probability of benefiting from a subsidized space, given the age of the child, was also increasing (see Tables 1 and 2). Human capital net gains are higher because more women in the later years could benefit from the program for several years when the child is of pre-school age.
The specification with only Ontario’s mothers as the control group gives the same results (Table 4, panels E, F, G and H) as with all other provinces. This is not surprising as approximately 40% of sampled mothers reside in Ontario. However, the estimated effects of the policy are found to be slightly larger and more effects are statistically significant.
As one could expect looking at the Figures (3B, 4B, 5B and 6B) of the labour supply variables by education level of the mothers, the regression results by education level of the mothers in Table 5 are very revealing. They show that the program has long-term statistically significant effects on low-education mothers. In almost all cases, the effects of the models are pronounced and statistically significant for these mothers. For instance, for this sample, the effects when unconstrained to be equal for participation in April (Table 5, panel A1, columns 3 and 4) are estimated to be, for the DD and DDD estimators and for the years 2002, 2003, and 2004 respectively, 3.8, 8.5 and 8.2 percentage points, and 7.6, 12.2 and 12.0 percentage points, the last two effects being statistically significant for both estimators. Without Québec’s universal childcare program and as a point of comparison, the April participation rate of less educated mothers for the years 2002, 2003 and 2004 would have been
respectively, 65,2% (61,4%), 66,5% (62,8%), and 66,8% (63%) judging by the values of the DD (DDD) estimator. For this same group of mothers and for unequal policy effects, the DD effects on hours are 126, 135, 208 (Table 5, panel C.1), while they are 231, 239 and 313 for the DDD estimator (Table 5, panel C.1). In all cases, the program’s effects on hours are statistically significant. The pattern for annual weeks worked (Table 5, panel B.1) is very similar to annual hours. Finally, only for the DDD estimates do we find large and significant effects of the policy on the annual earnings of less educated mothers (Table 5, panel D.1). To the contrary and whichever labour variable is considered, the policy effects are almost never statistically significant for high-education mothers (Table 5, panels A.2, B.2, C.2 and D.2). However, despite the large standard errors, they do point towards a negative effect of the policy, more consistent with a standard life-cycle theory of labour supply, where increased labour supply, during the period of the temporary incentive, will be followed by lower labour supplied financed by the additional savings.
We perform joint tests of equality of policy effects between the less and more educated mothers and one main feature stands out. Except for the case of annual earnings, the null hypothesis of equality of effects between the two groups is more strongly rejected (lower p-values) with the DDD approach (test results are available from the authors).
Therefore, the evidence supports the hypothesis of strong dynamic effects of the program. Although the difference in incentives to work between mothers in Québec and the RofC is no longer directly affected by the childcare policy, the policy seemingly continues to produce effects on labour supply.
8. Concluding remarks
In September 1997, the government of Québec implemented a low-fee childcare policy which has been enlarged over the years in terms of coverage (by age of child) and spaces, to become a truly universal childcare program. In the first years of the policy, it is well known that the program could
not satisfy all of the increased demand for low-fee spaces. The characteristics of the program explain why. Before the policy, the net price of day care varied with family income. In addition, several families did not receive the tax subsidies, as receipts were not supplied to tax authorities, the informal arrangement with their childcare provider being superior to an arrangement with receipts. Also, low-income families could be liquidity-constrained and have problems accessing reliable day care, so the policy was attractive to this group as well. Parents using free day care provided by a relative could prefer a subsidized space because of the long hours that are available in these settings as well as the 5 days per week (260 days per year) operating conditions. For mothers working full-time, taking into account work full-time, commuting time between the home, the day care facility and workplace (let us say 9 hours), the hourly cost of day care was (is) less than $0.60 per hour ($0.90 per hour since 2004). Finally, the $5/$7 per day childcare providers could be seen as more reliable than a person at home as the service is licensed and regulated, and available every day of the week. All these factors explain why the policy had significant effects on the labour supply behavior of mothers and why parents were all demanding a subsidized space. In fact, the rationing of spaces in the early years of the program leads us to believe that the estimated effects of both the long and short-term effects of the program are smaller than the effects one would find for an “instantaneous” universal childcare policy.
A few points must be made regarding the generalization of our results to other provinces or countries. As we mentioned throughout the paper, this policy was implemented during a period (1996 to 2004) of strong real GDP growth so that aggregate labour demand increased, helping mothers induced by the policy to search for a job to find jobs in the labour market. It is not clear that such a policy would produce the same effects in countries with more sluggish economic growth. Also, and very importantly in our opinion, Québec’s labour market is (relatively) flexible, especially when compared to those of many continental European countries. In addition, in regions or countries
where most of the mothers out of the labour market stay at home because they strongly value personally rearing their child, any type of subsidy will have limited effectiveness.
The effects of the policy cannot be strictly interpreted as the effects of a price change. Several features characterize the policy: the price change, the financial help to fund new childcare settings, and the increased wages for childcare workers. The last feature mainly explains why the average yearly subsidy to registered day care providers (including parent-fee-subsidy before 2002) increased from $3,888 for 1996-1997 to $8,117 per year for fiscal year 2006-2007 (see Table A.3).
The Québec experiment provides a unique opportunity to identify the effects of childcare subsidies given that the scale of the program and the amount of resources dedicated by the provincial government. The public cost of the program increased from 0.16 percentage point of Québec’s GDP in 1996 to 0.57 percentage point in 2006. However, policy does not occur in a vacuum, and features other than the price change accompanied this policy during its implementation. This paper examined if Québec’s universal childcare policy had long-term impacts, taking into account its time-limited nature. The results support the hypothesis that this policy effectively had life-cycle labour supply effects on mothers who benefited from the program when their child was less than 6. These effects, measured in terms of labour force participation, weeks, hours and work experience are estimated to be stronger and significant only for less educated mothers (not university educated). In general, significant effects for earned annual income were found only for the DDD estimators. And, again, the effects found were particularly strong and significant only for less educated mothers. Thus, our results suggest that a time-limited policy directed to all mothers with young children has dynamic effects over time. More interestingly, these effects only pertain to mothers who are not university educated and whose attachment to the labour market is traditionally weaker than that of university educated mothers. Although the study did not disentangle the roles that habit formation, work experience or job tenure might play in the causation processes; these are promising avenues of
research given the results found in this paper. But the hurdles to realize such a project are difficult to overcome, even downplaying issues of selection and endogeneity related to experience and wages. Structural estimation methods must be used to separate experience effects from habit persistence. The main obstacle for the realization of this project is the absence of prices for childcare across Canada over the period of study.
References
Angrist, Joshua and Alan Krueger (1999), “Empirical Strategies in Labor Economics,” in Orley Ashenfelter and David Card (eds.), Handbook of Labor Economics, Volume 3A. Amsterdam: Elsevier, 1277-1366.
Baker, Michael, Jonathan Gruber, and Kevin Milligan (2005), “Universal Childcare, Maternal Labor Supply and Family Well-Being,” NBER: Working Paper No 11832, December.
Berlinski, Samuel and Sebastian Galiani (2007), “The Effect of a Large Expansion of Pre-primary School Facilities on Preschool Attendance and Maternal Employment,” Labour Economics, 14(3): 665-680.
Blau, David and Janet Currie (2007), “Who's Minding the Kids? Preschool, Day care, and After School Care,” The Handbook of Education Economics, Finis Welch and Eric Hanushek (eds.), New York: North Holland, 1116-1278.
Bover, Olympia (1991), “Relaxing Intertemporal Separability: A Rational Habits Model of Labor Supply Estimated from Panel Data,” Journal of Labor Economics, 9(1): 85-100.
Cascio, Elizabeth (2006), “Public Preschool and Maternal Labor Supply: Evidence from the
Introduction of Kindergartens into American Public Schools,” NBER: Working Paper No 121790, April.
Choné, Philippe, David Le Blanc, and Isabelle Robert-Bobée (2004), “Female Labor Supply and Child Care,” Économie & Prévision, Numéro 162: 23-50.
Del Boca, Daniella and Daniella Vuri, (2006), ‘The Mismatch between Employment and Childcare in Italy: the Impact of Rationing,” Working paper, IZA.
Del Boca Daniela, (2002), “The Effect of Childcare and Part-time Opportunities on Participation and Fertility Decisions in Italy,” Journal of Population Economics, 15(4): 549-573.
Donald, Stephen G. and Kevin Lang, (2007), “Inference with Difference-in-Differences and Other Panel Data,” The Review of Economics and Statistics, 89(2): 221-233.
Donald, Stephen and Kevin Lang (2007) “Inference with Difference-in-Differences and Other Panel Data,” Review of Economics and Statistics, 89(2): 221-233.
Francesconi, Marco and Wilbert Van der Klaauw (2007), “The Consequences of ‘In-Work’ Benefit Reform in Britain: New Evidence from Panel Data,” Journal of Human Resources, 42(1): 1–31. Gelbach J (2002), “Public Schooling for Young Children and Maternal Labor Supply,” American
Economic Review 92 (1):307-322.
Gladden, Tricia and Christopher Taber (2006), “The Relationship between Wage Growth and Wage Levels,” Working Paper: Northwestern University.
Gladden, Tricia, and Christopher Taber (2000), “Wage Progression among Less Skilled Workers,” in Finding Jobs: Work and Welfare Reform, David Card and Rebecca Blank, (eds.), New York: Russell Sage Foundation.
Gustafsson, S. and Stafford (1992), “Childcare subsidies and Labor supply in Sweden,” Journal of Human Resources, 2(1): 204-29.
Lefebvre, Pierre and Philip Merrigan (2008), “Childcare Policy and the Labor Supply of Mothers with Young Children: A Natural Experiment from Canada,” Journal of Labor Economics, 23(3): xx-xx. Lundin, Daniela, Eva Mork, and Bjorn Ockert (2007), “Do reduced Child Care Prices Make Parents
Work More?” Working Paper 2007-2, Institute for Labour Market Policy Evaluation, Sweden. OECD (2004), “Early Childhood Education and Care Policy: Canada Country Note”, Organisation for
Economic Co-operation and Development, Directorate for Education, Paris: OECD.
Piketty, Thomas (2005), “L'impact de l'allocation parentale d'éducation sur l'activité féminine et la fécondité en France, 1982-2002,” Les Cahiers de l'INED, no. 156: 79-109.
Schone, Pal (2004), “Labour Supply Effects of a Cash-for-care Subsidy,” Journal of Population Economics, 17(4): 703-727.
Shaw, Kathryn. (1994), “The Persistence of Female Labor Supply: Empirical Evidence and Implications,” Journal of Human Resources 29(2): 348-378.
Viitanen, Tarja (2005), “Costs of Child Care and Female Employment in England”, Labour, 19(1): 149-170.
Wrohlich, K, (2004), “Childcare Costs and Mothers’ Labour Supply: An Empirical Analysis for Germany,” Working Paper, DIW Berlin, Germany.
Table 1
Number of childcare regulated spaces and subsidized1 spaces for preschool children on March 31st by setting
and number of children aged less than one year, 0 to 4 years and 5 years on July 1st, Québec, 1994-2006
Spaces in not-for-profit network1 Year Center Family-based Spaces in for-profit center2 under agreement (not subsidized)3 Total number of spaces at a reduced fee4
Total number of children [less than 1 year], 0-4 years and (5 years) 1993-1994 1994-1995 1995-1996 1996-1997 1997-1998 1998-1999 1999-2000 2000-2001 2001-2002 2002-2003 2003-2004 2004-2005 2005-2006 2006-2007 Dec. 2007 33,452 34,545 36,708 36,101 36,977 39,436 45,793 51,988 58,525 63,339 68,274 72,057 74,573 75,934 76,759 15,253 17,871 19,479 20,328 21,761 32,816 44,882 55,979 62,193 75,355 82,044 87,192 89,011 88,645 88,728 (15,665) (18,366) (19,842) 17,629 (4,806) 17,979 (5,587) 23,861 (585) 23,270 (1,208) 24,578 (705) 24,629 (976) 24,740 (1,620) 27,530 (1,907) 30,131 (2,457) 33,034 (3,487) 34,027 (4,538) 34,700 (4,960) 64,370 70,782 76,029 74,058 76,7155 96,1135 113,5455 132,545 145,624 163,434 177,848 189,380 196,618 198,606 200,187 [90,417] 480,098 (90,603) [87,258] 473,113 (96,973) [85,130] 460,657 (99,415) [79,724] 445,143 (98,853) [75,674] 428,297 (94,674) [73,599] 412,161 (91,453) [72,070] 397,971 (89,358) [73,699] 381,522 (87,111) [72,200] 373,264 (83,582) [73,600] 368,920 (79,015) [74,370] 371,028 (76,105) [75,206] 373,406 (76,130) [78,352] 379,658 (74,768) [82,981] 389,661 (75,590) NA
Sources: Department of Family for number of spaces; Québec’s Institute of Statistics for number of children by age.
1. This designation applies more strictly from September 1997. 2. From 1999 to 2003, the government froze the number of for-profit childcare centers under agreement, which also offered spaces at the $5 per day fee; few new spaces were added for this arrangement during this period. 3. Figures in parenthesis represent spaces in daycare center without an “agreement,” that are not subsidized but are licensed and regulated. Those centers are free to choose their daily fee. 4. The reduced ($5 per day fee) program began on September 1997 for the children aged 4 by September. By January 1 2004, the daily fee was raised to $7. 5. The $5 per day fee policy was extended to the 3 years on September 1998, the 2 years on September 1999 and to children of all ages not eligible for kindergarten on September 2000 (fifth birthday after 30 September).
Table 2
Breakdown of children in Québec attending ($5 per day) day care by age on September 30 and setting, March 2000 and 2004, and number of children by age on July 1 2000 and 20041
Number of children in subsidized day care Ratios 2000 2004 Age of children in years Day care centre Family-based Total (1) Day care centre Family-based Total (2) Number of children in Québec 2000 | 2004 (3) | (4) (2)/(1) (5) (1)/(3) % (6) (2)/(4) % (7) 74,157 | 74,287 74,902 | 73,319 78,180 | 74,207 83,488 | 73,853 88,699 | 75,579 399,426|371,245 1.22 1.90 1.40 1.22 1.16 1.34 16.5 25.9 36.5 43.6 42.6 33.6 20.0 50.2 53.9 60.0 58.2 48.5 <1 1 2 3 4 0-4 51 Total 4,925 9,452 16,308 22,273 25,177 78,135 819 78,954 7,303 9,927 12,121 14,159 12,111 56,213 2,504 58,717 12,228 19,379 28,519 36,432 37,790 134,348 3,323 137,671 5,345 16,575 21,320 27,275 30,375 102,075 1,065 103,140 9,575 20,205 18,670 17,055 13,590 77,981 1,185 79,095 14,920 36,780 39,990 44,330 43,965 180,056 2,179
182,235 Not relevant Not relevant Sources: Analysis of the Report of Activities submitted by the childcare services, 2000-2001 and 2003-2004, Department of Family; Québec’s Institute of Statistics for number of children by age, and authors’ calculations.
1. About seven hundred 6-year-old kindergarten children are included and about half of the 5-year-old children are not in kindergarten
Table 3
Estimated effects of childcare regime on Québec’s mothers’ labour force participation, annual weeks and hours worked, and annual earnings for DDD estimation1
Equal policy effects
DDD
Unequal policy effects DDD Specification β1999-2004 or β2002-2004 Β1999 β2000 β2001 β2002 β2003 β2004 Participation (N=46,697) 0.019 -0.027 0.006 0.004 0.029 0.056 0.052 Bootstrapped Standard error 0.039 0.041 0.042 0.040 0.045 0.045 0.050
H0: Joint test of equal effects2 - 0.23
Participation (N=46,697)3 0.062 - - - 0.046 0.073* 0.069
Bootstrapped Standard error 0.040 - - - 0.041 0.041 0.048
Weeks of work (N=46,697) 0.68 -1.59 -0.49 0.15 1.22 1.91 3.13
Bootstrapped Standard error 2.00 2.10 2.08 2.09 2.33 2.31 2.49
H0: Joint test of equal effects - 0.23
Weeks of work (N=46,697)3 3.20 - - - 2.34 3.03 4.25*
Bootstrapped Standard error 2.07 - - - 2.10 2.14 2.37
Hours of work (N=44,777) 57 -70 -6 61 104 102 159
Bootstrapped Standard error 85 86 90 89 97 95 104
H0: Joint test of equal effects - 0.02
Hours of work (N=44,777)3 180** - - - 162* 159 217**
Bootstrapped Standard error 88 - - - 90 90 99
H0: Joint test of equal effects - - 0.40
Earnings (N=47,135) 1,919 520 1,912 1,311 2,936 1,365 3,541
Bootstrapped Standard error 1,596 1,679 1,702 1,680 1,895 1,855 2,378
H0: Joint test of equal effects - 0.26
Earnings (N=47,135)3 3,617* - - - 3,915** 2,342 4,512*
Bootstrapped Standard error 2,090 - - - 1,981 2,067 2,742
H0: Joint test of equal effects - - 0.20
1. Sample of mothers with at least one child 6 to 11 and no child less than 6 and mothers with at least one child 12 to 18 and no children less than 12.
2. All the tests show the p-values derived from a Chi-Square distribution (this also applies to the tests that follow).
3. In this specification the year effects of 1999 to 2001 of Québec’s policy are constrained to be zero. All the parameters related to the policy are modified in order to take this change into account.
Table 4
Estimated effects of childcare regime on Québec’s mothers’ labour force participation, annual weeks and hours worked, and annual earnings1
Equal policy effects Unequal policy effects
(1) DD (2)DDD (3) DD (4) DDD
Specification
β2002-2004 β2002 β2003 β2004 β2002 β2003 β2004
ALL MOTHERS
PANEL A: Participation2 N=24,420/46,697 N=24,420 N=46,697
Policy variables coefficients 0.049* 0.062 0.033 0.060* 0.056 0.046 0.073* 0.069 Bootstrapped Standard error 0.027 0.040 0.030 0.030 0.035 0.041 0.041 0.048
Joint test of equal policy effects3 - 0.63 0.63
PANEL B: Weeks of work2 N=24,420/46,697 N=24,420 N=46,697
Policy variables coefficients 2.87** 3.20 2.02 2.70* 3.91** 2.34 3.03 4.25*
Bootstrapped Standard error 1.40 2.07 1.50 1.58 1.69 2.10 2.14 2.37
Joint test of equal policy effects - 0.39 0.38
PANEL C: Hours of work2 N=23,396/44,777 N=23,396 N=44,777
Policy variables coefficients 110* 180** 93 91 145** 162* 159 217**
Bootstrapped Standard error 56 88 63 61 68 90 90 99
Joint test of equal policy effects - 0.44 0.40
PANEL D: Earnings2 N=24,589/47,135 N=24,589 N=47,135
Policy variables coefficients 1,161 3,617* 1,441 -125 2,088 3,915** 2,342 4,512* Bootstrapped Standard error 1,433 2,090 1,482 1,453 2,114 1,981 2,067 2,742
Joint test of equal policy effects - 0.20 0.20
MOTHERS from QUÉBEC and ONTARIO
PANEL E: Participation2 N=11,811/22,502 N=11,811 N=22,502
Policy variables coefficients 0.061* 0.073 0.047 0.072** 0.065* 0.059 0.084* 0.078 Bootstrapped Standard error 0.031 0.045 0.034 0.033 0.038 0.046 0.046 0.052
Joint test of equal policy effects - 0.68 0.66
PANEL F: Weeks of work2 N=11,811/22,502 N=11,811 N=22,502
Policy variables coefficients 3.42** 3.70 2.70 3.26* 4.33** 2.94 3.53 4.65*
Bootstrapped Standard error 1.59 2.33 1.70 1.74 1.84 2.36 2.38 2.60
Joint test of equal policy effects - 0.48 0.48
PANEL G: Hours of work2 N=11,348/21,634 N=11,348 N=21,634
Policy variables coefficients 137** 190* 124* 118* 169** 174* 170* 225**
Bootstrapped Standard error 66 100 73 71 77 103 102 110
Joint test of equal policy effects - 0.49 0.43
PANEL H: Earnings2
N=11,910/22,760 N=11,910 N=22,760
Policy variables coefficients 1,717 5,105** 2,122 450 2,500 5,493** 3,848 5,893* Bootstrapped Standard error 1,829 2,525 1,862 1,841 2,403 2,423 2,504 3,098
Joint test of equal policy effects - 0.19 0.20
1. Sample of mothers with at least one child 6 to 11 and no child less than 6 and mothers for DD estimation and mothers with at least one child 6 to 11 and no child less than 6 and mothers with at least one child 12 to 18 and no children less than 12 for DDD estimation. 2. In this specification the year effects of 1999 to 2001 of Québec’s policy are constrained to be zero. All the parameters related to the policy are modified in order to take this change into account (this also applies to the results that follow). 3. All the tests show the p-values derived from a Chi-Square distribution (this also applies to the tests that follow).