POCKMARKS DANS LE CHENAL LAURENTIEN,
ZONE D’OLD HARRY, GOLFE DU SAINT-LAURENT
(EST DU CANADA)
Mémoire présenté
dans le cadre du programme de maîtrise en océanographie en vue de l’obtention du grade de maître ès sciences
PAR
© NAÏS SIRDEYS
Composition du jury :
André Rochon, président du jury, UQAR-ISMER
Guillaume St-Onge, directeur de recherche, UQAR-ISMER
Jean-Carlos Montero-Serrano, codirecteur de recherche, UQAR-ISMER
Mathieu J. Duchesne, examinateur externe, Commission Géologique du Canada
UNIVERSITÉ DU QUÉBEC À RIMOUSKI Service de la bibliothèque
Avertissement
La diffusion de ce mémoire ou de cette thèse se fait dans le respect des droits de son auteur, qui a signé le formulaire « Autorisation de reproduire et de diffuser un rapport, un
mémoire ou une thèse ». En signant ce formulaire, l’auteur concède à l’Université du
Québec à Rimouski une licence non exclusive d’utilisation et de publication de la totalité ou d’une partie importante de son travail de recherche pour des fins pédagogiques et non commerciales. Plus précisément, l’auteur autorise l’Université du Québec à Rimouski à reproduire, diffuser, prêter, distribuer ou vendre des copies de son travail de recherche à des fins non commerciales sur quelque support que ce soit, y compris l’Internet. Cette licence et cette autorisation n’entraînent pas une renonciation de la part de l’auteur à ses droits moraux ni à ses droits de propriété intellectuelle. Sauf entente contraire, l’auteur conserve la liberté de diffuser et de commercialiser ou non ce travail dont il possède un exemplaire.
À ma famille, mes amis, et à Yannick.
REMERCIEMENTS
Dans un premier temps, je tiens à exprimer toute ma reconnaissance à mon directeur de maîtrise, Guillaume St-Onge. Je le remercie de m’avoir fait intégrer sa grande équipe et de m’avoir encadré, guidé, aidé et conseillé dans mes travaux de recherche. J’aimerais également le remercier pour les nombreuses opportunités de participation à des congrès, à des missions et aux cours spéciaux qui m’ont fait prendre part au monde de la recherche durant toute la durée de ma maîtrise.
Merci également à mon co-directeur Jean-Carlos Montero-Serrano pour ses commentaires pertinents et sa disponibilité.
Je remercie également André Rochon et Mathieu Duchesne qui offrent leur participation à l’évaluation de ce mémoire de maîtrise.
Un grand remerciement pour toutes ces personnes qui m’ont aidé dans cette étude. Je pense notamment à Pierre-Arnaud pour avoir suivi mon travail depuis le début du projet. Le traitement des données de profileur de sous-surface, les commentaires et corrections dans la rédaction de ce mémoire ont été très précieux.
Je pense également à Noela Sanchez qui m’a initiée au traitement de données multifaisceaux, à Yijie Li, doctorante de Huixiang Xie, pour ses explications sur le méthane dans le golfe, pour ses données et pour avoir pris le temps de répondre à toutes mes questions. Je suis aussi reconnaissante envers Daniel Bourgault pour m’avoir fourni les données de courants et pour avoir discuté de mes résultats.
J’aimerais ajouter que le temps passé en laboratoire n’aurait pas été si enrichissant sans l’aide du personnel de l’ISMER, un énorme merci donc, à Marie-Pier St-Onge, Quentin Beauvais, Claude Belzile, Mathieu Babin et Marie-Ève Anglehart. Je remercie tous les collègues du laboratoire de géologie marine de l’ISMER. Leurs précieux conseils, leurs
commentaires et leurs critiques ont constitué un soutien moral et scientifique indispensable pour l’avancement de ce projet.
Je voudrais adresser des remerciements aux étudiants de l’ISMER, de l’UQAR, le NÉMO et les camarades de promotion qui sont petit à petit devenus de véritables amis au soutien inconditionnel, dont les encouragements sans faille m’ont permis de porter ce projet jusqu’au bout.
Enfin, je remercie sincèrement et tendrement toute ma famille et surtout mes très chers parents, qui m’ont toujours soutenue et sans qui, cette aventure n’aurait pas été possible. J’éprouve une énorme gratitude envers tous mes amis proches qui, de plus ou moins loin, m’ont toujours portée par leurs encouragements.
À toutes ces personnes qui ont compté, je présente mes plus sincères remerciements, mon respect et toute ma reconnaissance.
RÉSUMÉ
Bien que les pockmarks soient très bien décrits dans de nombreuses régions du monde, ils demeurent peu documentés dans le golfe du Saint-Laurent. L’intérêt récemment accordé au prospect pétrolier et gazier extracôtier Old Harry dans le golfe du Saint-Laurent (est du Canada) jusqu’en juin 2018 a conduit à l’étude scientifique de la zone en 2015. La mission COR1503 menée à bord du N/R Coriolis II a révélé la présence de plus de 3000 évents peu profonds et de forme elliptiques dans le chenal Laurentien (entre 460 et 510 m). Cette étude permet de caractériser ces évents, d’identifier les processus liés à leur formation ainsi que les processus sédimentaires et la chronostratigraphie de l’environnement dans lequel ils se sont développés. L’approche multi-proxy utilisée combine des analyses géophysiques - 1 300 km de levée de profileur de sous-surface et 230 km2 de couverture multifaisceaux-,
avec des analyses de propriétés physiques, granulométriques, géochronologiques (datation au 14C) et magnétiques sur 7 carottes boîte et piston échantillonnées à trois stations (stations 01, 04 et 05). Le contexte sédimentaire visible sur les données de profileur de sous-surface et daté grâce aux carottes 01 et 04, comprend : l’unité 1, le till glaciaire ; l’unité 2, définie par les sédiments glaciomarins proximaux (avant 14,5 cal. ka BP); et enfin, l’unité 3 formée à partir de sédiments glaciomarins distaux (~ 14,5-8,5 cal. ka BP) et postglaciaires (8,5 cal. ka BP – aujourd’hui). La formation de pockmarks à la surface de l’unité 3 est causée par la migration de gaz mise en évidence par la présence de réflexions accentuées, de blancs acoustiques et de zones de turbidité acoustique à travers les unités seismo-stratigraphiques visibles. La distribution spatiale non-uniforme des évents est très probablement contrôlée par des conditions structurelles géologiques plus profondes (dôme de sels) associées à la stratigraphie des épisodes glaciaires/postglaciaires. Les caractéristiques morphométriques des pockmarks témoignent que les courants de fond agiraient comme principal moteur à l’origine de la dispersion des sédiments remis en suspension au moment du dégazage, leur conférant leur forme ellipsoïdale particulière et leur orientation uniforme NO-SE. Le doute persiste concernant l’activité récente de ces évents puisque les concentrations de méthane mesurées près des évents sont faibles.
Mots clés : pockmarks, chronostratigraphie, golfe du Saint-Laurent, Old Harry,
ABSTRACT
Even if pockmarks are well described in different areas around the world, they are still scarcely documented in the Gulf of St. Lawrence. The recent interest granted to the Old Harry's offshore petroleum prospect (Eastern Canada) until June 2018 led to the scientific investigation of this area in 2015. The COR1503 cruise onboard the R/V Coriolis II revealed the presence of more than 3000 shallow and elliptic-shaped pockmarks in the Laurentian Channel (between 460 and 510 m). For the first time in the gulf, it is possible to characterize these events, to identify the processes related to their formation, as well as the sedimentary processes and chronostratigraphy of the environment in which they developed. The multi-proxy approach used combines geophysical analyzes – 1300 km of subbottom profiler surveys and 230 km2 of multibeam coverage - with physical properties, grain-size,
geochronological (14C dating) and magnetic analysis of 7 box and piston cores sampled at three stations (01, 04 and 05). The sedimentary context imaged with the subbottom profiler surveys and dated using sediment cores 01 and 04 includes: Unit 1, the glacial till; Unit 2, defined by proximal glaciomarine sediments (before 14.5 cal. ka BP); and finally, Unit 3 formed from distal glaciomarine (~ 14.5-8.5 cal. ka BP) and postglacial (8.5 cal. ka BP - today) sediments. The formation of pockmarks on the surface of Unit 3 is due to gas migration evidenced by the presence of enhanced reflections, acoustic gas blanking and acoustic turbidity zones visible on the subbottom profiler data. The non-uniform spatial distribution of the pockmarks is most likely controlled by deeper geological structural conditions (salt dome) associated with the stratigraphy of glacial / postglacial episodes. The morphometric features of the pockmarks suggest that bottom currents act as the main driving force behind the dispersion of sediments resuspended at the time of degassing, giving them their particular ellipsoidal shape and their uniform orientation NW-SE. There is still some doubt about the recent activity of these vents, because of the low methane concentrations measured near the vents.
Keywords: pockmarks, chronostratigraphy, Gulf of St. Lawrence, Old Harry,
TABLE DES MATIÈRES
REMERCIEMENTS ... ix
RÉSUMÉ ... xi
ABSTRACT ... xii
TABLE DES MATIÈRES ... xiii
LISTE DES TABLEAUX ... xv
LISTE DES FIGURES ... xvi
INTRODUCTION GÉNÉRALE ... 1
1. PROBLEMATIQUE ... 1
2. OBJECTIFS DE LA RECHERCHE ... 9
3. EXPEDITION ET METHODOLOGIE ... 10
4. ORGANISATION DU MEMOIRE ET CONTRIBUTIONS ... 14
5. PRESENTATIONS OFFICIELLES LORS DE CONGRES ... 15
CHAPITRE 1 : POCKMARKS IN THE LAURENTIAN CHANNEL, OLD HARRY AREA, GULF OF ST. LAWRENCE (EASTERN CANADA) ... 13
1. INTRODUCTION ... 13
2. REGIONAL SETTINGS ... 18
2.1. Circulation ... 18
2.2. Geology and sedimentology ... 18
2.3. Quaternary stratigraphy ... 19
3. MATERIAL AND METHODS ... 21
3.1. Geophysical data and processing ... 21
4. RESULTS ... 27
4.1. Chronostratigraphic framework ... 27
4.2. Morphology and distribution of pockmarks ... 34
4.3. Acoustic anomalies ... 39
4.4. Bottom currents ... 43
5. DISCUSSION ... 44
5.1. Chronostratigraphic framework of the Old Harry area ... 44
5.2. The morphometric parameters of pockmarks: clues on their formation processes ... 46
5.3. Are the pockmarks active? ... 47
5.4. Distribution of the pockmarks and gas migration ... 49
6. CONCLUSION ... 52
7. ACKNOWLEDGEMENTS ... 54
CONCLUSION GÉNÉRALE ... 55
ANNEXES ... 61
LISTE DES TABLEAUX
Table 1. Location, water depth and length of sediment cores used in this study ... 21 Table 2. Radiocarbon ages in 14C conventional and calibrated ages ... 25 Table 3. Summary of the regional seismostratigraphy in the Laurentian Channel, in the Gulf of St. Lawrence, in the Old Harry area ... 29 Table 4. Statistics for the n = 3067 pockmarks: seafloor depth (z2), depth to
pockmark rim (z1) pockmark depth (d), perimeter (p), length (L), width (l), orientation
LISTE DES FIGURES
Figure 1. Carte régionale des aires de distribution des caractéristiques sédimentaires liées au gaz dans le golfe du Maine, le plateau Écossais et le golfe du Saint-Laurent. Modifiée et extraite de Fader et al., (1991) ... 4 Figure 2. A. Carte de la bathymétrie obtenue par échosondeur multifaisceaux de l’estuaire du Saint-Laurent et la localisation du train de pockmarks de Matane (MPT), B. Vue en perspective du MPT basé sur cinq profils sismiques parallèles (sparker). Extraites de Pinet et al., (2008) ... 6 Figure 3. A. Localisation du gisement potentiel d’Old Harry. Extraite de Bourgault et al. (2014) ; B. Aperçu en 3D du réservoir d’Old Harry (inspirée de Coalition Saint-Laurent, 2014 ; source Corridor Ressources) ... 9 Figure 4. A. Mise à l’eau du long carottier à piston de 9 m. B. Mise à l’eau du carottier à boîte (Crédit : Daniel Bourgault, UQAR-ISMER). C. Sous-échantillonnage des carottes en laboratoire (Crédit : Sarah Letaïef, ISMER/UQAR) ... 13 Figure 5. A. Bathymetric map of the Gulf of St. Lawrence with the Laurentian Channel and the position of the Old Harry prospect site (red rectangle), the main currents and the provinces borders (Modified from Shaw et al., 2002). The green zone corresponds to the salt withdrawal zone based on Lavoie et al. (2009). - P.E.I: Prince Edward Island. B. Overall bathymetry of the OHA with the multibeam coverage, the subbottom profiler lines (black lines) and the location of the potential exploration well (purple point), coring sites (01, 04 and 05), ADCPs mooring, and stations where methane profiles have been collected ... 17 Figure 6. Schema of an individual pockmark as described in this study (modified from Andrews et al., 2010). A is the surface of the pockmarks (m2), V is the volume (considered here as a half-ellipsoid), z1 is the depth to the pockmark rim in m, z2 is the
seafloor depth in m, d is the pockmark depth in m, p is the perimeter in m, L is the length of the pockmark in m, W is the width of the pockmark in m and θ is the orientation in degrees, from the North (geographic) ... 22
Figure 7. Subbottom profiler lines (uppermost: line 104, lowermost: line 110) before (left) and after interpretation (right) along with the sampling locations of cores 01PC and 04PC cores ... 30 Figure 8. Sedimentological analysis for cores (A) 01PC and (B) 04PC, (left to right): CAT-scan images with the CT numbers, digital imaging, the diffuse spectral reflectance (a*), the split-core magnetic susceptibility (kLF), the mean grain-size and
the clay and silt fractions. The calibrated radiocarbon ages of Table 2 are reported in the boxes ... 31 Figure 9. Age models for composite cores 01 and 04; the red line shows the best age model and the grey dashed lines represent the chronological uncertainties (95% confidence interval) with their sedimentation rates in green; the vertical blue dashed lines depict the important changes in the sedimentation rates around 8.5 cal. ka BP; the colored rectangles correspond to the lithostratigraphic units described in the text ... 32 Figure 10. Relative sea-level plotted from Shaw et al., (2002) and Clark et al., (1978) at Port-au-Port (closest point to Old Harry) with a* and kLF values of the composite
core 01 ... 32 Figure 11. A. Comparison between box cores sampled in a pockmark (05BC) and a reference core (01BC) collected outside a pockmark; B. Carbonate concretion found in core 05BC, typical of areas where methane is generated and C. One sample of the same carbonate concretion of (B) ... 33 Figure 12. A. Bathymetric map of the Old Harry area with the 3067 pockmarks (black points). The size of the black points is proportional with the pockmarks depth (d); B. Zoom of the bathymetric map where we can see pockmarks and their orientations; C. Depth profile of one randomly selected pockmark. Its morphometry is similar to the general trend, shallow (~ 6 m deep), very elongated (~130 m length) and with a NW-SE orientation ... 36 Figure 13. A. Bathymetric map of the Old Harry area with the 3067 pockmarks (black points); the size of the black points is proportional with the pockmarks depth (d); B. Backscatter image of the Old Harry area; C. View of the density (Kernel) of pockmarks in the Old Harry ... 38 Figure 14. Seismo-stratigraphic units identified on the sub-bottom acoustic data of the line 102 in the Old Harry area; upper panel: uninterpreted profile, lower panel: interpreted profile ... 41
Figure 15. Examples of acoustic anomalies and their respective potential interpretations are illustrated in figures A, B, C: A. Acoustic turbidity beneath pockmarks (free bubbles within sediment pores); B. Enhanced reflections (gas accumulation) and C. Vertical acoustic blanking disturbing reflectors (seismic/gas chimneys) ... 42 Figure 16. Bottom currents from the ADCP (in number of measurements) acquired from November 4 2013 until the October 21 2014, are oriented in the same orientation as the pockmarks ... 43 Figure 17. Methane profiles around the OHA demonstrating low methane concentrations at the bottom (< 10 nM) (Li et al., 2018) ... 48 Figure 18. Conceptual model illustrating how fluid migrates through pathways across the Upper Carboniferous rocks and the deglacial stratigraphy of marine sediments of the Gulf of St. Lawrence until the formation of the pockmarks; the combination of the degassing and (A) the bottom currents (B) are responsible for the general trend in the orientation of the pockmarks in this area ... 51
INTRODUCTION GÉNÉRALE
1. PROBLEMATIQUE
Les pockmarks : définition et historique dans l’estuaire et le golfe du Saint-Laurent
King et McLean (1970) décrivent pour la première fois des structures sédimentaires sous forme de dépressions à fonds coniques sur le fond marin du plateau continental néo-écossais dans l’est du Canada. Ces dépressions sont causées par les remontées de fluides (gaz ou liquides) d’eau ou plus généralement de méthane (Judd et Hovland, 2007). Pouvant atteindre des dizaines de kilomètres de diamètres pour quelques mètres de profondeur seulement, elles sont appelées : des pockmarks.
L’intérêt d’étudier les pockmarks et leur formation est multiple. En raison de leur impact local sur la chimie, le cycle du carbone, la faune et la flore marine, la morphologie des fonds marins, les pockmarks modifient la structure des sédiments et l'environnement marin (Szpak, 2015 ; Picard et al., 2018). L’étude de leur distribution permet, entre autres, de connaître l’origine des fluides et leurs mécanismes de migration (ex., Gay et al., 2006a ; Pilcher and Argent, 2007 ; Pinet et al., 2009) en révélant des réseaux de migration et les sources des fluides (ex., réservoirs d’hydrocarbures, hydrates de gaz). Par conséquent, leur utilisation se révèle pertinente pour l'exploration d'hydrocarbures (Fader et al., 1991), la caractérisation de la faune liée à la chimiosynthèse (Sumida et al., 2004), la compréhension des processus d'écoulement des fluides et des risques géologiques (Hovland et al., 2002) ainsi que la détection de ressources minérales (ex., les hydrates de gaz) (Judd et Hovland, 2007).
La multitude d’environnements dans lesquels les évents se forment induisent un nombre conséquent de mécanismes à l’origine de leur formation. Nous nous intéresserons ici qu’à ceux se produisant en milieux marins.
Parmi les mécanismes les plus récurrents dans la littérature, il y a l’expulsion de fluides (Judd et Hovland, 1992). Cependant, d'autres processus peuvent entrer en jeu, tels que la tectonique salifère générant des failles au-dessus de réservoirs d’hydrocarbures favorisant ainsi la migration des fluides le long de celles-ci jusqu’à la formation des évents comme au Mexique ou encore dans le bassin inférieur du Congo (Wenau et al., 2017 ; Rowan et al., 1999 ; Whelan et al., 2005). Les variations du niveau marin et les cycles de marées induisent des variations de la pression hydrostatique sur les sédiments menant à une différence de pression interstitielle dans les pores des sédiments. Ces variations de pression sont à l’origine de l’expulsion de gaz (« plumes ») formant les pockmarks (Rollet et al., 2006 ; Riboulot et al., 2014). Hovland et Judd (1988) décrivent également différents cas où les eaux souterraines seraient à l’origine de la formation de pockmarks le long des côtes, comme cela a été le cas au large de la Caroline du Sud ou en Floride (États-Unis) (Manheim, 1967), ou encore dans le golfe de Corinthe (Grèce) (Christodoulou et al., 2003). Les mécanismes en jeu impliquent la présence de sources d’eau douce souterraines sur le continent, situées au-dessus du niveau marin. Cette eau douce rejoint la mer par des tunnels souterrains naturellement dénivelés en formant des pockmarks aux endroits où l’eau douce est expulsée. Des perturbations sur le fond marin, d’origines naturelles ou anthropiques, sont aussi responsables de la formation d’évents. Par exemple, l’affouillement du fond marin par des icebergs, l'érosion par les courants de fond ou encore le chalutage anthropique perturbent les sédiments et donc modifient la pression lithostatique générant ainsi l’expulsion de fluides desquelles résultent des évents allongés, parfois reconnaissables sous-forme de « train » (Fader, 1991 ; Pilcher et Argent, 2007 ; Kilhams et al., 2011).
Dans le golfe du Saint-Laurent, les pockmarks sont très peu documentés (ex., Pinet et al., 2008). Pourtant ces structures se forment majoritairement dans des environnements de sédiments fins de type argiles fines (Judd et Hovland, 2007) très présents dans l’estuaire et
le golfe du Saint-Laurent (EGSL). En effet, l’histoire sédimentaire récente de l’EGSL est étroitement liée à la dernière glaciation wisconsinienne et à la déglaciation subséquente (Shaw et al., 2002, 2006). Les différentes unités sédimentaires constituent de véritables reliquats des conditions environnementales qui se sont succédées au cours de la déglaciation. Par conséquent, le fort potentiel en réserves d’hydrocarbures de l’EGSL (Lavoie et al., 2010 ; Séjourné et Malo, 2015) couplé aux unités sédimentaires glaciomarines et post-glaciaires (sédiments cohésifs) confèrent des conditions favorables à la formation de pockmarks sur le fond marin (Fader, 1991 ; Hovland et Judd, 2007).
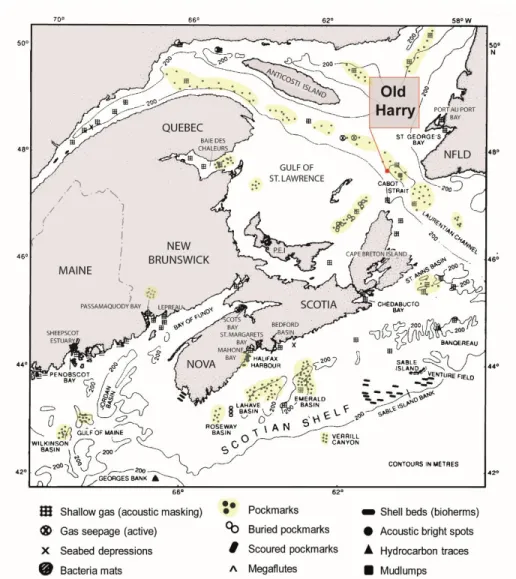
C’est en 1991, qu’un premier recensement des caractéristiques sédimentaires liées à la présence de gaz sur le plateau continental de l’Est du Canada est publié (Fader et al., 1991). Généralement générées par le suintement de méthane, ces structures cartographiées pour la première fois dans l’Est du Canada sont très répandues et comptent parmi elles un nombre considérable de champs de pockmarks (Fig. 1 ; Hovland et Judd, 1988 ; Fader, 1991). Cependant, de nombreuses zones d’ombres méritent encore d’être éclairées dans cette région : quels processus sont à l’origine de leurs formations ? Quels types de fluides sont en jeux ? D’où proviennent-ils ?
Figure 1. Carte régionale des aires de distribution des caractéristiques sédimentaires liées au gaz dans le golfe du Maine, le plateau Écossais et le golfe du Saint-Laurent. Modifiée et extraite de Fader et al., (1991)
Les observations sismiques et celles obtenues à partir de submersibles dans l’estuaire du Saint-Laurent, dans le Nord-Ouest du chenal Laurentien et du golfe du Saint-Laurent, ainsi que la baie des Chaleurs (Syvistki et al., 1983a ; Syvitski et Praeg, 1989 ; Josenhans et al., 1990), dévoilent des anomalies sismiques dans les successions sédimentaires récentes, telles que des réflexions accentuées, des blancs et des zones de turbidité acoustiques. Ces
anomalies sont des témoins de la migration de gaz à travers les sédiments jusqu’à la surface où l’expulsion du gaz formera un pockmark. D’après Josenhans et al. (1990), les pockmarks et leurs anomalies se développeraient dans des aires situées au-dessus de socles rocheux carbonifères.
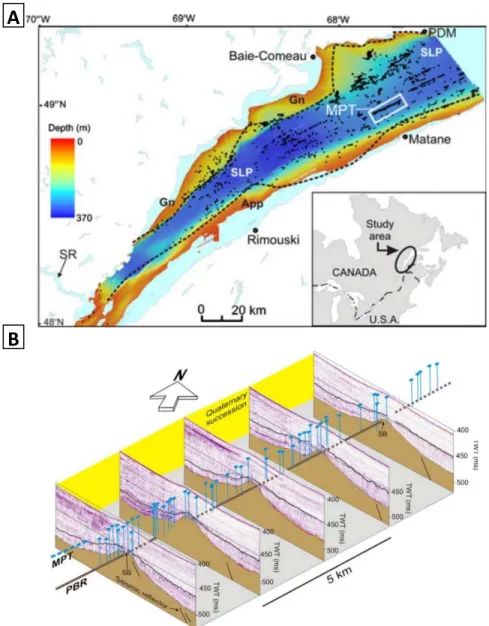
La compilation de données bathymétriques et sismiques entre 1997 et 2007, dans l’estuaire maritime du Saint-Laurent atteste que la présence de ces évents de méthane y est considérable, et particulièrement dans le chenal Laurentien (Bolduc et al., 2008 ; Pinet et al., 2008) (Fig. 2A). Plusieurs études entièrement dédiées à ce champ de pockmarks voient le jour, et de multiples réponses sont apportées concernant l’origine des gaz émis, les processus de formation des pockmarks à travers leur distribution particulière (Pinet et al., 2009), ou encore la présence anormale de concrétions carbonatées dans les évents (Lavoie et al., 2010). Ainsi, la distinction s’établie entre un premier type de pockmarks formés à partir de méthane thermogénique en provenance de la plateforme du Saint-Laurent, au-dessus des successions paléozoïques renfermant de potentiels réservoirs d’hydrocarbures et dont les suintements sont à l’origine de la formation des pockmarks (~ 90% des pockmarks observés, Lavoie et al., 2010). En effet, les blancs acoustiques interceptant le socle rocheux datant du paléozoïque et les successions sus-jacentes jusqu’au fond marin sont visibles sur les données sismiques et forment en réalité des conduits de migration des fluides. De plus, ces pockmarks sont distribués de façon linéaire, formant des « trains de pockmarks » d’environ 15 km de long suivant des structures géologiques dans le toit de la plateforme du Saint-Laurent (Fig. 2B). Le second type de pockmarks regroupe des évents formés par l’émission de méthane microbien dans les zones proches de l’embouchure des rivières de la Côte-Nord du Québec, où l’accumulation de matière organique couplée aux fortes vitesses de sédimentation favorisent la formation de méthane dans les sédiments peu profonds (Pinet et al., 2008).
Figure 2. A. Carte de la bathymétrie obtenue par échosondeur multifaisceaux de l’estuaire du Saint-Laurent et la localisation du train de pockmarks de Matane (MPT), B. Vue en perspective du MPT basé sur cinq profils sismiques parallèles (sparker). Extraites de Pinet et al., (2008)
A
Les hydrocarbures dans le golfe et le cas controversé du gisement potentiel Old Harry Au cours des années 1990, l’avènement de nouvelles technologies a intensifié les activités d’exploration pétrolières le long de la Gaspésie, de l’île d’Anticosti et des Îles de la Madeleine (Keen et Williams, 1990 ; Pêches et Océans Canada, 2005). La présence de roches poreuses et imperméables dans les successions lithologiques du golfe du Saint-Laurent favorise la formation de réservoirs d’hydrocarbures et lui confère un fort potentiel économique (Lavoie et al., 2009 ; Séjourné et Malo, 2015).
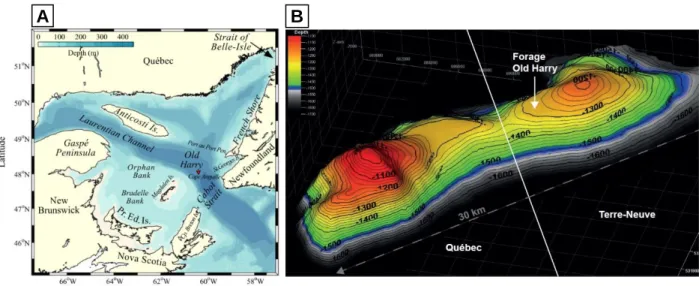
Parmi les zones du golfe qui suscitent de l’intérêt, il y a la structure géologique Old Harry. Celle-ci longue de 30 km, constituerait le plus gros gisement d’hydrocarbures du golfe (Fig. 3). Elle a fait l’objet d’une multitude d’estimations concernant le volume et la quantité de barils d’hydrocarbures récupérables : 1,5 milliards d’après la Commission géologique du Canada (Lavoie et al., 2009), 5 milliards d’après Corridor Ressources (Colcleuh et Marchesin, 2013) ou encore 98,8 millions d’après l’Institut National de la Recherche scientifique (Séjourné et Malo, 2015). En 2011, la firme Corridor Ressources dépose une demande de permis d’exploration pour le prospect Old Harry engendrant de vives réactions de la part de la communauté civile. En effet, ce potentiel gisement a hérité son nom du village de pêcheurs éponyme, situé à seulement 80 km, sur les touristiques et très prisées Îles de la Madeleine. Lors de rencontres et de présentations du projet, Corridor Ressources énonce que des images satellitaires auraient permis de détecter six manifestations de suintement de pétrole à la surface de l’eau sur les flancs du prospect Old Harry (Corridor Ressources Inc., 2000-2005). Ces affirmations ont été par la suite vivement critiquées par la communauté scientifique qui a dénoncé un manque de transparence. En effet, ces données définies comme « commercialement sensibles » par leurs propriétaires (Bourgault et al., 2017) ne sont pas accessibles et ne peuvent donc pas être vérifiées. En raison de sa situation géographique et des difficultés d’établir les risques et les enjeux liés à l’exploration, le ministère fédéral demande la mise en place d’un processus d’évaluation environnementale actualisé et approfondi. En découlent des évaluations environnementales stratégiques menées par le Québec et une mise à jour des évaluations environnementales du
projet d’Old Harry par Corridor et ses consultants. Le constat est équivoque, le manque de connaissances sur l’écosystème marin du golfe et son fonctionnement est flagrant. Les informations disponibles ne sont pas suffisantes pour prendre une décision sensée pour sécuriser une campagne d’exploration et d’exploitation à Old Harry (GENIVAR, 2013 ; Archambault et al., 2017). Bien qu’à ce jour, Corridor ait suspendu les activités exploratoires pour le projet de forage d’Old Harry (Corridor Ressources Inc, juin 2018), d’autres projets pourraient éventuellement émerger, d’où l’importance de mieux comprendre le fonctionnement de cette partie du golfe (Archambault et Toussaint, 2016).
Des travaux préliminaires sur la dispersion d’hydrocarbures et de polluants autour de la structure Old Harry voient le jour en 2014 (Bourgault et al., 2014). Les simulations mettent en scène un traceur passif soumis à la circulation de surface et retrace sa trajectoire sur différentes durées. D’après ces résultats, les côtes les plus touchées en cas de déversement d’hydrocarbures seraient celles du Cap Breton, de l’ouest et du sud-ouest de Terre-Neuve et, de façon mineure, les Îles de la Madeleine.
À la lumière de ces premières conclusions, une campagne océanographique (nommée COR1503) est mise en place en 2015 dans le but d’étudier l’environnement du golfe du Saint-Laurent autour de la zone du prospect (Bourgault et al., 2015). L’objectif est d’apporter plus de connaissances sur cette zone et c’est dans ce cadre que s’inscrit ce projet de maîtrise.
Figure 3. A. Localisation du gisement potentiel Old Harry. Extraite de Bourgault et al. (2014) ; B. Aperçu en 3D du toit du réservoir Old Harry (inspirée de Coalition Saint-Laurent, 2014 ; source Corridor Ressources)
2. OBJECTIFS DE LA RECHERCHE
Le principal objectif de ce projet de maîtrise est de proposer un modèle conceptuel de migration de fluides à travers les unités stratigraphiques présentes à Old Harry. Pour ce faire, ce projet de recherche s’appuie sur trois sous-objectifs spécifiques : (1) caractériser le contexte sédimentaire de la zone d’étude ; (2) identifier et déterminer la morphométrie des évents (pockmarks) ; et enfin (3) caractériser les processus impliqués dans leur formation et qui influencent leur morphométrie.
3. EXPEDITION, DONNEES ET METHODOLOGIE
Mission en mer
La campagne en mer s’est déroulée du 8 au 14 juin 2015 à bord du N/R Coriolis II où près de 1 300 km de lignes géophysiques ont été acquises, ainsi que des échantillons de sédiments à dix stations et des profils de la colonne d’eau à quatre stations (Rémillard et al., 2015). Une aire de 230 km2 autour du site d’Old Harry a été cartographiée à haute résolution à l’aide d’un échosondeur multifaisceaux et plus de 3000 évents ont été identifiés. Quatre carottes à piston ont été déployées avec quatre carottiers à gravité agissant comme déclencheur, et cinq carottiers à boîte furent également prélevés aux mêmes stations. Ces derniers ont permis de conserver l’interface eau/sédiment.
Le jeu de données et la méthodologie
Ce mémoire de maîtrise regroupe un jeu de données basé sur l’analyse des données géophysiques (multifaisceaux et de profileur de sous-surface), carottes sédimentaires prélevées pendant la mission COR1503 (Fig. 4) et des données courantologiques. Dans un premier temps, les 230 km2 de couverture bathymétrique ont été traitées avec le logiciel
CARIS pour créer une carte bathymétrique à haute résolution de la zone d’étude qui se situe entre 450 et 510 m de profondeur dans le chenal Laurentien. Près de 3 000 évents ont ainsi été identifiés et géolocalisés manuellement dans ArcGIS à partir de ces données. Une fois dénombrés, le logiciel a permis d’extraire toutes les caractéristiques morphométriques (profondeur, périmètre, surface, forme, orientation) de chaque pockmark à partir desquelles des traitements statistiques ont été effectués dans le but de comprendre leur distribution. En complément de la bathymétrie, l’échosondeur multifaisceaux apporte des informations concernant la nature des sédiments de surface grâce à l’interprétation du signal de rétrodiffusion qui, selon la nature du fond marin, sera plus ou moins fort (e.g. présence de sédiments meubles vs. sédiments indurés). Ce signal a également été utilisé pour l’interprétation des données.
Les données de profileur de sous-surface, composées de plus de 1 300 km de levés, ont offert une vision en profondeur des sédiments récents. Tout d’abord, le jeu de données a été traité (correction de la houle à l’aide d’une moyenne mobile, amélioration de la visibilité des données) à l’aide des logiciels Dejitter, VISTA et Kingdom Suite. Ce dernier logiciel a également permis de visualiser et d’identifier les réflexions délimitant les multiples unités/faciès sédimentaires qui témoignent des différents régimes sédimentaires qui se sont succédés depuis la déglaciation permettant ainsi de compléter les études seismo-stratigraphiques déjà menées dans le golfe du Saint-Laurent (Loring et Nota, 1973 ; Syvitski et Praeg, 1989 ; Josenhans et Lehman, 1999, Casse et al., 2017). Ces données ont également permis de distinguer des anomalies typiques de la présence de gaz dans les sédiments marins et ainsi de développer un modèle de migration de fluides à travers la stratigraphie superficielle au-dessus de la structure d’Old Harry
Pour intégrer les carottes dans le contexte seismo-stratigraphique déterminé à partir des données de profileur de sous-surface, il a été nécessaire d’analyser leurs différentes propriétés physiques, granulométriques, géochronologiques (datation au 14C) et magnétiques sur 7 carottes boîte et piston échantillonnées à trois stations (stations 01, 04 et 05). Pour ce faire, les carottes ont été mesurées au MSCL (Multi-Sensor Core Logger) à des intervalles de 1 cm pour la mesure de la densité (par atténuation des rayonnements gamma) et des ondes P, puis au rayon-X à l’aide du tomodensitomètre (CAT-scan), permettant d’acquérir des images de leurs structures internes. Les carottes ont ensuite été ouvertes, puis repassées au MSCL en mode demi-section afin d’obtenir, pour chaque carotte, une photo à haute résolution ainsi que des données de spectrophotométrie et de susceptibilité magnétique. Les coquilles trouvées ont été prélevées, sélectionnées et envoyées dans un laboratoire où les âges 14C ont été obtenus puis corrigés avec l’aide du package Bacon dans le logiciel R. Les modèles d’âges ont été construits avec les vitesses de sédimentation. Nous avons prélevé des sédiments tous les 10 cm pour les mesures granulométriques (granulomètre laser).
Pour conclure sur les méthodes utilisées dans ce projet, des mesures courantologiques issues d’un mouillage de profileurs à effet Doppler (ADCPs) positionné proche de la zone d’étude (47° 59,910 N ; 60° 30,714 O) pendant 11 mois (de novembre 2013 à octobre 2014), ont été utilisées pour établir une relation entre les courants de fond et l’orientation préférentielle des pockmarks. Par conséquent, seules les mesures effectuées entre 320 et 420 m ont été prises en compte pour être représentées sur une rose de courants.
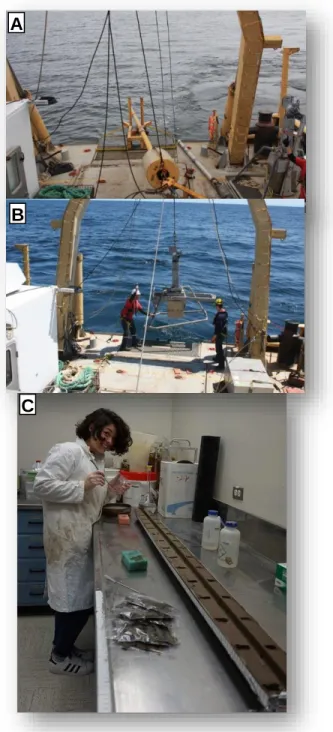
Figure 4. A. Mise à l’eau du long carottier à piston de 9 m. B. Mise à l’eau du carottier à boîte (Crédit : Daniel Bourgault, UQAR-ISMER). C. Sous-échantillonnage des carottes en laboratoire (Crédit : Sarah Letaïef, ISMER/UQAR)
A
C B
4. ORGANISATION DU MEMOIRE ET CONTRIBUTIONS
Ce mémoire est présenté sous la forme d'un article scientifique rédigé en anglais. Il décrit la chronostratigraphie depuis la dernière déglaciation et met en évidence la présence d’un champ d’évents (pockmarks) dans la zone d’Old Harry. L'article devrait être soumis prochainement à la revue Marine Geology sous la référence :
Sirdeys, N., St-Onge, G., Desiage, P.-A., Montero-Serrano, J.-C., Li, Y., Xie, H., Sànchez, N., Bourgault, D., sera soumis prochainement. Pockmarks in the Laurentian Channel, Old Harry area, Gulf of St. Lawrence (Eastern Canada). Marine Geology.
Ma contribution à ce mémoire prend en compte l’ensemble des analyses sur les carottes en laboratoire hormis les mesures isotopiques et élémentaires, celles de 14C et les mesures de méthane qui ont respectivement été effectuées au laboratoire du CAIR (ISMER), l’Université Laval/UC et l’ISMER (équipe de H. Xie).
J’ai traité, corrigé et interprété les données géophysiques qui comprennent les données de multifaisceaux et de profileur de sous-surface. Pour ce faire, j’ai eu la chance d’être formée et aidée par Noela Sànchez (CESIMAR) et Pierre-Arnaud Desiage (UQAR-ISMER). En effet, ils m’ont respectivement aidée pour le traitement des données bathymétriques et l’utilisation de divers logiciels de traitement et visualisation des données. J’ai également pu avoir accès aux données de méthane échantillonnées par Yijie Li (UQAR-ISMER), étudiante au doctorat de Huixiang Xie (UQAR-ISMER), ainsi qu’aux données de courants d’ADCP acquises par Daniel Bourgault (UQAR-ISMER). Ces deux types d’informations m’ont permis de compléter mon article en apportant plus de précisions sur les pockmarks.
Dans la suite de ces mesures, j’ai également traité et interprété toutes mes données, puis rédigé ce mémoire sous la précieuse supervision de Guillaume St-Onge et Jean-Carlos Montero-Serrano qui ont su apporter un regard d’expert sur mes données dans les domaines clés de mon projet tels que la chronostratigraphie, sédimentologie et la géomorphologie.
5. PRESENTATIONS OFFICIELLES LORS DE CONGRES
Au cours de ma maîtrise, j’ai eu l’occasion de participer à des congrès scientifiques de différentes envergures et à diverses reprises pour présenter mon projet, et ainsi le confronter aux regards de la communauté scientifique, tel que présenté ci-dessous :
Sirdeys, N., St-Onge, G., Desiage, P.-A., Montero-Serrano, J.-C., Sànchez, N., 2017. Sedimentary processes and Quaternary stratigraphy in the Old Harry area, Gulf of St. Lawrence. Affiche lors du congrès annuel des étudiants du GEOTOP, 22-24 mars, Forêt de Montmorency, Québec (QC) Canada.
Sirdeys, N. 2017. Old Harry : le gisement controversé du Golfe du Saint-Laurent. Présentation orale à l’École d’été de l’ISMER Mai 2017, Rimouski (QC) Canada.
Sirdeys, N., St-Onge, G., Desiage, P.-A., Montero-Serrano, J.-C., Sànchez, N., 2017. Sedimentary processes and Quaternary stratigraphy in the Old Harry area, Gulf of St. Lawrence. Présentation orale lors du 14th International Estuarine Biogeochemistry Symposium (IEBS), 4-7 juin, Rimouski (QC) Canada.
Sirdeys, N., St-Onge, G., Desiage, P.-A., Montero-Serrano, J.-C., Sànchez, N., 2017. Sedimentary processes and Quaternary stratigraphy in the Old Harry area, Gulf of St. Lawrence. Affiche lors du congrès Arctic Change, 11-15 décembre, Québec (QC) Canada.
Sirdeys, N., St-Onge, G., Desiage, P.-A., Montero-Serrano, J.-C., Sànchez, N., 2018. High-resolution paleoenvironmental reconstruction of the Old Harry area since the last deglaciation, Gulf of St. Lawrence. Présentation orale lors du congrès annuel des étudiants du GEOTOP, 21-23 mars, La Malbaie (QC) Canada.
Sirdeys, N., St-Onge, G., Desiage, P.-A., Montero-Serrano, J.-C., Li., Y., Xie, H., Sànchez, N., 2018. Chronostratigraphy and evidence of gas seeps in the Old Harry area, Gulf of St. Lawrence. Affiche lors du 20th International Sedimentary Congress, 12-17 août, Québec (QC) Canada.
CHAPITRE 1 :
POCKMARKS IN THE LAURENTIAN CHANNEL, OLD HARRY AREA, GULF OF ST. LAWRENCE (EASTERN CANADA)
Naïs Sirdeys1,*, Guillaume St-Onge1, Pierre-Arnaud Desiage1, Jean-Carlos
Montero-Serrano1, Noela Sanchez2
1 Institut des sciences de la mer de Rimouski, Canada Research Chair in Marine Geology, Université du Québec à Rimouski and GEOTOP, 310 allée des Ursulines, Rimouski, Québec, G5L 3A1, Canada
2 Centro Para el Estudio de Sistemas Marinos (CESIMAR), CONICET, Puerto Madryn, Argentina
1. INTRODUCTION
Because they are relevant to hydrocarbon exploration, pockmarks are one of the most described seafloor seeps in the literature (Judd and Hovland, 2009). These decimeter- to kilometer-scale seabed depressions were first described in Eastern Canada on the Scotian Shelf by King and MacLean (1970). Since then, numerous studies were conducted around the world revealing the presence of pockmarks in numerous places: along coastlines (Brothers et al., 2011; 2012), continental shelves (King and MacLean, 1970; Riboulot et al, 2014), and in deep oceanic basins (Gay et al., 2006).
Commonly, pockmarks are physically generated by the removal of seafloor sediments by escaping fluids (Judd and Hovland, 1992). In addition, other mechanisms influence fluid escape depending on the region such as: bottom current erosion (Rebesco et al., 2014), salt tectonic (Wenau et al., 2017; De Mahiques et al., 2017), sea-level changes and tidal cycles
(Rollet et al., 2006; Riboulot et al., 2014), compacted pore water escape (Harrington, 1985), groundwater expulsion (Christodoulou et al., 2003), iceberg scouring (Pilcher and Argent, 2007) and anthropic trawling (Fader, 1991).
Typically, the fluids involved in their formation is gas, and generally methane (Judd and Hovland, 2009). Methane signatures could be microbial and produced by the bacterial degradation of organic matter in a high sedimentation rates environment (e.g., at Passamaquody Bay, Brothers et al., 2012), or thermogenic and coming from deeper hydrocarbon deposits such as in the Hammerfest Basin, SW Barents Sea (Ostanin et al., 2013), the Lower Congo Basin (Gay et al., 2006a; Wenau et al., 2017) and in the St. Lawrence Estuary (Pinet et al., 2008; 2009). Due to their local impact on the chemistry, the carbon cycle, the biologic benthic communities and the morphology of the seabed, pockmarks modify the sediment structures and the environment (Szpak et al., 2015; Picard et al., 2018). Consequently, they are used as tools for hydrocarbon exploration (Fader et al., 1991), characterization of chemosynthetic-related fauna (Sumida et al., 2004), understanding fluid flow processes and geohazards (Hovland et al., 2002), and the detection of mineral resources (Judd and Hovland, 2009).
In 2008, Pinet et al. revealed the presence of more than 2000 pockmarks in the St. Lawrence Estuary. They discovered a link between their formation and the presence of hydrocarbon reservoirs in the St. Lawrence Platform known to contain a high potential of hydrocarbon deposit (St-Antoine et Héroux, 1993; Bolduc et al., 2008). Their measurements presented thermogenic signature of the methane from the pockmarks located above the St. Lawrence Platform.
The Gulf of St. Lawrence (GSL) is also known for its hydrocarbon potential and also allows fluid migration responsible of erosive features on the seabed (Lavoie et al., 2009). In addition, pockmarks are widespread in the Laurentian Channel, but they are still scarcely documented (Fig. 1; Fader et al., 1991; Archambault et al., 2016).
In 2015, an oceanographic expedition (COR1503) was conducted onboard the R/V Coriolis II near the Old Harry offshore oil and gas prospect (Fig. 5) where a high-resolution geophysical survey (multibeam echosounder and subbottom profiler) and sediment cores were acquired to propose a conceptual model of gas migration throughout the stratigraphic units at the Old Harry area (OHA). Specifically, we will (1) characterize the sedimentary setting of the OHA, (2) identify and determine the morphometry of pockmarks and (3) determine the processes involved in their formation and morphology.
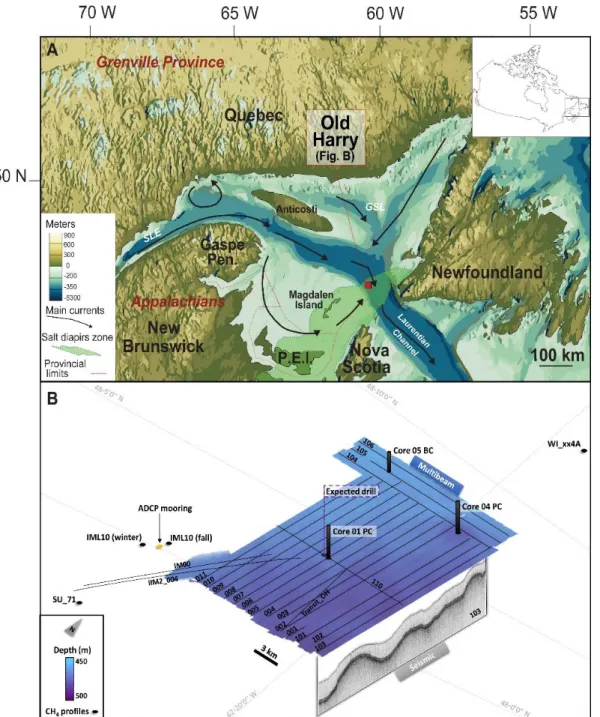
Figure 5. A. Bathymetric map of the Gulf of St. Lawrence with the Laurentian Channel and the position of the Old Harry prospect site (red rectangle), the main currents and the provinces borders (Modified from Shaw et al., 2002). The green zone corresponds to the salt withdrawal zone based on Lavoie et al. (2009). - P.E.I: Prince Edward Island. B. Overall bathymetry of the OHA with the multibeam coverage, the subbottom profiler lines (black lines) and the location of the potential exploration well (purple point), coring sites (01, 04 and 05), ADCPs mooring, and stations where methane profiles have been collected
2. REGIONAL SETTINGS
2.1. Water circulation
The GSL is a 226 000 km2 basin. Located in the eastern part of Canada between Nova Scotia, eastern Quebec, New-Brunswick, and the Newfoundland-and-Labrador provinces. It acts as a transitional zone between the St. Lawrence River and the Northwest Atlantic Ocean thanks to the Belle Isle Strait in the North and the Cabot Strait in the South (Fig. 5).
The gulf is characterized by an estuarine circulation with low salinity in the surface layer (S ~ 25-32) flowing seaward, whereas intermediate (S ~ 31.5-33) and deep (S ~ 34-35) saltier layers flowing landward (Koutitonsky et Bugden 1991). The annual mean circulation is characterized by five main coastal currents: the outflowing Gaspé-Current and Gaspé-drift, the Anticosti gyre, and by the inflowing West Newfoundland Current flowing northward along Newfoundland (Saucier et al., 2003; Bourgault et al., 2014). These currents are characterized by strong seasonal variabilities (Saucier et al., 2009). According to circulation models, the currents are stronger (~ 1cm.s-1, Tang, 1980; Saucier et al., 2003)
along slopes and deep channels such as the Laurentian Channel (Galbraith et al., 2017). The deep waters of the Laurentian Channel are made of waters originating from the edge of the continental shelf and composed of Labrador and North Atlantic central waters (Gilbert et al., 2005; Genovesi et al., 2011).
2.2. Geology and sedimentology
The geology of the GSL is characterized by Carboniferous and Permian lithological successions (Lavoie et al., 2009). Those successions lay on the Canadian Shield in the Anticosti and Maritime basins. The Maritime Basin gathers the Magdalen Basin and the Chaleur Bay. Ancient climates and depositional conditions leading to the formation of these
successions have produced hydrocarbon source rocks and/or reservoirs (Lavoie et al, 2009; Séjourné and Malo, 2015). Moreover, the presence of evaporites in the lithological successions have created salt structures including salt withdrawal anticlines, salt pillows and diapirs (drape and onlap prospects) and salt overhangs (sub-salt prospects) in the GSL (Lavoie et al., 2009). These features disrupt the layering of the surrounding lithological successions and help for the formation of hydrocarbon traps. In the eastern Magdalen Basin, hundreds of salt structures have been estimated. The larger structure is a salt-dome of 200 km2 in the vicinity of the Old Harry prospect (Lavoie et al., 2009) (Fig. 5A).
The GSL is surrounded by geological provinces different in mineralogical, geochemical and magnetic compositions (Loring and Nota, 1973). Thus, we can distinguish the Grenvillian metamorphic rocks of the Canadian Shield on the North Shore. characterized by high magnetic susceptibility, from the early Paleozoic sedimentary rocks of the Appalachians on the South Shore, Canadian Maritime Provinces and western Newfoundland coast definable thanks to the low magnetic susceptibility (Jaegle et al., 2015; Casse et al., 2017).
Based on previous studies, it has been established that the long-term grain-size, geochemical, mineralogical and magnetic variations recorded in the deglacial and Holocene sediments of the Gulf have been related to changes in detrital sediment supply, provenance and transport associated with climate variability and glacio-isostatic relative sea-level changes (Shaw et al., 2002, 2006; Stea et al., 2011; Casse et al, 2017).
2.3. Quaternary stratigraphy
The bathymetry of the GSL is marked by the Laurentian Channel resulting from Quaternary glacial erosion and deposition (Piper et al., 1990; Praeg et al. 1992; St-Onge et al., 2011). This feature (250-550 m deep) crosses the GSL from the eastern Canadian continental shelf to the mouth of the Saguenay Fjord near Tadoussac on 1 200 km and
contains successions of Quaternary sediments. These sediments are relicts of glacial and deglacial episodes of the Laurentide Ice Sheet (LIS), as well as postglacial sedimentation in the GSL since the Last Glacial maximum (LGM). Many subbottom profiler surveys performed in the GSL contributed to the identification of several subbottom profiler units in the Quaternary successions (e.g., Loring and Nota, 1973; Syvitski and Praeg, 1989; Josenhans and Lehman, 1999; St-Onge et al., 2008; Duchesne et al., 2010) grouped here in three main chronostratigraphic units: (i) glacial-till and ice-contact sediments (Unit 1); (ii) proximal glaciomarine sediments (Unit 2) and (iii) distal and postglacial sediments (Unit 3).
The surface sediments are transported via the St. Lawrence River by processes such as continental freshwater discharge influenced by seasonal changes in rain and snow precipitation on the continent, atmospheric circulation, tidal currents, surface and bottom currents, wave energy and by the formation of sea ice (e.g., Dionne, 1993; Saucier et al., 2003). Their distribution is characterized by fine-grained sediments (fine silts) in the deep central part of the Laurentian Channel whereas coarser-grained sediments (gravels, sands and, to a lesser proportion, fine silts) characterized slopes and adjacent shelves (Loring and Nota, 1973; Josenhans, 2007; Pinet et al., 2011).
3. MATERIAL AND METHODS
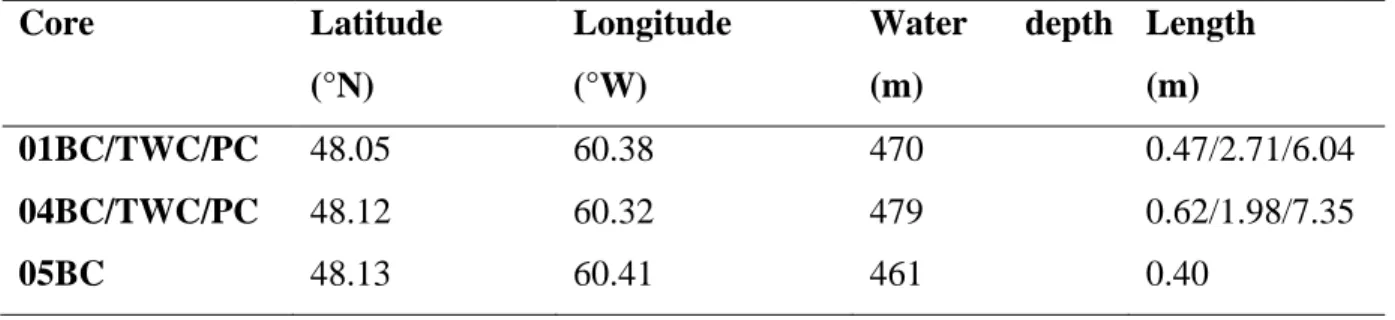
Sediment cores and geophysical data were acquired onboard the R/V Coriolis II in 2015. Five sites were sampled in the OHA where piston cores (PC), their companion trigger weight cores (TWC) and associated box cores (BC) were collected (Table 1, Fig. 5B). The study focusses on 3 of these sampling locations: station 01, corresponding to the location of the expected exploration oil well; station 04, acting as a reference point where seafloor sediments are undisturbed, and station 05 where a box core was retrieved in a pockmark.
Table 1. Location, water depth and length of sediment cores used in this study
Core Latitude (°N) Longitude (°W) Water depth (m) Length (m) 01BC/TWC/PC 48.05 60.38 470 0.47/2.71/6.04 04BC/TWC/PC 48.12 60.32 479 0.62/1.98/7.35 05BC 48.13 60.41 461 0.40
3.1.Geophysical data and processing
3.1.1. Multibeam
Multibeam survey were recorded on board R/V Coriolis II using a Kongsberg EM-2040 (200-400 kHz) acquire 230 km2 of multibeam coverage of the study area between a water depth of 450 to 510 m. This system also allowed extracting backscatter intensities to produce reflectivity maps of the seafloor. Conductivity-temperature-depth (CTD) profiles, velocity profiles and tidal data were used to post-process the bathymetric data with the CARIS HIPS and SIPS software. During post-processing, values of the seafloor were
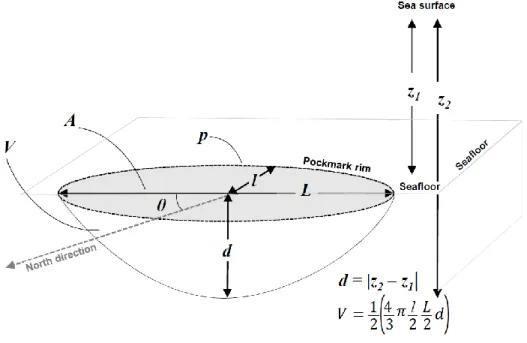
interpolated using a 5 x 5 cube filter and backscatter images were generated in CARIS. The final depth surface was exported from CARIS to the ArcGIS software to generate a 32-bit floating-point bathymetric grid of 5 x 5 m cells. Once imported in ArcGIS, the pockmarks were manually delineated using a polygon function and all their morphometric properties
were extracted (Fig. 6).
Figure 6. Schema of an individual pockmark as described in this study (modified from Andrews et al., 2010). A is the surface of the pockmarks (m2), V is the volume (considered here as a half-ellipsoid), z1 is the depth to the pockmark rim in m, z2 is the seafloor depth in
m, d is the pockmark depth in m, p is the perimeter in m, L is the length of the pockmark in m, W is the width of the pockmark in m and θ is the orientation in degrees, from the North (geographic)
3.1.2. Subbottom profiler
Subbottom profiler reflection data were acquired using a hull-mounted Edgetech 3300 subbottom profiling system (0.5-12 kHz) used with a centered frequency between 4.5 to 6 kHz. The data acquired are displayed and recorded using the Discover X-star 2.1 software. Tide, swell and seafloor manual picking were applied as corrections on those data using the Vista seismic processing package (Schlumberger). The processed subbottom profiler data were then integrated and analysed with the Kingdom Suite software (IHS).
The acoustic travel times were converted into depths by using an average subbottom profiler velocity of 1 500 m.s-1 for the water column and in the Quaternary sedimentary deposits.
3.2.Core processing and analyses
3.2.1. CT-scan
All cores were passed through a computerized axial tomography scanner (CAT-Scan at INRS-ETE in Quebec City) to visualize sedimentary structures and to extract CT number profiles that primarily reflect changes in bulk density (e.g., St-Onge and Long, 2009; Fortin et al., 2013).
3.2.2. Physical properties
On whole cores, low field volumetric magnetic susceptibility (kLF) was first measured
using a GEOTEK Multisensor Core Logger (MSCL) at 1 cm intervals. The cores were then split, opened, described and photographed. The analyzes were conducted with the MSCL to measure diffuse spectral reflectance with a Minolta CM-2600d spectrophotometer at 1 cm intervals. The spectral reflectance data are expressed in the CIE (International Commission on Illumination) L*, a*, b* color space which is often used in paleoceanography to derive information on sediment mineralogy (e.g., St-Onge et al., 2007). Here we only use the a* values which are often associated to changes in the concentration of red minerals (e.g., hematite).
3.2.3. Grain-size analysis
Grain-size measurements were performed using a Beckman-Coulter LS13320 laser diffraction particle size analyzer (detection range of 0.04-2000 µm). Bulk sediments collected at 10 cm intervals in each core were added to a Calgon electrolytic solution (1% sodium hexametaphosphate) and mixed using an in-house rotator during 3 hours before analysis. The output data were computed using the GRADISTAT software for sediment
parameters to determine grain-size statistical data (e.g., mean and sorting; Blott and Pye, 2001).
3.2.4. Radiocarbon dating
The chronologies of the composite sequences of cores 01 (PC, TWC) and 04 (PC, TWC) were determined using accelerator mass spectrometry (AMS). 14C ages were obtained at the Keck Carbon Cycle AMS Facility, University of California (Irvine, USA) on 9 marine shell fragments (Table 2). The conventional 14C ages were calibrated using the CALIB 7.1 software (Stuiver et al., 2017; http://calib.org/calib/calib.html) and the Marine13 dataset (Reimer et al. 2013). A standard marine reservoir of 400 yr (ΔR = 0) was applied according to Barletta et al. (2010). The age-depth models for the composite cores 01 and 04 shown in Fig. 9 were built using in the R package BACON (Blaaw and Christen, 2013). To estimate the missing sediment from the top of the piston cores due to coring operations, we compared the box cores with the top of the trigger weight and piston cores using the physical parameters (a*, kLF) (see Annex I). These corrected depths were used in
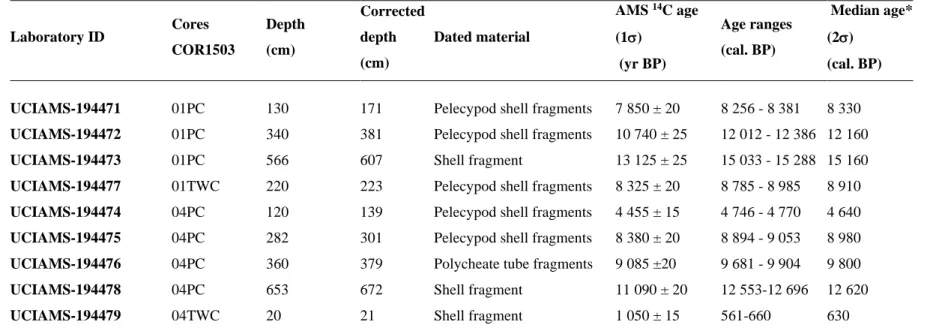
Table 2. Radiocarbon ages in 14C conventional and calibrated ages Laboratory ID Cores COR1503 Depth (cm) Corrected depth (cm) Dated material AMS 14C age (1) (yr BP) Age ranges (cal. BP) Median age* (2) (cal. BP) UCIAMS-194471 01PC 130 171 Pelecypod shell fragments 7 850 ± 20 8 256 - 8 381 8 330
UCIAMS-194472 01PC 340 381 Pelecypod shell fragments 10 740 ± 25 12 012 - 12 386 12 160
UCIAMS-194473 01PC 566 607 Shell fragment 13 125 ± 25 15 033 - 15 288 15 160
UCIAMS-194477 01TWC 220 223 Pelecypod shell fragments 8 325 ± 20 8 785 - 8 985 8 910
UCIAMS-194474 04PC 120 139 Pelecypod shell fragments 4 455 ± 15 4 746 - 4 770 4 640
UCIAMS-194475 04PC 282 301 Pelecypod shell fragments 8 380 ± 20 8 894 - 9 053 8 980
UCIAMS-194476 04PC 360 379 Polycheate tube fragments 9 085 ±20 9 681 - 9 904 9 800
UCIAMS-194478 04PC 653 672 Shell fragment 11 090 ± 20 12 553-12 696 12 620
UCIAMS-194479 04TWC 20 21 Shell fragment 1 050 ± 15 561-660 630
*The ages were calibrated using the CALIB software (Stuiver et al., 2017) and the Marine13 calibration curve (Reimer et al. 2013) using a ΔR=0
3.2.5. Bottom current data
Current data were recorded by a mooring of 4 acoustic Doppler current profilers (ADCPs), as well as 10 Temperature-Salinity sensors (CTD) at fixed depths deployed at Old Harry (47° 59.910 N; 60° 30.714 W) to collect long-time series of currents and physical properties of the water column (Fig. 5B). The mooring of ADCPs measured current velocities each hour at 4 m resolution over most of the water column. In this study, we used the data collected by the deepest ADCP to display current velocities and directions between 320 m and 420 m. The mooring provided data over approximatively eleven months from November 4, 2013 until October 21, 2014.The data quality control was completed on the ADCPs data and on the CTD data (Mélany Belzile; personnal communication, 2015).
4. RESULTS
4.1.Chronostratigraphic framework
4.1.1. Seismostratigraphy units (results and interpretations)
In the study area, high-resolution subbottom profiler reflection profiles were interpreted and subdivided in three seismostratigraphy units as simplified from Josenhans and Lehman (1999). Based on the physical and acoustic properties of our data, the distinction of the units was made by focussing on visible high-amplitude reflections bounding them (Table 3).
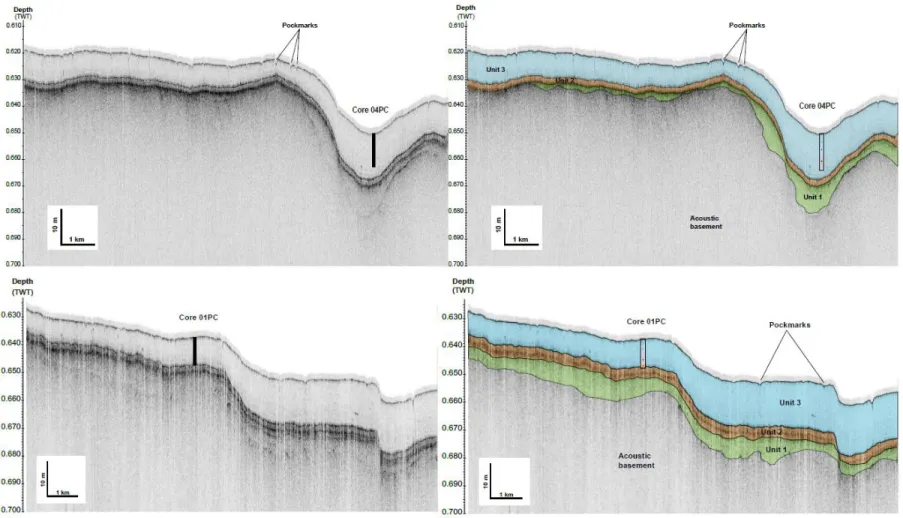
Unit 1 is recognizable by a low-amplitude reflection and its lowermost boundary is similar to erosional truncation. This unit lies on an acoustic basement that could be assimilated as bedrock or till and differs from the above units because it is mainly composed of low and discontinuous amplitude with a reflection-free pattern. The basin-fill architecture varies in morphology, but never exceeds 15 m in thickness. Based on the results of Josenhans and Lehman (1999), we consider this unit to be mainly composed of till or ice-contact sediments (Fig. 7 and Table 3).
Unit 2 is bounded by high-amplitude continuous reflections that form an onlap drape located above the Unit 1. This unit is defined by continuous low-to-moderate amplitude sub-parallel reflections (Fig. 7). It is also characterized by a low thickness on all our subbottom profiler profiles (4 m max.). This unit is interpreted as glaciomarine sediments corresponding to ice-proximal stages of the LIS (Josenhans and Lehman, 1999).
Unit 3 is characterized by high-amplitude continuous reflections corresponding to the seafloor/sediments interface which is sometimes disturbed by the presence of pockmarks. This unit is acoustically semi-transparent with low-amplitude chaotic to weakly-stratified internal reflections occurring in the entire surveyed OHA. In this unit, the deposits are interpreted as distal glaciomarine and postglacial sediments where recent sediments mainly
coming from the St. Lawrence River continue to accumulate (Josenhans and Lehman, 1999). This unit is also subject to the action of currents. In cores, sediments are composed of highly bioturbated muds with many shell fragments and ice-rafted debris (IRD).
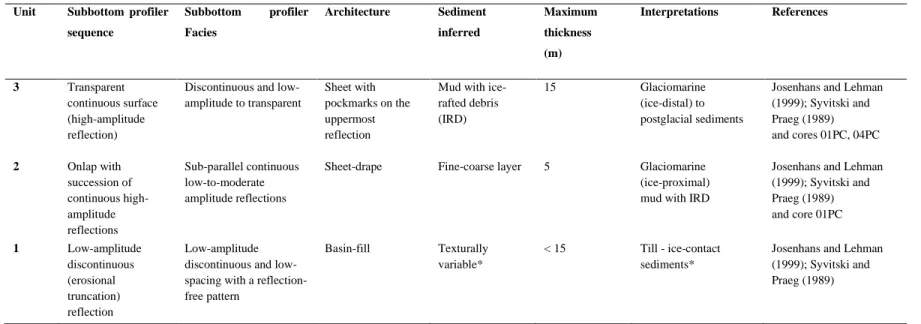
Table 3. Summary of the regional seismostratigraphy in the Laurentian Channel, in the Gulf of St. Lawrence,
in the Old Harry area * textural interpretations based on Josenhans and Lehman (1999)
Unit Subbottom profiler sequence Subbottom profiler Facies Architecture Sediment inferred Maximum thickness (m) Interpretations References 3 Transparent continuous surface (high-amplitude reflection)
Discontinuous and low-amplitude to transparent
Sheet with pockmarks on the uppermost reflection
Mud with ice-rafted debris (IRD)
15 Glaciomarine
(ice-distal) to postglacial sediments
Josenhans and Lehman (1999); Syvitski and Praeg (1989) and cores 01PC, 04PC 2 Onlap with succession of continuous high-amplitude reflections Sub-parallel continuous low-to-moderate amplitude reflections
Sheet-drape Fine-coarse layer 5 Glaciomarine
(ice-proximal) mud with IRD
Josenhans and Lehman (1999); Syvitski and Praeg (1989) and core 01PC 1 Low-amplitude discontinuous (erosional truncation) reflection Low-amplitude discontinuous and low-spacing with a reflection-free pattern
Basin-fill Texturally variable*
< 15 Till - ice-contact sediments*
Josenhans and Lehman (1999); Syvitski and Praeg (1989)
Figure 7. Subbottom profiler lines (uppermost: line 104, lowermost: line 110) before (left) and after interpretation (right) along with the sampling locations of cores 01PC and 04PC cores
4.1.2. Lithostratigraphic units
The sediment characteristics of cores 01PC and 04PC are described below according to CT-scan images, digital images, spectral reflectance (a* values), magnetic properties (kLF) and sediment grain-size (Fig.8).
The lowermost unit identified is dated between 15.2 and 14.5 cal. ka BP (Figs. 8A, 9). Indeed, this unit only visible in the 01PC is characterized by high a* (from 4 to 8) and CT-number values (from 800 to 1 200 HU), and appears clearly on the digital image as red-brick colored-unit. The same trend is also visible on the grainsize analysis where this unit is mainly composed of coarse to fine silts and clayey silts with a mean grain-size up to 4.70 µm including IRD. Inversely, the magnetic susceptibility (kLF) profiles present minima
(down to 25×10-5 SI).
From 14.5 to 8.5 cal. ka BP, both cores 01PC and 04PC present the same lithological properties. The CT-number values (from 800 to 600 HU) and the mean grain-size values tend to slowly decrease until 8.5 cal. ka BP to become fine silt (3 µm). According to the a*and kLF values and the digital image, this unit can be divided in two (characterized in
blue and grey on the Fig. 8). The lowermost one, between 14.5 and 11 cal. ka BP, is composed of dark greenish to reddish brown homogenous silty clays with IRD with the highest sedimentation rates observed in both cores (~ 70 cm.kyr-1 in core 01PC and ~100 cm.kyr-1 in core 04PC; Fig. 8). The a* values profile slowly decreases with minimum
values and few upward variations. The kLF profile presents variations with maximum values
(up to 100×10-5 SI). Between 11 and 8.5 cal. ka BP, the sediments are composed of dark
brownish grey, lightly bioturbated clayey silts to silty clays. Decreases are observable in sedimentation rates (~ 50 cm.kyr-1 in core 01PC and ~ 80 cm.kyr-1 in core 04PC) and also in spectral reflectance (down to -2) and kLF profiles with minimum values down to 25×10-5
SI.
From 8.5 cal. ka BP to present, sediments are composed of very coarse silts and the mean grain-size increased up to 5.60 µm. An abrupt decrease in the sedimentation rates is
visible on both cores (~ 20 cm.kyr-1 in core 01PC and ~ 30 cm.kyr-1 in core 04PC; Figs. 8, 9). The a* values present variations with a maximum value of 0 whereas kLF is constant
(25×10-5 SI).
Figure 8. Sedimentological analysis for cores (A) 01PC and (B) 04PC, (left to right): CAT-scan images with the CT numbers, digital imaging, the diffuse spectral reflectance (a*), the split-core magnetic susceptibility (kLF), the mean grain-size and the clay and silt fractions.
Figure 9. Age models for composite cores 01 and 04; the red line shows the best age model and the grey dashed lines represent the chronological uncertainties (95% confidence interval) with their sedimentation rates in green; the vertical blue dashed lines depict the major changes in the sedimentation rates around 8.5 cal. ka BP; the colored rectangles correspond to the lithostratigraphic units described in the text
Figure 10. Relative sea-level plotted from Shaw et al., (2002) and Clark et al., (1978) at Port-au-Port (closest point to Old Harry) with a* and kLF values of the composite core 01
As an exception, the box core 05BC retrieved in a pockmark and representing shallow surficial sediments (~30 cm deep) reflects how different the lithology in a pockmark is compared to Laurentian Channel sediments sampled outside pockmarks. The sediments in the pockmark present high variations of the CT-numbers (from 400 to 800 HU), IRD, silts and a carbonate concretion (Fig. 11).
Figure 11. A. Comparison between box cores sampled in a pockmark (05BC) and a reference core (01BC) collected outside a pockmark; B. Carbonate concretion found in core 05BC, typical of areas where methane is generated and C. One sample of the same carbonate concretion of (B)