GEOPHYSICAL
RESEARCH
LETTERS,
VOL.
19,
NO.
18,
PAGES
1803-1806,
SEPTEMBER
23, 1992
ULTRAVIOLET IMAGING OF THE JOVIAN AURORA WiTH THE HUBBLE SPACE TELESCOPE
V. Dols
•, J.C.
Girard
x, F. Paresce
2, R. Prangi3,
4 and
A. Vidal-Madjar
4
Abstract. We present here for the first time a Lyman-a image of the north polar region of Jupiter obtained with
the Faint Object Camera (FOC) on board the Hubble Space
Telescope a few hours after the encounter of the ULYSSES
spacecraft with Jupiter. The presence of high latitude regions
of enhanced emission is clearly observed. A comparison with
the location of the "UVS oval", the Io (L = 6) and high-
latitude field-line footprints shows that the best agreement is obtained with the L > 15 footprint and the UVS oval which are close to each other for the particular longitudinal sector (30 o < ,X• < 210 ø) observed. These two L-shells correspond to two possible sources of precipitation: particles originating respectively from the region of the plasma torus of !o in a distorted magnetic field or particles from the distant magnetosphere by analogy with the terrestrial aurora. The first direct determination of the latitudinal extent of the oval and of its intensity is made and compared with previous
estimates.
Introduction
Observations made with the Voyager 1 Ultraviolet Spectrom- eter (UVS) in 1979 (Broadfoot et al., 1979) and subsequent spectrometric measurements (Herbert et al., 1987) obtained with the Voyager 2 and International Ultraviolet Explorer (IUE) (Clarke et al., 1980) identified the presence of strong auroral emissions due to H2 and HI Lyman-a distributed around the poles of Jupiter. Meridional scans of the north H2 UV aurora with the UVS slit were used to define the equato- rial boundary of the oval ("the UVS oval") which appeared
to lie close to but not coincident with the Io orbit field line
footprint (Broadfoot et al., 1981). A longitudinal variation of the north intensity with H: and Lyman-a peaks generally centered near a longitude ,X• = ! 80 ø was observed both dur- ing the Voyager encounters (Herbert et al., 1987) and IUE long-term survey (Livengood eta!., 1990). However, the real
morphology of the FUV aurora, which bears the signature of the auroral precipitation processes and more generally of the
magnetosphere dynamics, was still basically unknown due to
the lack of any imaging instrument and to the limited spatial
resolution of most of the observations made so far. The first
image
at Lyman-a
has been
recorded
with the Faint
Object
Camera
(FOC)
on board
the Hubble
Space
Telescope
(HST)
at the time of the ULYSSES Jupiter fly-by and we describe here its preliminary analysis. ,
Instrumental configuration
The
image
of the Jovian
north
polar
region
described
below
is a 16-minute
exposure
obtained
at 02:58
UT on February
Institut
d'Astrophysique
- Universiti
de Liege,
Belgium
Space Telescope Science Institute, Baltimore, USA 3 Institut d'Astrophysique Spatiale, Orsay, France4 Institut d'Astrophysique, Paris, France
9, 1992 about
15 hours
after the closest
approach
of the
ULYSSES
spacecraft
with
Jupiter.
The F/96 optical
relay
of
the FOC was used with the F120M + F140W filter combi- nation. The FOC and the filter characteristics are described
in detail
by Paresce
(1992).
During
the observations,
Jupiter
was at a distance of 4.47 AU from the Earth, the phase an-gle was
4.2
o and the latitude
of the sub-Earth
point 1.72
ø
S. The angular
equatorial
diameter
of the planet
was
43.94
arcsec. Consequently only a fraction of the northern hemi- sphere could be imaged in the 22 arcsec x 22 arcsec field
of view of the camera. The image was obtained in the 1024
x 512 zoomed
pixel
format
with
22 x 44 milliarcsec
pixels
projecting
onto
a 143 x 286 km
2 area
on the planet
at 60
ø.
The planet
was
tracked
using
the latest
possible
ephemeris
for the spacecraft
and
the north
pole
was
kept
at the center
of the detector
during
the exposure.
The possible
error
on
the position of the planet in the FOC field of view is of the order of 1 arcsec whereas the tracking error is less than 0.02 arcsec. The central meridian longitude ,XHt(1965) was 115 ø and the Io orbital phase angle was 96 ø W, measured from
inferior geocentric conjunction (sub-Earth meridian) that is close to maximum western elongation.
The F120M + F140W combination of filters was selected
to isolate the HI Lyman-a emission while rejecting efficiently
the other light components due mainly to the H2 auroral and
airglow
UV emission
and
sunlight
scattered
by the planetary
atmosphere. The use of two UV filters in series is necessary to remove the contamination due to near-UV and visible lightotherwise transmitted in the long-wavelength wing of a sin-
gle UV filter. This filter combination has an approximately
gaussian transmission profile reaching 0.65 % at the peak
(1250 h,) and 0.42 % at 1216 h, with a full width at half maximum (FWHM) of 90 h,. The intensity contribution of the hydrogen bands has been determined by integrating the
intensity distribution calculated with a H2 synthetic spectrum over the effective passband of the filters. The synthetic spec- trum is calculated using the Lyman/Werner and vibrational intensity ratios based on the study by Ajello et al. (1984) which applies to electrons of ,.. 100 eV and we assume no hydrocarbon absorption. Using a typical value of 1.3 for the Jovian H2-bands/Lyman-c• auroral ratio (Sandel et al., 1979), we estimate the relative contribution of the H• Lyman and Wemer bands in the auroral signal to about 28% of the total. The combined efficiency of the filters, telescope optical ele-
ments and detector is low and the observed count rate is thus
small. A maximum of about 1 x !0 -3 C s- t pix- • obtained, well below the threshold of non linearity of the detector of 0.3 C s -t pix -•. The raw image was flattened and geometri- ca!ly corrected to remove the optical and detector distortions. The spherical aberration of the primary mirror of the HST spreads the light of a point source over a circular halo of about 2 arcsec radius. The encircled energy within a 0.1 arc- sec of the central peak is about 15 % of the total energy. As a consequence of the low count rate, standard restoration techniques cannot be applied in this case to improve the im- age quality. Instead, smoothing and rebinning on a number of pixels were applied to improve the signal/noise ratio.
Copyright
1992
by the American
Geophysical
Union.
Paper number 920L02!04
0094-8534/92/92GL-02104503. O0
Lyman-a image of the north jovian aurora Figure ! shows the corrected image with an effective 28 x !4 pixel size (0.62 arcsec x 0.62 arcsec) and an overlaid grid of meridians and parallels taking the oblatehess of the
1804 Dols et al. ' UV Jovian aurora imaging
ß
"...
! ARCSEC-,
Figure
1: false
colour
image
of the northern
polar
region
of
Jupiter
observed
with the FOC on February
9, 1992. The
,X• longitude
of the central
meridian
is 115
ø and
meridians
increase by steps of 20 ø toward the upper left comer. The bright feature extending from the vicinity of the north pole tothe eastern (astronomical) limb is interpreted as the Lyman-c•
signature of the Jovian aurora excited by energetic particle
precipitation.
planet into consideration. A roughly continuous region of
enhanced intensity is clearly observed extending from the vicinity of the rotational north pole to the (astronomical) eastern limb near a latitude of 55 ø. However, it does not
appear as an homogeneous feature although the intensity
variations may be due in part to the low count rate. Two
particularly bright spots can be observed, one at • • 1500
and relatively low latitude (57 ø N), the other at high latitude near the north pole (about 80 ø) between the western limb and ;• • 100 o. Another bright feature, although less intense, is also observed on the 150 ø meridian, poleward of the first one (at • 67øN). The count level was determined by fitting a gaussian function to the count rate measured in 20-pixel wide areas across the emission regions. The peak level reaches 1.0 C pix -• (elementary pixel) in the bright area near the pole and 0.9 C pix -• in the bright spot located near 57 ø N and ;•m = 150 ø whereas the mean disk level is about 0.7 C pix -•. The additional count rate of 0.2 C pix -• in the aurora translates into an emission rate at Ly-a (plus some H,. emission) of about 100 4- 25 kR above the disk background and corresponds to a signal-to-noise ratio of about 3. The uncertainty of about 50% on the UV filter transmission is another potential source of absolute intensity estimate. Large variations are observed along the oval, with no measurable auroral increase above the background at some longitudes. In this case, the detectability limit set by the noise is estimated to be ~ 25 kR. The FWHM of the gaussian fit on the bright spots is about 1 arcsec corresponding to a latitudinal extension of ~5 ø of latitude (5900 kin) for the
ß .. N
ß •
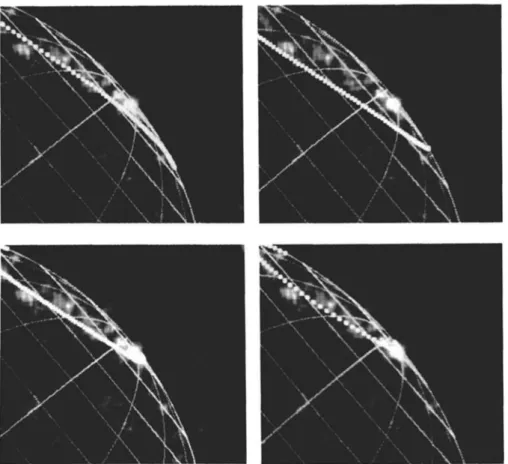
Figure 2: comparison of the Lyman-o aurora of figure 1 with:
(a) top left: the equatorward boundary of the UV auroral zone observed with the spectrometer on board Voyager (Broadfoot et al., 1988);
(b) top fight: the footprint
of the L = 6 magnetic
field
lines
crossing
the Io orbit (04 GSFC
model);
(c) bottom left ß the footprint of the L = 15 magnetosheet field lines (O4 GSFC model); (d) bottom fight: the footprint of the L = 30 field line.
Dols et al.: UV Jovian aurora imaging 1805
bright spot at 57 ø at the CML and •3 ø (3500 km) at 80 ø near the limb. The 1 arcsec width may be considered as an upper limit for two reasons. First, the spherically aberrated image
of the HST spreads the photons over an area exceeding the actual thickness of the emission region. Although the central core of the point spread function extends over a few pixels in radius, only 50% of the energy is contained within a circle of
16
pixel
radius
at 1216
X. Second,
the
optical
thickness
of the
Lyman-a emission tends to widen the emission and smoothits spatial variations with respect to the precipitation region. The latitudinal extent of the diffuse lower level emission is clearly larger, probably of the order of several arcsec, perhaps coveting part of the polar region. However, due to the low signal to noise, and an unfavorable side viewing geometry, it cannot be accurately determined from this single image.
Emission rates previously deduced from the Voyager and IUE spectrometer measurements were intrinsically uncertain due to the lack of information concerning the width of the auroral zone. The best information available so far was gath- ered when the Voyager UVS aperture scanned north/south across the oval. On some occasions, the polar limb seemed
void of emission and the arc seemed to be narrower than the
6000 km of the slit projection (Sandel et al., 1979). How- ever, the poleward boundary of the "UVS oval" could not be unambiguously detected. Therefore, due to the lack of morphological data, somewhat arbitrary assumptions had to be made to convert the apparent surface brightness detected in the field of view to absolute emission rates. For example, a 60 kR Lyman-a brightness was derived by Sandel et al. (1979) from the Voyager 2 NSMAP scan assuming a width of 6000 km (mapping along the field line an Io torus confined to L = 5.9 q- 1). Similarly, IUE Lyman-a auroral intensities ranging from below instrumental threshold to 42 kR were derived assuming a 2 arcsec north-south extent of the aurora by Clarke et al. (1980). Other intensity estimates (Clarke et al., 1989) were based on the assumption that the IUE small (3 arcsec) or large (5.5 arcsec x 8.9 arcsec) apertures were filled with auroral emissions and ranged from 5 to 10 kR. Our HST image indicates that, if the auroral width observed here is typical, the IUE intensities previously reported should probably be scaled up by a factor of 3 to 9 to account for the 1 arcsec width deduced here. Therefore, the present ob- servations are not incompatible with previous Ly-c• intensity estimates.
Figure 2 compares the observed morphology with the location of the Voyager "UVS oval" and with the footprint of several characteristic magnetic field lines in the GSFC 04 + current sheet model (Connerney et al., 1981): L = 6 (Io's orbit which is imbedded into the plasma toms region extending between about L = 5.5 and 8, where wave-particle interaction is expected to diffuse the energetic particles into the atmospheric loss cone), L = 15 (plasmasheet where plasma instabilities such as the tearing instability are likely to occur by analogy with the Earth) and L = 30 (so-called open field line , possibly connected to the solar wind). In spite of the low count level, it appears that, in this sector,
the L = 6 footprint is everywhere equatorward of the HST
observations and does not match the Lyman-a satisfactorily, .exc. ept for the low latitude bright spot at ,x• = 150 ø, which is just poleward of this oval.
In contrast, the observed aurora is in reasonable agreement
with the UVS oval in this longitude sector, although centered a few degrees poleward. It is important to stress that this oval defines the equatorward envelope of the actual UV auroral boundary at the time of the encounter and that most of the UVS emissions were observed several degrees poleward or
more. Among the theoretical footprints, a substantially better
fit is obtained with the L-shell = 15 and 30 footprints than with L = 6. However, it must be born in mind that in the
longitude
range
of this observation,
the L = 15 shell
oval
footprint is not far from the UVS oval. In addition, the fits
are globally good for the arc, but the bright spot at .x,•.• m
150 ø seems to lie equatorward of the ovals. As for the second spot on the same meridian, it even lies poleward of the 'open field-line' (L = 30) oval.
Unfortunately, the limited accuracy on the location of the limb (• 1 arcsec) limits the precision of the comparison:
a limb shifted by 1 arcsec towards the north would put
the L = 6 04 footprint just equatorward of the observed oval. However, in such a case, a significant segment of the
footprint, westward of the high latitude bright spot, would
be surprisingly dark. In addition, the magnetic field model
itself, deduced from in-situ measurements, is subject to some
uncertainty when extrapolated to the surface. This point
was discussed by Connemey (1992) and an uncertainty on
the order of a fraction of an arcsec can also be expected
from this source (see O6 footprint plots in Connerney, 1992). However, the size of the model oval itself is unaffected by the
uncertainty. Therefore, an estimate of the relative agreement of the ovals may also be obtained independently of the limb location and of the magnetic field model by comparing the angular extension of the observed emission region, the UVS and theoretical ovals. The observed extension is about 12.9 arcsec, to be compared with 13.2 arcsec for L = 15, 16.6 arcsec for UVS and 17.7 arcsec for L = 6 ovals. Additional observations, especially at other CMLs (where the ovals are further apart from each other) would be useful to confirm this result.
In contrast to most previous spectrometer observations, no intensity enhancement above the disk mean level is observed with the •ttt • 180 ø meridian but a bright spot is observed at a somewhat lower longitude (,X•rtt m 150ø). In addition, the brightest region is located near the north pole, between the western limb and •ttt • 100 ø. This result must be used with caution since this effect might also be due to the nearly tangential viewing of the arc and the subsequent increase of the optical path (limb brightening). It could also be a real intensity maximum possibly related to the intense field-aligned currents and particle beams observed almost simultaneously with this image in the evening sector of the Jovian magnetosphere by several instruments on board the ULYSSES spacecraft (Sanderson, 1992; Balogh et al.,
1992). Comparison between these observations and in-situ measurements is in progress.
Discussion
Infrared CH4 auroral hot spots were also observed poleward of the "UVS oval" (Caldwell et al., 1988) and are statisti- cally coincident with the positive detections of UV aurora by Voyager (Prang6, 1991). They are however restricted to the • • 160 ø - 200 ø sector, a region possibly associ- ated with harder particle precipitation or enhanced methane concentration above the emission layer (Livengood et al., 1990) where increased absorption of emission shortward of
• 1300.h, is expected. This is precisely the longitude zone
where this image shows a relative intensity minimum. On the other hand, recent observations of the ionospheric Ha+ emission at 3.53 •m (Drossart et al., 1992) exhibit two hot spots in the northern hemisphere located within the belt of UVS auroral emission slightly poleward of the UVS oval. In particular, the peak located near •t• = 150 ø lies at the same time along the UVS oval and on open field lines if compared with the theoretical 04 footprints, in agreement with the HST image presented here. Although no firm conclusion can be drawn before a careful analysis of the geometrical and ra- diative transfer effects is performed on our HST image, we can mention that the images of the Ha + aurorae, all recently obtained over a period of one year, also exhibit a relative
1806 Dols et al.: UV Jovian aurora imaging
intensity minimum at •x•t = 180 o between two maxima close to 150 o and 220 o . Observations of the Ha + emission by Baron et al. (1991) which show auroral emission partly extending along the UVS oval, with bright spots around 145 ø and 230 ø, a lower intensity around 1800 and a broad emission region
extending around the pole, also present some similarity with
this Lyman-a image.
In conclusion, our results provide evidence that monitor- ing of the Lyman-a aurora, its morphology and intensity vari- ations can be per•brmed from Earth orbit with the Hubble Space Telescope. More observations in different configu- rations are needed to fully characterize the structure of the Lyman-c• aurora in comparison with the Voyager and IUE observations, ground-based infrared images and model pre- dictions. However, the initial results reported here do not conflict with previous auroral measurements in this longi- tude sector. They indicate that the main auroral process is probably not located at the footprint of the theoretical Io foot- print, but rather on high latitude field lines. The structure of the brightest features is patchy, exhibiting large longitudi- nal inhomogeneities, suggesting that some of them could lie on field lines different from the mean oval (either connected to the Io torus and/or to the polar cap). Additional direct
information is obtained on the width of the aurora and the
auroral brightness. Specific issues, such as the longitudinal brightness variation will require more thorough analysis and modeling and confirmation by additional observations before they can be physically interpreted.
Acknowledgements. We are very grateful to the STScI moving target scheduling team, especially Alex Storrs for crucial assistance and support throughout the program. We thank G. Munhoven for his assistance in the data analysis and J.E.C. Connerney who provided the magnetic field data. One of the authors (JCG) acknowledges support from the Belgian National Fund for Scientific Research (FNRS). This work was supported in part by the PRODEX ESA program of the Belgian Science Policy Office - Prime Minister's Services. R. Prang• acknowledges support from the CNRS/INSU grant "ATP Plan•tologie" 803742.
References
Ajello, I.M., D. Shemansky, T.L. Kwok, and Y.L. Yung, Studies of extreme-ultraviolet emission from the Rydberg series of H2 by electron impact, Phys. Rev., 29, 636-654, 1984.
Balogh, R.J.M.A. Dougherty, M., A. Forsyth, D.J. South- wood, E.J. Smith, B.T. Tsurutani, N. Murphy and M.E. Burton, Magnetic field observation during the Ulysses flyby of Jupiter, Science, !992 in press.
Baron, R., R.D. Joseph, T. Owen, J. Tennyson, S. Miller, and G.E. Ballester, Imaging Jupiter's aurorae from Ha + emissions in the 3-4 micron band, Nature, 353, 539-542, 1991.
Broadfoot, A.L., M.J.S. Belton and P.Z. Takacs, Extreme ultraviolet from Voyager 1 encounter with Jupiter, Science, 204, 979-982, 1979.
Broadfoot, A.L., B.R. Sandel, D.E. Shemansky, J.C. Mc- Connell, G.R. Smith, J.B. Holberg, S.K. Atreya, T.M. Don- ahue, D.F. Strobel, and J.L. Bertaux, , Overview of the Voyager ultraviolet spectrometry results through Jupiter en- counter, J. Geophys. Res., 86, 8259-8284, 1981.
Caldwell, J.A., R. Halthore., J. Orton, and J. Bergstahl, In-
frared polar brightenings on Jupiter IV. Spatial properties
of methane emission, Icarus, 74, 331-339, 1988.
Clarke, J.T., H.W. Moos, S.K. Atreya and A.L. Lane, Ob- servations from earth and variability of the polar aurora of Jupiter, Astrophys. J., 241, 179-182, 1980.
Clarke, J.T., J. Trauger, and J.H. Waite, Doppler shifted H
Ly-c• emission from Jupiter's aurora, Geophys. Res. Lett.,
16, 587-590, 1989.
Connerney, J.E.P., M.H. Acufia, and N.F. Ness, Modeling the
Jovian current sheet and inner magnetosphere, Geophys. Res., 86, 8370-8384, 198!.
Connerney, J.E.P., Doing more with Jupiter's magnetic field,
In Planetary Radio Emissions I!I, H.O. Rucker, S.J. Bauer,
and M.L. Raise, Eds., Austrian Academy of Science Press, in press.
Drossart, P., R. Prangd, and J.P. Maillard, Morphology of infrared H• + emission in the auroral regions of Jupiter,
Icarus, 1992, in press.
Herbert, F., B.R. Sandel, and A.L. Broadfoot, Observations of the Jovian UV aurora by Voyager, J. Geophys. Res., 92, 3141-3154, 1987.
Livengood, T.A., D.F. Strobel, and H.W. Moos, Long-Term study of longitudinal dependence in primary particle pre- cipitation in the north Jovian aurora, J. Geophys. Res., 95, 10375-10383, 1990.
Paresce, F., Faint Object Camera Instrument Handbook, ver- sion 3.0, STScI, 1992.
Prang6, R., Jovian UV auroral, IR auroral, and particle pre- cipitations ß A common origin ?, Astron. Astrophys., 251, L15-L18, 1991.
Sandel, B.R. et al., Extreme ultraviolet observations from Voyager 2 encounter with Jupiter, Science, 206, 962-966, 1979.
Sanderson, T.R., Energetic particles in the jovian magneto- sphere: Observations of the COSPIN instrument on the Ulysses spacecraft, presented at the XII Magnetospheres- planets "Goertz-Smith Memorial" Symposium, Los Ange- les, June 22-26, 1992.
V. Dols and J.C. G6rard, Institut d'Astrophysique, Univer- ski de Liege, 5, avenue de Cointe B-4000 Liege - Belgium. F. Paresce, Space Telescope Science Institute (on assign- ment from the Astrophysics Division, Space Science Depart- ment, ESA), 3700, San Martin Drive, MD 21218, USA.
R. Prang6, !nstitut d'Astrophysique Spatiale, B•timent 121, Universiti d'Orsay, F-91405, Orsay, France.
A. Vidal-Madjar, institut d'Astrophysique- CNRS, Boule- vard Arago, 98 bis, Pads, F-75014, France.
(received: June 2, 1992; revised: July 17, 1992; accepted: August 20, 1992.)