Carbon dioxide in European coastal waters
A.V. Borges1,*, L.-S. Schiettecatte1, G. Abril2, B. Delille1, F. Gazeau1,3,4
1
University of Liège, Chemical Oceanography Unit, Institut de Physique (B5), B-4000 Liège, Belgium
2
University of Bordeaux 1, Environnements et Paléoenvironnements OCéaniques (EPOC), CNRS-UMR 5805, Avenue des Facultés, F-33405 Talence, France
3
Laboratoire d'Océanographie de Villefranche, CNRS-Université de Paris 6, B. P. 28, F-06234 Villefranche-sur-mer Cedex, France
4
Netherlands Institute of Ecology, Centre for Estuarine and Marine Ecology, Postbus 140, NL-4400 AC Yerseke, The Netherlands
*
corresponding author:
e-mail : alberto.borges@ulg.ac.be
Accepted in Estuarine, Coastal and Shelf Science - Special section on EU
Abstract 1
We compiled from literature annually integrated air-water fluxes of carbon 2
dioxide (CO2) computed from field measurements, in 20 coastal European
3
environments that were gathered into 3 main ecosystems: inner estuaries, upwelling 4
continental shelves and non-upwelling continental shelves. The comparison of annual 5
cycles of the partial pressure of CO2 (pCO2) in 5 contrasting continental shelves
6
provided insights into the biogeochemical drivers of the CO2 fluxes. The latter were
7
also investigated by comparing CO2 fluxes to net ecosystem (NEP) and net
8
community production (NCP) in 3 contrasted coastal ecosystems. Air-water CO2
9
fluxes were scaled at European regional level and compared to fluxes of atmospheric 10
CO2 in other aquatic and terrestrial compartments. Continental shelves are significant
11
sinks for atmospheric CO2 at an average rate of -1.9 molC m-2 yr-1 that scaled at
12
European level corresponds to an absorption of atmospheric CO2 of -68.1 TgC yr-1.
13
This sink is equivalent to the one reported for the terrestrial biosphere of -66.1 TgC 14
yr-1, based on carbon-stock change models. Estuaries are significant sources of CO2 to
15
the atmosphere at an average rate of 49.9 molC m-2 yr-1 that is higher than the CO2
16
emission to the atmosphere from rivers, streams and lakes. The scaled emission of 17
CO2 to the atmosphere from inner estuaries of about 67.0 TgC yr-1 would almost fully
18
balance the sink of atmospheric CO2 computed for continental shelves. However, the
19
scaled emission of CO2 from estuaries to the atmosphere is inconsistent with the
20
potential emission of CO2 based on the fate of river organic carbon during estuarine
21
transit. This discrepancy is most probably due to the poorly constrained surface area 22
estimate of inner estuaries. 23
24
1. Introduction 25
26
Air-water fluxes of carbon dioxide (CO2) in coastal environments are usually
27
neglected in global carbon budgets because the coastal ocean only covers about 7% of 28
the oceanic realm (e.g. Gattuso et al., 1998; Wollast, 1998). However, due to intense 29
inputs of nutrients and carbon from land through rivers, and from the open ocean at 30
continental margins, the coastal ocean is one of the most biogeochemically active 31
regions of the biosphere. Inputs, production, degradation and export of organic matter 32
in the coastal ocean are several times higher than in the open ocean (e.g. Wollast, 33
1998). Consequently, it can be expected that the CO2 fluxes between the atmosphere
and coastal environments would be disproportionately more intense than their relative 35
surface area, and significant for global carbon budgets. 36
The work of Tsunogai et al. (1999) put under the spotlight the CO2 exchanges
37
between the atmosphere and the coastal ocean, as these authors computed a sink of 38
atmospheric CO2 of -1.0 PgC yr-1 by scaling globally the air-sea CO2 fluxes from East
39
China Sea. Such a sink is comparable to the open ocean sink of atmospheric CO2
40
estimated to -1.6 PgC yr-1 (Takahashi et al., 2002; Takahashi, 2003). More recent 41
estimates of the global CO2 sink over marginal seas based on scaled CO2 fluxes
42
computed from field measurements of the partial pressure of CO2 (pCO2) or from
43
carbon mass balances range between -0.2 and -0.4 PgC yr-1 (Fig. 1), nevertheless still 44
significant for the global CO2 budget.
45
The coastal ocean is not solely composed of marginal seas and most near-46
shore coastal environments, such as estuaries, act as sources of CO2 to the atmosphere
47
(e.g. Frankignoulle et al., 1998; Abril and Borges, 2004) due to the degradation of 48
riverine organic carbon (e.g.; Gattuso et al., 1998; Abril et al. 2002 ; Hopkinson and 49
Smith, 2005). If the CO2 emission of near-shore ecosystems is scaled globally then it
50
could almost fully balance the sink of CO2 over marginal seas (Borges, 2005; Borges
51
et al., 2005). Although the scaling of CO2 fluxes in the coastal ocean is at present time
52
prone to large uncertainties due to the scarcity of data and the unreliability of surface 53
area estimates of some if not all near-shore ecosystems, a more or less balanced 54
exchange of CO2 between the atmosphere and the overall coastal ocean is consistent
55
with the output of the Shallow-water Ocean Carbonate Model (SOCM; Fig. 1). 56
SOCM simulates a decrease of the CO2 emission from the coastal ocean to the
57
atmosphere since pre-industrial times and a neutral flux at present time (Andersson 58
and Mackenzie, 2004; Mackenzie et al., 2004; 2005). This evolution is due to the rise 59
of atmospheric CO2 and the increase of net ecosystem production (NEP) related to the
60
anthropogenic inputs of nutrients. Long term monitoring (e.g. Radach et al., 1990), 61
and satellite imagery (Gregg et al., 2005) show an increase in coastal waters of 62
phytoplankton biomass (chlorophyll-a), in agreement with the increase of NEP 63
predicted by SOCM. SOCM predicts that during the next 100 yrs the coastal ocean 64
will act as a sink for atmospheric CO2, due to the continued rise of atmospheric CO2
65
and the increase of NEP, and to a much lesser extent to the decrease of calcium 66
carbonate (CaCO3) production and increase of CaCO3 diagenetic dissolution
67
(Andersson and Mackenzie, 2004; Mackenzie et al., 2004; 2005). 68
In the present paper, we discuss the biogeochemical controls of air-water CO2
69
fluxes in European coastal environments. We also attempt a provisional scaling of 70
these fluxes that are compared to the fluxes of atmospheric CO2 in other aquatic and
71
terrestrial compartments at European scale. 72
73
2. Results and discussion 74
75
2.1 Biogeochemical drivers of CO2 dynamics
76 77
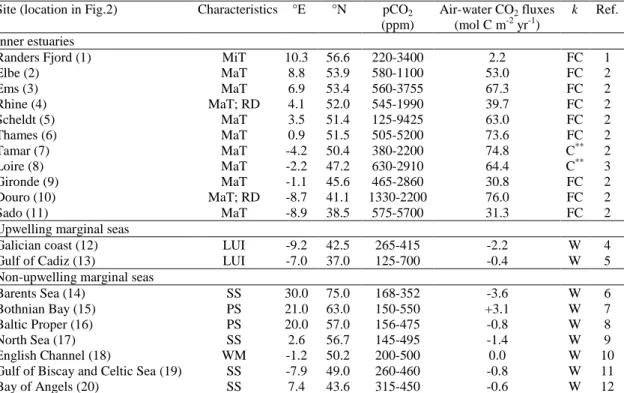
Annually integrated air-water CO2 fluxes computed from pCO2 field
78
measurements were compiled from literature (Table 1; Fig. 2). Data in 20 coastal 79
environments were gathered into 3 main ecosystems: inner estuaries, upwelling 80
continental shelves and non-upwelling continental shelves. Inner estuaries are 81
characterized by pCO2 values well above atmospheric equilibrium and all the sites
82
listed in Table 1 act as sources of CO2 to the atmosphere. Upwelling and
non-83
upwelling continental shelves act as moderate to strong sinks of atmospheric CO2.
84 85
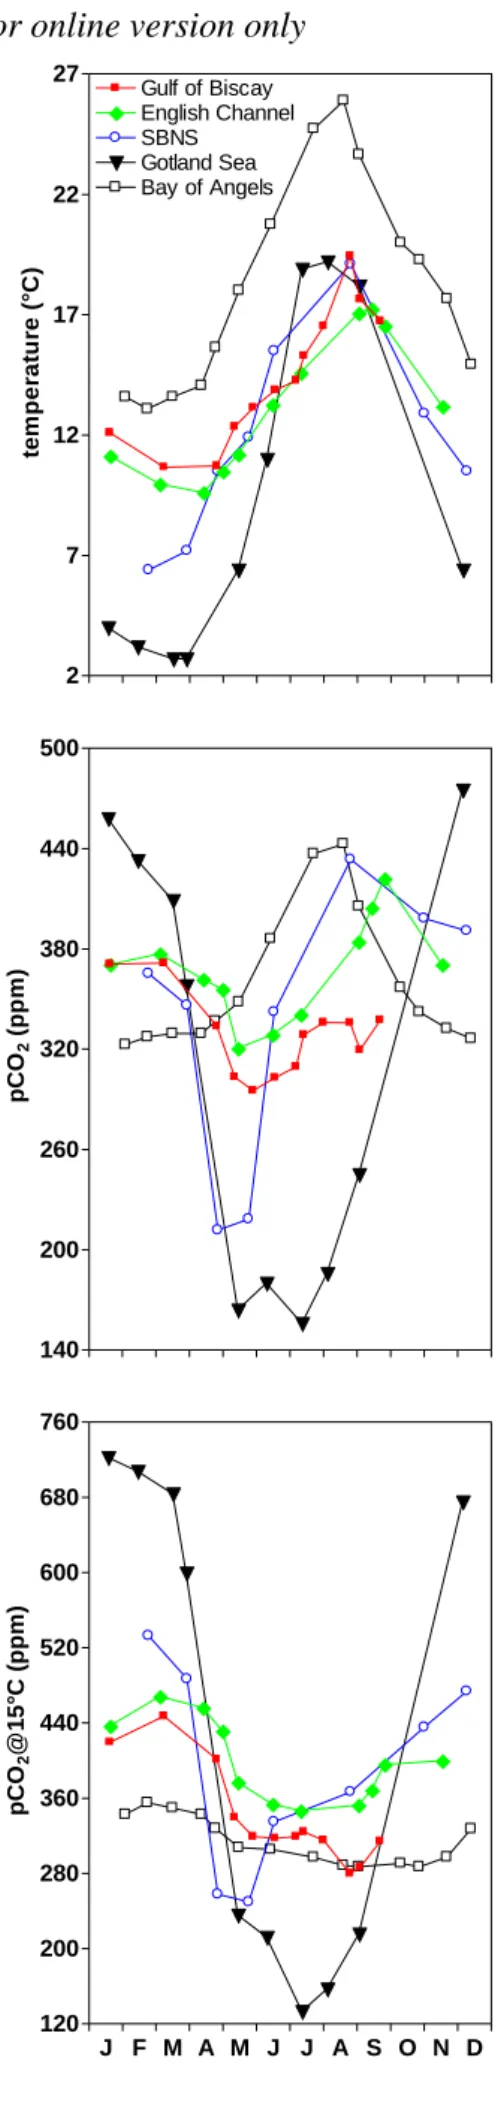
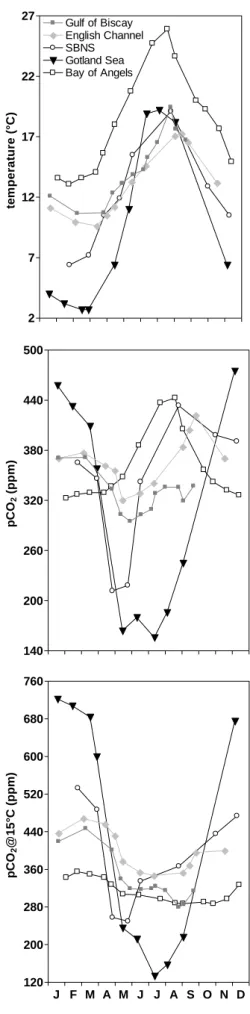
2.1.1. Comparison of the pCO2 seasonal cycle in five temperate continental shelves 86
87
The seasonal cycle of surface water temperature, pCO2, and pCO2 normalized
88
to a constant temperature of 15°C (pCO2@15°C) in 5 temperate European continental
89
shelves are compared in Figure 3. All the sites show a springtime decrease of pCO2
90
except the Bay of Angels in the Mediterranean Sea, where the distinct increase of 91
pCO2 from early April to mid-August follows the one of temperature. On the contrary,
92
during that period pCO2@15°C shows a slight decrease probably due to a
93
combination of biological uptake of CO2 and emission of CO2 to the atmosphere.
94
Hence, the seasonal cycle of pCO2 in the oligotrophic Mediterranean continental shelf
95
(refer to wintertime nitrate (NO3-) concentrations in Table 2) is largely controlled by
96
temperature change unlike the other meso- and eutrophic continental shelves of Figure 97
3. 98
The Gulf of Biscay and the English Channel are characterized by a springtime 99
decrease of pCO2 and pCO2@15°C similar in timing and amplitude. During summer,
100
pCO2@15°C remains relatively constant in both areas suggesting that regenerated
101
primary production maintains during this period the low pCO2@15°C values attained
during the spring bloom (note however that pCO2 increases with temperature).
103
However, in late summer and early fall, pCO2@15°C further decreases in the Gulf of
104
Biscay while it increases in the English Channel. This can be related to an early fall 105
phytoplankton bloom in the Gulf of Biscay related to the input of nutrients as the 106
water column starts to de-stratify (Joint et al., 2001). In the English Channel, the 107
increase of pCO2@15°C probably results from heterotrophic processes related to the
108
degradation of the organic matter accumulated during the earlier part of the seasonal 109
cycle. Unfavorable light conditions to maintain regenerated primary production are 110
probably responsible for the onset in the English Channel of this marked period of net 111
heterotrophy in fall. Note that the English Channel is permanently well-mixed due to 112
its shallowness while the Gulf of Biscay is characterized by a seasonal thermal 113
stratification. This confirms the hypothesis that permanently well mixed systems are 114
less efficient in exporting organic matter and in absorbing atmospheric CO2, than
115
seasonally or permanently stratified systems (Borges, 2005). 116
The seasonal amplitude and in particular the spring decrease of pCO2 and
117
pCO2@15°C in the Southern Bight of the North Sea is much larger than in the English
118
Channel and the Gulf of Biscay (Fig. 3, Table 2). This seems to be related to higher 119
nutrient availability due to river inputs. Indeed, the salinity in the Gulf of Biscay is 120
close to the baseline value of the adjacent North Atlantic waters, while it is 121
significantly lower in the Southern Bight of the North Sea, also characterized by 122
significantly higher wintertime NO3- concentrations (Table 2). Unlike the English
123
Channel and the Gulf of Biscay, there is in the Southern Bight of the North Sea a 124
sharp increase of pCO2 and pCO2@15°C that follows closely the spring bloom,
125
suggesting a rapid remineralization of organic matter, followed by a steady increase of 126
pCO2@15°C from mid-June to early December. This in turn suggests the absence in
127
the Southern Bight of the North Sea of a period of regenerated primary production 128
that maintains pCO2 at low levels during summer in the English Channel and the Gulf
129
of Biscay. This is due to the strong top-down control of primary production by 130
mesozooplankton that prevents any significant phytoplankton development in the 131
Southern Bight of the North Sea, after the decline of the spring bloom (Lancelot et al., 132
2005). 133
In the Gotland Sea, pCO2 and pCO2@15°C sharply decrease from mid-March
134
to mid-May due to the spring bloom. After the exhaustion of inorganic nutrients, a 135
further decrease of pCO2@15°C is observed in June and July that has been attributed
to “luxury production” and related dissolved organic carbon (DOC) release (Thomas 137
et al., 1999) and/or to N2 fixation (Leinweber et al., 2005). This is consistent with an
138
annual amplitude of dissolved inorganic carbon (DIC) in the Gotland Sea that is 139
similar to the one in the Southern Bight of the North Sea although the wintertime 140
NO3- values are two to ten times lower. Note also that the much higher seasonal
141
amplitude of pCO2 and pCO2@15°C in the Gotland Sea than in the other four
142
continental shelves is related to the higher Revelle factor due to lower salinity and 143
total alkalinity (Table 2). 144
145
2.1.2. European coastal upwelling systems as sinks of atmospheric CO2 146
147
Although a relatively abundant literature reporting data on CO2 dynamics in
148
coastal upwelling systems is available (see review by Borges (2005)), annually 149
integrated air-water CO2 fluxes have been calculated in 3 other coastal upwelling
150
systems besides the Galician coast and the Gulf of Cadiz: off the Oman, California 151
and Vancouver Island coasts. The coastal upwelling systems off the Oman and 152
California coasts act as CO2 sources to the atmosphere, while the coastal upwelling
153
systems off the Vancouver Island coast, the Galician coast and the Gulf of Cadiz act 154
as sinks for atmospheric CO2. The two systems that act as CO2 sources (Oman and
155
California coasts) are characterized by disproportionately higher upwelling indices 156
that lead to much higher inputs of upwelled DIC and NO3- than in the systems that act
157
as CO2 sinks (Borges, 2005). This could be related to the fact that flushing rates are so
158
high and the nutrients and DIC inputs so intense that exhaustion of nutrients and 159
undersaturation of CO2 do not occur over the continental shelf in high upwelling
160
index systems, although probably occurring in upwelling filaments. It has also been 161
hypothesized that coastal upwelling systems located at high- and mid-latitudes are 162
CO2 sinks, while systems at low-latitudes are CO2 sources (Cai and Dai, 2004).
163
However, more data in other systems are required to validate this hypothesis. It has 164
also been argued that the pCO2 values of upwelled Eastern North Atlantic Central
165
Water off the North Western Iberian coast are lower (about 400 ppm) compared to 166
aged central waters of the South Atlantic, the Indian and the Pacific Ocean (Arístegui 167
et al., 2004). 168
169
2.1.3. Relationship between air-water CO2 fluxes and ecosystem metabolism 170
171
Net autotrophic ecosystems, where gross primary production (GPP) exceeds 172
community respiration (CR) decrease CO2 in the surrounding waters, and conversely
173
net heterotrophic systems (where GPP<CR) enrich the surrounding water in CO2.
174
Nevertheless, in coastal environments the link between the exchange of CO2 with the
175
atmosphere and the metabolic status of surface waters is not direct, as noted by 176
Gattuso et al. (1998) among others. Besides NEP, the net CO2 flux between the water
177
column and the atmosphere will be further modulated by other factors such as: 178
additional biogeochemical processes (e.g. CaCO3 precipitation/dissolution); exchange
179
of water with adjacent aquatic systems and the CO2 content of the exchanged water
180
mass; residence time of the water mass within the system; decoupling of organic 181
carbon production and degradation across the water column related to the physical 182
settings of the system. An extreme example is the case of coral reefs, where NEP is 183
close to zero, but due to intense calcification rates these systems act as sources of CO2
184
to the atmosphere. In certain shallow water temperate continental shelves, 185
calcification can also be a major driver of the air-water CO2 fluxes. For instance,
186
Borges and Frankignoulle (2003) hypothesized that the English Channel is not a 187
significant sink for atmospheric CO2 unlike adjacent systems such as the Gulf of
188
Biscay (Table 1) and the Southern Bight of the North Sea, due to the release of CO2
189
from extensive brittle star populations that on an annual scale balance the CO2
190
fixation by NEP. 191
In the course of the recent European project EUROTROPH (Nutrients Cycling 192
and the Trophic Status of Coastal Ecosystems), simultaneous and independent 193
measurements of metabolic process rates and air-water CO2 exchanges were carried
194
out in 3 coastal ecosystems (Fig. 4). For some of the cruises and some of the sites, the 195
CO2 fluxes and trophic status are in contradiction with the conceptual relationship
196
described above: during the second cruise in the Bay of Palma a positive NEP 197
(autotrophic status) is associated to a source of CO2 while during the first Randers
198
Fjord cruise a negative NEP (heterotrophic status) is related to a sink of atmospheric 199
CO2 (Fig. 4A). This can be related to the fact that the air-water CO2 fluxes are driven
200
(at least partly) by the mixed layer metabolic processes, while NEP values reported in 201
Figure 4A are (by definition) integrated throughout the water column. The Randers 202
Fjord and the Bay of Palma are, respectively, permanently haline stratified and 203
seasonally thermally stratified systems. If the air-water CO2 fluxes are compared to
net community production in the mixed layer (ML NCP), then there is an agreement 205
between the direction of the air-water CO2 fluxes and the trophic status (Fig. 4B).
206
Nevertheless, there is a quantitative disagreement between the intensity of the 207
metabolic rates and the air-water CO2 fluxes. In the case of the first Palma cruise, a
208
modest sink of atmospheric CO2 of about -2 mmol C m-2 d-1 is associated to a ML
209
NCP of about 30 mmol C m-2 d-1; conversely, the air-water CO2 fluxes in the Scheldt
210
estuary are 6 to 7 times higher than the ML NCP. This is most probably related to the 211
residence time of the water mass, in the order of 5 d in the Bay of Palma, and ranging 212
between 60 and 90 d (for freshwater) in the Scheldt estuary. Hence, in the Bay of 213
Palma, the water mass is flushed rapidly and biological activity will have a small or 214
undetectable effect on pCO2 and related air-sea CO2 fluxes (Gazeau et al., 2005b). On
215
the contrary, in the Scheldt estuary the long residence time of the water mass will lead 216
to a significant built up of DIC in the water column, and large emissions of CO2 to the
217
atmosphere. 218
219
2.1.4. Contribution of the ventilation of riverine CO2 to estuarine CO2 emission 220
221
The ventilation of riverine CO2 can contribute to the emission of CO2 from
222
inner estuaries and could explain the larger CO2 emission rates than those expected
223
from ML NCP in the Scheldt estuary and the Randers Fjord. The ventilation of 224
riverine CO2 has been estimated by Abril et al. (2000) to contribute to about 10% of
225
the overall CO2 emission from the Scheldt inner estuary. Based on the approach given
226
by Abril et al. (2000), the relative contribution of the ventilation of riverine CO2 to the
227
overall CO2 emission was computed in several estuaries (Fig. 5). This contribution
228
decreases with the increase of the freshwater residence time. In estuaries with a long 229
freshwater residence time, the riverine CO2 will be fully ventilated to the atmosphere
230
within the estuary and the overall CO2 emission from the estuary will be mostly
231
related to ML NCP. In estuaries with very a short freshwater residence time, the 232
enrichment of DIC from ML NCP will be less pronounced than in estuaries with a 233
long freshwater residence time, and the contribution of the ventilation of riverine CO2
234
will be larger. In the case of the Rhine estuary, the freshwater residence time is so 235
short that all the riverine CO2 is not ventilated to the atmosphere in the estuarine zone,
236
and part of it is instead exported to the adjacent coastal ocean. Hence, the potential 237
contribution of the ventilation of riverine CO2 is higher than the actual observed
emission from the estuary (Fig. 5). For the 11 estuaries in Figure 5, the median of the 239
potential emission from riverine CO2 amounts to about 10%. Hence, about 90% of the
240
emission of CO2 from these inner estuaries could be attributed to heterotrophic
241
activity. 242
243
2.1.5. Conceptual frame of the biogeochemical controls of air-water CO2 fluxes in 244
coastal environments
245 246
Based on the above discussion and also based on the synthesis by Borges 247
(2005) of CO2 dynamics and exchanges with the atmosphere in other coastal
248
environments (in particular at low latitudes), we propose a conceptual relationship of 249
CO2 fluxes and ML NCP, that summarises the drivers of CO2 fluxes in coastal
250
environments (Fig. 6). The trophic status of the mixed layer depends on the 251
combination of inputs of inorganic nutrients and of allochtonous organic carbon, and 252
is further modulated by light limitation and stratification. Low latitude continental 253
shelves act as sources of CO2, unlike high and mid latitude continental shelves. This is
254
related to some extent to the background signal of oceanic waters that circulate over 255
continental shelves that are typically CO2 oversaturated at low latitudes and CO2
256
undersaturated at mid and high latitudes. The metabolic status of the continental shelf 257
will further modulate this baseline signal. While ML NCP is positive in mid latitude 258
continental shelves such as the North Sea (Thomas et al., 2005a; b) this is not the case 259
of low latitude continental shelves such as the South Atlantic Bight (Cai et al., 2003) 260
due to larger inputs of terrestrial organic carbon (Borges, 2005). Coastal upwelling 261
systems are net exporters of organic carbon (e.g. Álvarez-Salgado et al., 2001), but 262
the upwelling index will modulate the inputs of nutrients and DIC, and the residence 263
time of the water mass, and determine if the system acts as a source or a sink for 264
atmospheric CO2. Microtidal estuaries due to their shorter freshwater residence time
265
and stratification are less heterotrophic and lower sources of CO2 than macrotidal
266
estuaries. In the former the relative contribution of the ventilation of riverine CO2 is
267
higher than the in the latter. Mangrove and saltmarsh surrounding waters are net 268
heterotrophic systems fuelled by the inputs of terrestrial intertidal vegetation and act 269
as sources of CO2. Note that there is increasing evidence that the emission of CO2
270
from the aquatic compartment of these systems is indirectly linked to diagenetic 271
organic carbon degradation, through the input of CO2 rich porewater (Borges et al.,
2003; Bouillon et al., 2006). Calcification is partly responsible for the emission of 273
CO2 from coral reefs to the atmosphere, as it leads to an increase of CO2 in the
274
oceanic waters circulating over these systems that are typically CO2 oversaturated.
275
Finally, purely thermodynamic effects related to water cooling or warming will 276
further modulate the exchange of CO2 between coastal aquatic environments and the
277
atmosphere, at seasonal and annual timescales. 278
279
2.2. Scaling of CO2 fluxes in coastal environments and comparison at European scale 280
with other aquatic and terrestrial compartments
281 282
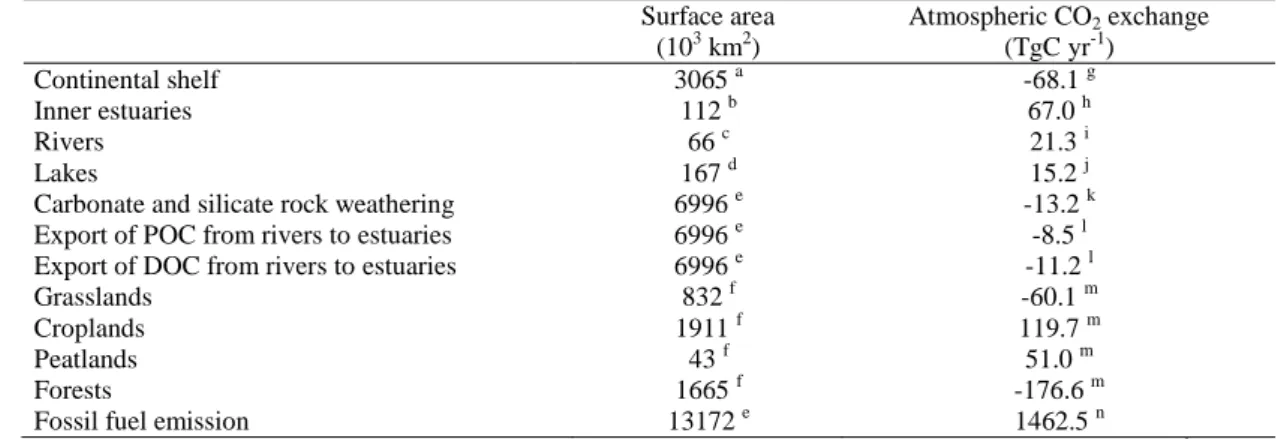
Based on the air-water CO2 fluxes from Table 1, the continental shelf surface
283
area estimates from Table 3, we scaled the CO2 fluxes in European coastal
284
environments and compared them to CO2 fluxes from other aquatic and terrestrial
285
compartments gathered from literature (Table 4). The values reported in table 4 were 286
estimated with very different degrees of confidence, in particular, the CO2 fluxes from
287
lakes and rivers must be considered as first order estimates. The sink of atmospheric 288
CO2 over the continental shelf of about -68 TgC yr-1 is highly significant and for
289
instance comparable to the sink associated to the terrestrial vegetation of -66 TgC yr-1 290
(sum of grasslands, croplands, peatlands and forests) based on a carbon-stock change 291
modelling approach (Janssens et al., 2005). However, the sink of CO2 over continental
292
shelves could be almost fully balanced by the emission of CO2 from inner estuaries of
293
about 67 TgC yr-1. However, this value should be considered with caution and most 294
probably corresponds to an over-estimate. Indeed, assuming that during estuarine 295
transit 50% of river particulate organic carbon (POC) (Abril et al., 2002) and that 10% 296
of river DOC (Moran et al., 1999; Raymond and Bauer, 2000; Wiegner and 297
Seitzinger, 2001) are degraded, and that the produced CO2 is emitted to the
298
atmosphere within the inner estuary, then the potential emission of CO2 from estuaries
299
would be about 5.4 TgC yr-1 at European scale based on the export fluxes of river 300
DOC and POC (Table 4, from Ludwig et al., 1996). This value is more than ten times 301
lower than the one scaled from the fluxes computed from pCO2 field data (Table 4).
302
There is growing evidence that lateral inputs of DIC and organic carbon in estuaries 303
significantly contribute to overall CO2 emission to the atmosphere (Cai and Wang,
304
1998; Cai et al., 1999; 2000; Neubauer and Anderson, 2003; Gazeau et al., 2005c). In 305
the Scheldt estuary, lateral inputs of freshwater, DIC and labile total organic carbon 306
correspond to, respectively, 10%, 22% and 41% of the riverine inputs (respectively, 307
Soetaert et al., 2006; Gazeau et al., 2005c; Vanderborght et al., 2006). In the Satilla 308
River estuary, lateral DIC inputs from the extensive saltmarshes are 12 times higher 309
than the river inputs (Cai and Wang, 1998). Hence, it seems unlikely that lateral 310
inputs can explain the large discrepancy between the scaled air-water CO2 fluxes and
311
those computed from the fate of riverine organic carbon. This discrepancy can have 312
several other origins. For instance, pCO2 data in inner estuaries have been mostly
313
obtained in macrotidal estuaries, and microtidal estuaries that seem to be 314
characterized by lower CO2 emissions are under-represented in the present
315
compilation (only Randers Fjord). Most of the CO2 flux values in inner estuaries from
316
Table 1 were derived from floating chamber measurements. This method has been 317
assumed to artificially enhance the exchange of CO2 across the air-water interface
318
(Raymond and Cole, 2001). However, there is a growing body of evidence that this 319
method provides reasonable flux estimates (Kremer et al., 2003; Guérin et al., 2006). 320
Furthermore, it has been established that tidal currents significantly enhance gas 321
transfer velocities in inner estuaries (Zappa et al., 2003; Borges et al., 2004) compared 322
to other aquatic systems. As already noted by Abril and Borges (2004) and by Borges 323
(2005), the surface area of inner estuaries given by Woodwell et al. (1973) is most 324
probably an overestimate. For instance the surface area of the European estuaries, 325
lagoons, salt marshes and mud flats has been estimated to 25 103 km2 based on the 326
Coordination of information on the environment (CORINE) Land Cover programme 327
(Uher, 2005). The total surface area of the European coastal wetlands (that aggregates 328
lagoons, deltas, estuaries, coastal wetlands and tidal wetlands) from the Global Lakes 329
and Wetlands Database (GLWD) is 36 103 km2 (Lehner and Döll, 2004). These 330
estimates that aggregate various near-shore ecosystems are 3 to more than 4 times 331
lower than the surface area of European estuaries alone of 112 103 km2 given by 332
Woodwell et al. (1973). 333
Table 4 also shows that the emission of CO2 to the atmosphere from
334
continental aquatic compartments (streams, rivers and lakes), could be highly 335
significant when compared to the absorption of CO2 from the atmosphere due to
336
carbonate and silicate rock weathering, and to the export of organic carbon from 337
rivers to the coastal ocean. These high CO2 emission rates result from net
338
heterotrophy of the aquatic compartment, fuelled by terrestrial organic carbon inputs, 339
and from the flux of dissolved CO2 originating from soil respiration (Kling et al.,
1991; Jones and Mulholland, 1998; Cole and Caraco, 2001; Jones et al., 2003; Duarte 341
and Prairie 2005). Importantly, the CO2 fluxes from continental aquatic compartments
342
are not accounted for in atmospheric CO2 inversion models and will increase the gap
343
with estimates of the terrestrial carbon sink based on carbon-stock change models. On 344
the other hand, the export of organic matter from rivers to the coastal ocean, and the 345
CO2 absorption from rock weathering are typically not accounted for in carbon-stock
346
change models. Table 4 shows that these fluxes could be highly significant and could 347
bridge the gap between estimates based carbon-stock change and inversion models 348
(Janssens et al., 2003; Siemens, 2003). Note, however, that a significant portion of 349
river POC export is due to freshwater phytoplankton and not soil carbon, unlike DOC. 350
Table 4 shows that the sink of atmospheric CO2 over European continental
351
shelves is negligible compared to the anthropogenic CO2 emission. Furthermore, the
352
flux of CO2 based on field pCO2 data is a mixed signal of the natural background
353
signal and the anthropogenic perturbation signal. Current estimates of the 354
anthropogenic CO2 sink of the coastal ocean based on DIC inventory (Sabine et al.,
355
2004) or modelling (Andersson and Mackenzie, 2004) approaches are roughly 356
proportional to its relative surface area, unlike the overall atmospheric CO2 sink that
357
is disproportionately more intense than its relative surface area. 358
359
3. Conclusions and future challenges 360
361
Scaled air-water CO2 fluxes at European level show that the sink of
362
atmospheric CO2 over continental shelves is highly significant and equivalent to the
363
carbon sink of the terrestrial biosphere. This sink of CO2 over continental shelves
364
could be almost fully balanced by the emission of CO2 from inner estuaries, that
365
would be 2.5 times higher than the emission for continental aquatic systems (rivers, 366
streams and lakes). However, the estimate of the potential emission of CO2 from the
367
fate in estuaries of river POC and DOC strongly suggests that the present scaled 368
emission of CO2 at European level is an overestimate. This is most probably related to
369
the inadequate value of the surface area of inner estuaries used in the scaling. 370
Nevertheless, the CO2 fluxes from estuaries are significant (49.9 molC m-2 yr-1)
371
compared to river and streams (26.9 molC m-2 yr-1) and lakes (7.6 molC m-2 yr-1) at 372
European scale. The emission of CO2 to the atmosphere from estuaries and their
373
strongly heterotrophic nature implies that a large fraction of river POC and DOC is 374
removed during estuarine transit and never reaches the adjacent continental shelf, let 375
alone the open ocean. This is consistent with the fact that little terrestrial organic 376
carbon can be accounted for in sediments or the water column of continental shelves 377
and open oceanic waters based on tracer approaches (e.g. Hedges et al., 1997). Hence, 378
an important bias is introduced in global and regional carbon models that use as 379
forcings the river carbon inputs directly into the open ocean basins. 380
Several challenges remain to better constrain the fluxes of CO2 in coastal
381
waters at European and global scales. The surface area of inner and outer estuaries 382
could be evaluated based on satellite imagery approaches (e.g. Salisbury et al., 2004) 383
in combination with geographical information system (GIS) approaches. More CO2
384
data are required to scale air-water CO2 fluxes in outer estuaries, that can be
385
significant for the overall flux from estuarine systems (Borges and Frankignoulle, 386
2002b; Borges, 2005; Schiettecatte et al., 2006a). While data for other trace gases are 387
available in several coastal sites of the Mediterranean Sea (Uher, 2005; Bange, 2005), 388
CO2 flux data have only been satisfactorily integrated at annual scale in the Bay of
389
Angels. It is most unlikely that data from this very narrow continental shelf (< 10 km) 390
are representative of wider continental shelves (off Tunisia, Alboran Sea) and 391
influenced by river inputs (Gulf of Lyons, Adriatic Sea) of the Mediterranean Sea. 392
Also, no CO2 data are available in inner or outer Mediterranean non-tidal estuaries.
393
Similarly, air-water CO2 fluxes in high latitude continental shelves are only available
394
for the Barents Sea, while little data have been reported in the Kara, East Siberian, 395
Laptev Seas (Semiletov, 1999). No data are available over the continental shelf of the 396
Black Sea, although influenced by the Danube, the largest European river (in terms of 397
discharge, length and drainage area). Little or no CO2 data are available in several
398
biogeochemically important ecosystems (seagrass beds, lagoons, saltmarshes) for 399
which surface area estimates would also require a careful (re)-analysis, based on 400
satellite and/or GIS approaches. Finally, inter-annual and decadal variability of air-401
water CO2 fluxes is so far undocumented in any coastal environment.
402 403
Acknowledgements 404
405
For data and information, we thank Andreas Andersson, Wei-Jun Cai, Ioen Delille, 406
Jean-Pierre Gattuso, Nathalie Gypens, Emma Huertas, John Huthnance, Ivan 407
Janssens, Joachim Kuss, Christiane Lancelot, Wolfang Ludwig, Jean-Claude Marty, 408
Peter Raymond, and Sebastian Sobek. For fruitful and inspiring discussions, we thank 409
the CARBOEUROPE working groups “Coastal Ecosystem Greenhouse Gas Budget”, 410
and “River Carbon Fluxes and Greenhouse Gas emissions from continental waters”. 411
Aida F. Ríos, Marion Gehlen and Fred T. Mackenzie reviewed a previous version of 412
the paper. This is a contribution to CARBOEUROPE - GHG (EVK2-CT-2002-413
20014), CARBOOCEAN (511176-2), EUROTROPH (EVK3-CT-2000-00040), 414
CANOPY (EV/12/20C), PEACE (SD/CS/03A), and SOLAS.BE (OA/00/025). AVB 415
is a research associate at the Fonds National de la Recherche Scientifique. This is 416
NIOO contribution n° 3818, and MARE contribution n°080. 417
418
References 419
420
Abril, G., Borges, A.V., 2004. Carbon dioxide and methane emissions from estuaries. 421
In: Tremblay, A., Varfalvy, L., Roehm, C., Garneau, M. (Eds.), Greenhouse gases 422
emissions from natural environments and hydroelectric reservoirs: fluxes and 423
processes. Springer-Verlag, 187-207. 424
Abril, G., Commarieu, M.-V., Maro, D., Fontugne, M., Guérin, F., Etcheber, H., 425
2004. A massive dissolved inorganic carbon release at spring tide in a highly turbid 426
estuary. Geophysical Research Letters 31, L09316 (doi:10.1029/2004GL019714). 427
Abril, G., Etcheber, H., Delille, B., Frankignoulle, M., Borges, A.V., 2003. Carbonate 428
dissolution in the turbid and eutrophic Loire estuary. Marine Ecology-Progress 429
Series 259, 129-138. 430
Abril, G., Nogueira, E., Hetcheber, H., Cabeçadas, G., Lemaire, E., Brogueira, M.J., 431
2002. Behaviour of organic carbon in nine contrasting European estuaries. 432
Estuarine, Coastal and Shelf Science 54, 241-262. 433
Abril, G., Etcheber, H., Borges, A.V., Frankignoulle, M., 2000. Excess atmospheric 434
carbon dioxide transported by rivers into the Scheldt estuary. Comptes Rendus de 435
l'Académie des Sciences Série II Fascicule A- Sciences de la Terre et des Planètes 436
330(11), 761-768. 437
Algesten, G., Wikner, J., Sobek, S., Tranvik, L.J., Jansson, M., 2004. Seasonal 438
variation of CO2 saturation in the Gulf of Bothnia: Indications of marine net
439
heterotrophy. Global Biogeochemical Cycles 18(4), GB4021 440
(doi:10.1029/2004GB002232). 441
Álvarez-Salgado, X.A., Doval, M.D., Borges, A.V., Joint, I., Frankignoulle, M., 442
Woodward, E.M.S., Figueiras, F.G., 2001. Off-shelf fluxes of labile materials by 443
an upwelling filament in the NW Iberian Upwelling System. Progress in 444
Oceanography 51(2-4), 321-337. 445
Amiotte-Suchet, P., Probst, J.L., 1995. A global model for present-day 446
atmospheric/soil CO2 consumption by chemical erosion of continental rocks
447
(GEM-CO2). Tellus B 47(1-2), 273-280.
448
Andersson, A.J., Mackenzie, F.T., 2004. Shallow-water oceans: a source or sink of 449
atmospheric CO2? Frontiers in Ecology and the Environment 2(7), 348-353.
450
Arístegui, J., Álvarez-Salgado, X.A., Barton, E.D., Figueiras, F.G., Hernández-Léon, 451
S., Roy, C., Santos, A.M.P., 2004. Oceanography and fisheries of the Canary 452
current/Iberian region of the Eastern North Atlantic. In: Robinson, A.R., Brink, 453
K.H. (Eds). The Sea 14, Harvard University Press, Cambridge, 877-927. 454
Bange, H.W., 2005. Nitrous oxide and methane in European coastal waters. Estuarine 455
Coastal and Shelf Science, this issue. 456
Bentley, D., Hart, V., Guary, J.C., Statham, P.J., 1999. Dissolved nutrient 457
distributions in the Central English Channel. Continental Shelf Research 19, 2083-458
2099. 459
Borges, A.V., 2005. Do we have enough pieces of the jigsaw to integrate CO2 fluxes
460
in the Coastal Ocean ? Estuaries 28(1), 3-27. 461
Borges, A.V.Frankignoulle, M., 2002a. Distribution of surface carbon dioxide and air-462
sea exchange in the upwelling system off the Galician coast. Global 463
Biogeochemical Cycles 16(2), 1020 (doi:10.1029/2000GB001385). 464
Borges, A.V., Frankignoulle, M., 2002b. Distribution and air-water exchange of 465
carbon dioxide in the Scheldt plume off the Belgian coast. Biogeochemistry 59(1 - 466
2), 41-67. 467
Borges, A.V., Frankignoulle, M., 2003. Distribution of surface carbon dioxide and air-468
sea exchange in the English Channel and adjacent areas. Journal of Geophysical 469
Research 108(C8), 3140 (doi:10.1029/2000JC000571). 470
Borges, A.V., Delille, B., Frankignoulle, M., 2005. Budgeting sinks and sources of 471
CO2 in the coastal ocean: Diversity of ecosystems counts. Geophysical Research
472
Letters 32, L14601 (doi:10.1029/2005GL023053). 473
Borges, A.V., Delille, B., Schiettecatte, L.-S., Gazeau, F., Abril, G., Frankignoulle, 474
M., 2004. Gas transfer velocities of CO2 in three European estuaries (Randers
475
Fjord, Scheldt, and Thames). Limnology and Oceanography 49(5), 1630-1641. 476
Borges, A.V., Djenidi, S., Lacroix, G., Theate, J., Delille, B., Frankignoulle, M., 477
2003. Atmospheric CO2 flux from mangrove surrounding waters. Geophysical
478
Research Letters 30(11), 1558 (doi:10.1029/2003GL017143). 479
Bouillon, S., Dehairs, F., Korntheuer, M., Schiettecatte, L.-S., Borges, A.V., 2006. 480
Sources and cycling of organic and inorganic carbon in the Tana estuary and delta 481
(northern Kenya). Limnology and Oceanography, submitted. 482
Cai, W.J., Dai, M., 2005. How significant is the coastal ocean uptake of atmospheric 483
CO2? – A province-based approach, ASLO 2005 Summer Meeting, 14-24 June
484
2005, Santiago de Compostela, Spain 485
Cai, W.J., Dai, M., 2004. Comment on "Enhanced Open Ocean Storage of CO2 from
486
Shelf Sea Pumping". Science 306(5701), 1477 (doi:10.1126/science.1102132) 487
Cai, W.-J., Wang, Y., 1998. The chemistry, fluxes, and sources of carbon dioxide in 488
the estuarine waters of the Satilla and Altamaha Rivers, Georgia. Limnology and 489
Oceanography 43(4), 657-668. 490
Cai, W.-J., Wang, Z.H.A., Wang, Y.C., 2003. The role of marsh-dominated 491
heterotrophic continental margins in transport of CO2 between the atmosphere, the
492
land-sea interface and the ocean. Geophysical Research Letters 30(16), 1849 493
(doi:10.1029/2003GL017633). 494
Cai, W.-J., Wiebe, W.J., Wang, Y.C., Sheldon, J.E., 2000. Intertidal marsh as a source 495
of dissolved inorganic carbon and a sink of nitrate in the Satilla River-estuarine 496
complex in the southeastern US. Limnology and Oceanography 45(8),1743-1752. 497
Cai, W.-J., Pomeroy, L.R., Moran, M.A., Wang, Y.C., 1999. Oxygen and carbon 498
dioxide mass balance for the estuarine- intertidal marsh complex of five rivers in 499
the southeastern US. Limnology and Oceanography 44(3), 639-649. 500
Chen, C.T.A., 2004. Exchanges of Carbon in the Coastal Seas. In: Field, C.B., 501
Raupach, M.R. (Eds), The Global Carbon Cycle: Integrating Humans, Climate, and 502
the Natural World, SCOPE , Island Press, Washington DC, 341-350. 503
Chen, C.T.A., Liu, K.K., Macdonald, R., 2003. Continental Margin Exchanges. In: 504
Fasham, M.J.R. (Ed.), Ocean biogeochemistry: a synthesis of the Joint Global 505
Ocean Flux Study (JGOFS), Springer-Verlag, Berlin, 53-97. 506
Cole, J.J., Caraco, N.F., 2001. Carbon in catchments: connecting terrestrial carbon 507
losses with aquatic metabolism. Marine and Freshwater Research 52(1), 101-110. 508
Cole, J.J., Caraco, N.F., Kling, G.W., Kratz, T.K., 1994. Carbon dioxide 509
supersaturation in the surface waters of lakes. Science 265(5178),1568-1570. 510
Copin-Montégut, C., 1993. Alkalinity and carbon budgets in the Mediterranean Sea. 511
Global Biogeochemical Cycles 7(4), 915-925. 512
Copin-Montégut, C., Bégovic, M., Merlivat, L., 2004. Variability of the partial 513
pressure of CO2 on diel to annual time scales in the Northwestern Mediterranean
514
Sea. Marine Chemistry 85(3-4), 169-189. 515
Dickson, A.G., Millero, F.J., 1987. A comparison of the equilibrium constants for the 516
dissociation of carbonic acid in seawater media. Deep-Sea Research I 34, 1733-517
1743. 518
Duarte, C.M., Prairie, Y.T., 2005. Prevalence of heterotrophy and atmospheric CO2
519
emissions from aquatic ecosystems. Ecosystems 8, 862-870. 520
Frankignoulle, M., Abril, G., Borges, A., Bourge, I., Canon, C., Delille, B., Libert, E., 521
Théate, J.-M., 1998. Carbon dioxide emission from European estuaries. Science 522
282(5388), 434-436. 523
Frankignoulle, M., Borges, A.V., 2001. European continental shelf as a significant 524
sink for atmospheric carbon dioxide. Global Biogeochemical Cycles 15(3), 569-525
576. 526
Frankignoulle, M., Middelburg, J.J., 2002. Biogases in tidal European estuaries: the 527
BIOGEST project. Biogeochemistry 59(1-2), 1-4. 528
Gattuso, J.-P., Frankignoulle, M., Wollast, R., 1998. Carbon and carbonate 529
metabolism in coastal aquatic ecosystems. Annual Review Ecology Systematics 530
29, 405-433. 531
Gazeau, F., Borges, A.V., Barrón, C., Duarte, C.M., Iversen, N., Middelburg, J.J., 532
Delille, B., Pizay, M.-D., Frankignoulle, M., Gattuso, J.-P., 2005a. Net ecosystem 533
metabolism in a micro-tidal estuary (Randers Fjord, Denmark): evaluation of 534
methods and interannual variability. Marine Ecology-Progress Series 301, 23-41. 535
Gazeau, F., Duarte, C.M., Gattuso, J.-P., Barrón, C., Navarro, N., Ruíz, S., Prairie, 536
Y.T., Calleja, M., Delille, B., Frankignoulle, M., Borges, A.V., 2005b. Whole-537
system metabolism and CO2 fluxes in a Mediterranean Bay dominated by seagrass
538
beds (Palma Bay, NW Mediterranean). Biogeosciences 2(1), 87-96. 539
Gazeau, F., Gattuso, J.-P., Middelburg, J.J., Brion, N., Schiettecatte, L.-S., 540
Frankignoulle, M., Borges, A.V., 2005c. Planktonic and whole system metabolism 541
in a nutrient-rich estuary (the Scheldt Estuary). Estuaries 28(6), 868-883. 542
Gazeau, F., Smith, S.V., Gentili, B., Frankignoulle, M., Gattuso, J.-P., 2004. The 543
European coastal zone: characterization and first assessment of ecosystem 544
metabolism. Estuarine, Coastal and Shelf Science 60(4), 673-694. 545
Gregg, W.W., Casey, N.W., McClain, C.R., 2005. Recent trends in global ocean 546
chlorophyll. Geophysical Research Letters 32, L03606 547
(doi:10.1029/2004GL021808). 548
Guérin, F., Abril, G., Serça, D., Delon, C., Richard, S., Delmas, R., Tremblay, A., 549
Varfalvy, L., 2006. Gas transfer velocities of CO2 and CH4 in a tropical reservoir
550
and its river downstream. Journal of Marine Systems, in press 551
Hedges, J.I., Keil, R.G., Benner, R., 1997. What happens to terrestrial organic matter 552
in the ocean? Organic Geochemistry 27(5-6), 195-212. 553
Hopkinson, C.S.J., Smith, E.M., 2005. Estuarine respiration: an overview of benthic, 554
pelagic and whole system respiration. In: del Giorgio, P.A., Williams, P.J.L. 555
(Eds.), Respiration in aquatic ecosystems, Oxford University Press, Oxford, 123-556
147. 557
Huertas, I.E., Navarro, G., Rodríguez-Gálvez, S., Lubián, L.M., 2005. Temporal 558
patterns of carbon dioxide in relation to hydrological conditions and primary 559
production in the northeastern shelf of the Gulf of Cadiz (SW Spain). Deep-Sea 560
Research II, in press 561
Huthnance, J.M., 2006. North-East Atlantic margins. In : Atkinson, L., Liu, K.K., 562
Quinones, R., Talaue-McManus, L. (Eds.), Carbon and Nutrient Fluxes in Global 563
Continental Margins, in press 564
Janssens, I.A., Freibauer, A., CIAIS, P., Smith, P., Nabuurs, G.J., Folberth, G., 565
Schlamadinger, B., Hutjes, R.W.A., Ceulemans, R., Schulze, E.D., Valentini, R., 566
Dolman, A.J., 2003. Europe's terrestrial biosphere absorbs 7 to 12% of European 567
anthropogenic CO2 emissions. Science 300(5625), 1538-1542.
568
Janssens, I.A., Freibauer, A., Schlamadinger, B., Ceulemans, R., Ciais, P., Dolman, 569
A.J., Heimann, M., Nabuurs, G.-J., Smith, P., Valentini, R., Schulze, E.-D., 2005. 570
The carbon budget of terrestrial ecosystems at country-scale - a European case 571
study. Biogeosciences 2, 15-26. 572
Joint, I., Wollast, R., Chou, L., Batten, S., Elskens, M., Edwards, E., Hirst, A., 573
Burkill, P., Groom, S., Gibb, S., Miller, A., Hydes, D., Dehairs, F., Antia, A., 574
Barlow, R., Rees, A., Pomroy, A., Brockmann, U., Cummings, D., Lampitt, R., 575
Loijens, M., Mantoura, F., Miller, P., Raabe, T., Alvarez-Salgado, X., Stelfox, C., 576
Woolfenden, J., 2001. Pelagic production at the Celtic Sea shelf break. Deep-Sea 577
Research II 48(14-15), 3049-3081. 578
Jones, M.T., Tabor, A.R., Weatherall, P., 1997. General Bathymetric Chart of the 579
Oceans, CD-ROM, British Oceanographic Data Centre, Proudman Oceanographic 580
Laboratory. 581
Jones Jr J.B., Mulholland, P.J., 1998. Carbon dioxide variation in a hardwood forest 582
stream: An integrative measure of whole catchment soil respiration. Ecosystems 1, 583
183-196. 584
Jones Jr J.B., Stanley, E.H., Mulholland, P.J., 2003. Long-term decline in carbon 585
dioxide supersaturation in rivers across the contiguous United States. Geophysical 586
Research Letters 30(10), 1495 (doi:10.1029/2003GL017056). 587
Kaltin, S., Anderson, L.G., Olsson, K., Fransson, A., Chierici, M., 2002. Uptake of 588
atmospheric carbon dioxide in the Barents Sea. Journal of Marine Systems 38(1-2), 589
31-45. 590
Kling, G.W., Kipphut, G.W., Miller, M.C., 1991. Arctic lakes and streams as gas 591
conduits to the atmosphere: Implications for tundra carbon budgets. Science 251, 592
298-301. 593
Kremer, J.N., Nixon, S.W., Buckley, B., Roques, P., 2003. Technical Note: 594
Conditions for using the floating chamber method to estimate air-water gas 595
exchange. Estuaries 26(4A), 985-990. 596
Kuss, J., Nagel, K., Schneider, B., 2004. Evidence from the Baltic Sea for an 597
enhanced CO2 air-sea transfer velocity. Tellus Series B 56(2), 175-182.
598
Lancelot, C., Spitz, Y., Gypens, N., Ruddick, K., Becquevort, S., Rousseau, V., 599
Lacroix, G., Billen, G., 2005, Modelling diatom and Phaeocystis blooms and 600
nutrient cycles in the Southern Bight of the North Sea: the MIRO model. Marine 601
Ecology-Progress Series 289, 63-78. 602
Lenhart, H.J., Pätsch, J., Kühn, W., Moll, A., Pohlmann, T., 2004. Investigation on 603
the trophic state of the North Sea for three years (1994–1996) simulated with the 604
ecosystem model ERSEM – the role of a sharp NAOI decline, Biogeosciences 605
Discussions 1, 725–754. 606
Lehner, B., Döll, P., 2004. Development and validation of a global database of lakes, 607
reservoirs and wetlands. Journal of Hydrology 296(1-4), 1-22. 608
Leinweber, A., Neumann, T., Schneider, B., 2005. The role of N2-fixation to simulate
609
the pCO2 observations from the Baltic Sea. Biogeosciences Discussions 2,
609-610
636. 611
Ludwig, W., Probst, J.L., Kempe, S., 1996. Predicting the oceanic input of organic 612
carbon by continental erosion. Global Biogeochemical Cycles 10(1), 23-41. 613
Mackenzie, F.T., Andersson, A.J., Lerman, A., Ver, L.M., 2005. Boundary exchanges 614
in the global coastal margin: Implications for the organic and inorganic carbon 615
cycles. In: Robinson, A.R., Brink, K.H. (Eds.), The Global Coastal Ocean- Multi-616
scale Interdisciplinary Processes, Harvard University Press, Cambridge, 193-225. 617
Mackenzie, F.T., Lerman, A., Andersson, A.J., 2004. Past and present of sediment 618
and carbon biogeochemical cycling models. Biogeosciences 1(1), 11-32. 619
Mehrbach, C., Culberson, C.H., Hawley, J.E., Pytkowicz, R.M., 1973. Measurements 620
of the apparent dissociation constants of carbonic acid in seawater at atmospheric 621
pressure. Limnology and Oceanography 18, 897-907. 622
Moran, M.A., Sheldon, W.M., Sheldon, J.E., 1999. Biodegradation of riverine 623
dissolved organic carbon in five estuaries of the southeastern United States. 624
Estuaries 22(1), 55-64. 625
Neubauer, S.C., Anderson, I.C., 2003. Transport of dissolved inorganic carbon from a 626
tidal freshwater marsh to the York River estuary. Limnology and Oceanography 627
48(1), 299-307. 628
Omar, A., Johannessen, T., Kaltin, S., Olsen, A., 2003. Anthropogenic increase of 629
oceanic pCO2 in the Barents Sea surface water. Journal of Geophysical Research
630
108(C12), 3388 (doi:10.1029/2002JC001628). 631
Pingree, R.D., Maddock, L., Butler, E.I., 1977. The influence of biological activity 632
and physical stability in determining the chemical distributions of inorganic 633
phosphate, silicate and nitrate. Journal of the Marine Biological Association of the 634
UK 57, 1065-1073. 635
Radach, G., Berg, J., Hagmeier, E., 1990. Long-term changes of the annual cycles of 636
meteorological, hydrographic, nutrient, and phytoplankton time series at 637
Heligoland and at LV Elbe 1 in the German Bight. Continental Shelf Research 10, 638
305-328. 639
Raymond, P.A., Bauer, J.E., 2000. Bacterial consumption of DOC during transport 640
through a temperate estuary. Aquatic Microbial Ecology 22(1), 1-12. 641
Raymond, P.A., Bauer, J.E., Cole, J.J., 2000. Atmospheric CO2 evasion, dissolved
642
inorganic carbon production, and net heterotrophy in the York River estuary. 643
Limnology and Oceanography 45(8), 1707-1717. 644
Raymond, P.A., Cole, J.J., 2001. Gas exchange in rivers and estuaries: Choosing a gas 645
transfer velocity. Estuaries 24(2), 312-317. 646
Sabine, C.L., Feely, R.A., Key, R.M., Lee, K., Bullister, J.L., Wanninkhof, R., Wong, 647
C.S., Wallace, D.W.R., Tilbrook, B., Millero, F.J., Peng, T.H., Kozyr, A., Ono, T., 648
Rios, A.F., 2004. The oceanic sink for anthropogenic CO2. Science 305(5682),
649
367-371. 650
Salisbury, J.E., Campbell, J.W., Linder, E., Meeker, L.D., Müller-Karger, F.E., 651
Vörösmarty, C.J., 2004. On the seasonal correlation of surface particle fields with 652
wind stress and Mississippi discharge in the northern Gulf of Mexico. Deep-Sea 653
Research II 51, 1187-1203. 654
Schiettecatte, L.-S., Gazeau, F., van der Zee, C., Brion, N., Borges, A.V., 2006a. Time 655
series of the partial pressure of carbon dioxide (2001-2004) and preliminary 656
inorganic carbon budget in the Scheldt plume (Belgian coastal waters). 657
Geochemistry, Geophysics, Geosystems, in press 658
Schiettecatte L.-S., Thomas, H., Bozec, Y., Borges, A.V., 2006b. High temporal 659
coverage of carbon dioxide measurements in the Southern Bight of the North Sea. 660
Marine Chemistry, submitted 661
Schneider, B., Kuss, J., 2004. Past and present productivity of the Baltic Sea as 662
inferred from pCO2 data. Continental Shelf Research 24(15), 1611-1622.
663
Schneider, B., Nausch, G., Nagel, K., Wasmund, N., 2003. The surface water CO2
664
budget for the Baltic Proper: a new way to determine nitrogen fixation. Journal of 665
Marine Systems 42(1-2), 53-64. 666
Semiletov, I.P., 1999. Aquatic sources and sinks of CO2 and CH4 in the polar regions.
667
Journal of the Atmospheric Sciences 56(2), 286-306. 668
Siemens, J., 2003. The European carbon budget: A gap. Science 302(5651),1681 669
Sobek, S., Tranvik, L.J., Cole, J.J., 2005. Temperature independence of carbon 670
dioxide supersaturation in global lakes. Global Biogeochemical Cycles 19, 671
GB2003 (doi:10.1029/2004GB002264). 672
Soetaert, K., Middelburg, J.J., Heip, C., Meire, P., Van Damme, S., Maris, T., 2006. 673
Long-term change in dissolved inorganic nutrients in the heterotrophic Scheldt 674
estuary (Belgium, The Netherlands). Limnology and Oceanography, 51(1), 409-675
423. 676
Takahashi, T. 2003. Ocean basin summations of sea-air flux computed using the 10 677
meter height winds,
678
http://www.ldeo.columbia.edu/res/pi/CO2/carbondioxide/text/10m_wind.prn. 679
Takahashi, T., Sutherland, S.C., Sweeney, C., Poisson, A., Metzl, N., Tilbrook, B., 680
Bates, N.R., Wanninkhof, R., Feely, R.A., Sabine, C., Olafsson, J., Nojiri, Y., 681
2002. Global sea-air CO2 flux based on climatological surface ocean pCO2, and
682
seasonal biological and temperature effects. Deep-Sea Research II 49(9-10), 1601-683
1622. 684
Thomas, H., Bozec, Y., De Baar, H.J.W., Elkalay, K., Frankignoulle, M., 685
Schiettecatte, L.-S., Borges, A.V., 2005a. The Carbon budget of the North Sea. 686
Biogeosciences 2(1), 87-96. 687
Thomas, H., Bozec, Y., Elkalay, K., De Baar, H.J.W., Borges, A.V., Schiettecatte, L.-688
S., 2005b. Controls of the surface water partial pressure of CO2 in the North Sea.
689
Biogeosciences 2(4), 323-334. 690
Thomas, H., Bozec, Y., Elkalay, K., De Baar, H.J.W., 2004. Enhanced open ocean 691
storage of CO2 from shelf sea pumping. Science 304(5673), 1005-1008.
692
Thomas, H., Ittekkot, V., Osterroht, C., Schneider, B., 1999. Preferential recycling of 693
nutrients - the ocean's way to increase new production and to pass nutrient 694
limitation? Limnology and Oceanography 44(8), 1999-2004. 695
Thomas, H., Schneider, B., 1999. The seasonal cycle of carbon dioxide in Baltic Sea 696
surface waters. Journal of Marine Systems 22(1), 53-67. 697
Tsunogai, S., Watanabe, S., Sato, T., 1999. Is there a "continental shelf pump" for the 698
absorption of atmospheric CO2? Tellus Series B 5(3), 701-712.
699
Uher, G., 2005. Distribution and air-sea gas exchange of reduced sulphur gases in 700
European coastal waters. Estuarine Coastal and Shelf Science, this issue 701
Vanderborght, J.-P., Folmer, I.M., Aguilera, D.R., Uhrenholdt, T., Regnier, P., 2006. 702
Reactive-transport modelling of a river-estuarine-coastal zone system: application 703
to the Scheldt estuary. Marine Chemistry, submitted 704
Wafar, M.V.M., Le Corre, P., Birrien, J.L., 1983. Nutrients and primary production in 705
permanently well-mixed temperate coastal waters. Estuarine, Coastal and Shelf 706
Science 17, 431-446. 707
Wanninkhof, R.McGillis, W.R., 1999. A cubic relationship between air-sea CO2
708
exchange and wind speed. Geophysical Research Letters 26(13),1889-1892. 709
Wanninkhof, R.H., 1992. Relationship between wind speed and gas exchange over the 710
ocean. Journal of Geophysical Research 97(C5), 7373-7382. 711
Wiegner, T.N., Seitzinger, S.P., 2001. Photochemical and microbial degradation of 712
external dissolved organic matter inputs to rivers. Aquatic Microbial Ecology 24, 713
27-40. 714
Wollast, R. 1998. Evaluation and comparison of the global carbon cycle in the coastal 715
zone and in the open ocean. In: Brink, K.H., Robinson, A.R. (Eds.), In: The Global 716
Coastal Ocean, John Wiley & Sons, 213-252. 717
Wollast, R., Chou, L., 2001. The carbon cycle at the ocean margin in the northern 718
Gulf of Biscay. Deep-Sea Research II 48(14-15), 3265-3293. 719
Woodwell, G.M., Rich, P.H., Hall, C.A.S., 1973. Carbon in estuaries. In : Woodwell, 720
G.M., Pecan, E.V. (Eds.), Carbon and the biosphere, Springfield, Virginia, 221-721
240. 722
Woolf, D.K., Thorpe, S.A., 1991. Bubbles and the air-sea exchange of gases in near 723
saturation conditions. Journal of Marine Research 34, 435-466. 724
Zappa, C.J., Raymond, P.A., Terray, E.A., McGillis, W.R., 2003. Variation in surface 725
turbulence and the gas transfer velocity over a tidal cycle in a macro-tidal estuary. 726
Estuaries 26(6), 1401-1415. 727
728 729
Table 1 – Range of pCO2, air-water CO2 fluxes, and corresponding gas transfer
730
velocity (k) in European coastal environments. The numbers in parentheses 731
correspond to site identification in Figure 2. W denotes the k-wind parameterization 732
given by Wanninkhof (1992), FC denotes direct measurements with a floating 733
chamber, and C denotes a constant k value. *: k = 8.0 cm h-1; **: k = 13.0 cm h-1. MiT 734
= micro-tidal; MaT = macro-tidal; RD = river dominated (i.e. most of the salinity 735
mixing occurs in the outer-estuary); LUI = low Upwelling Index; SS = seasonally 736
stratified; PS = permanently stratified; WM = permanently well-mixed. 737
Site (location in Fig.2) Characteristics °E °N pCO2
(ppm)
Air-water CO2 fluxes
(mol C m-2 yr-1)
k Ref. Inner estuaries
Randers Fjord (1) MiT 10.3 56.6 220-3400 2.2 FC 1
Elbe (2) MaT 8.8 53.9 580-1100 53.0 FC 2 Ems (3) MaT 6.9 53.4 560-3755 67.3 FC 2 Rhine (4) MaT; RD 4.1 52.0 545-1990 39.7 FC 2 Scheldt (5) MaT 3.5 51.4 125-9425 63.0 FC 2 Thames (6) MaT 0.9 51.5 505-5200 73.6 FC 2 Tamar (7) MaT -4.2 50.4 380-2200 74.8 C** 2 Loire (8) MaT -2.2 47.2 630-2910 64.4 C** 3 Gironde (9) MaT -1.1 45.6 465-2860 30.8 FC 2 Douro (10) MaT; RD -8.7 41.1 1330-2200 76.0 FC 2 Sado (11) MaT -8.9 38.5 575-5700 31.3 FC 2
Upwelling marginal seas
Galician coast (12) LUI -9.2 42.5 265-415 -2.2 W 4
Gulf of Cadiz (13) LUI -7.0 37.0 125-700 -0.4 W 5
Non-upwelling marginal seas
Barents Sea (14) SS 30.0 75.0 168-352 -3.6 W 6
Bothnian Bay (15) PS 21.0 63.0 150-550 +3.1 W 7
Baltic Proper (16) PS 20.0 57.0 156-475 -0.8 W 8
North Sea (17) SS 2.6 56.7 145-495 -1.4 W 9
English Channel (18) WM -1.2 50.2 200-500 0.0 W 10 Gulf of Biscay and Celtic Sea (19) SS -7.9 49.0 260-460 -0.8 W 11
Bay of Angels (20) SS 7.4 43.6 315-450 -0.6 W 12
1: Gazeau et al. (2005a); 2: Frankignoulle et al. (1998); 3: Abril et al. (2003 ; 2004); 4: Borges and Frankignoulle
738
(2002a); 5 :based on Huertas et al. (2005) but flux values converted to the k parameterization given by
739
Wanninkhof (1992) using conversion factors determined from the Rayleigh frequency distribution from values
740
originally computed from the k parameterization given by Woolf and Thorpe (1991); 6: based on data compiled
741
from Kaltin et al. (2002) and Omar et al. (2003), using National Centers for Environmental Prediction (NCEP)
742
daily wind speeds for the 1993-2003 period; 7: Thomas and Schneider (1999); 8: Algesten et al. (2004); 9: based
743
on Thomas et al. (2004) but flux values converted to the k parameterization given by Wanninkhof (1992) using
744
conversion factors determined from the Rayleigh frequency distribution from values originally computed from the
745
k parameterization given by Wanninkhof and McGillis (1999); 10: Borges and Frankignoulle (2003); 11: based on
746
pCO2 data from Frankignoulle and Borges (2001) and additional data obtained in May 2001 and 2002, and June
747
2004, the atmospheric pCO2 data from Mace Head, 6 hourly NCEP wind speeds from five grid points (-9.38°E
748
50.48°N; -7.50°E 50.48°N; -9.38°E 48.57°N; -7.50°E 48.57°N; -5.63°E 48.57°N), for the 1993-2004 period; 12:
749
based on pCO2 data from Copin-Montégut et al. (2004) extracted for the continental shelf
(http://www.obs-750
vlfr.fr/cd_rom_dmtt/dyf_main.htm), the atmospheric pCO2 data from Lampedusa Island, 6 hourly NCEP wind
751
speeds (7.50°E 42.86°N) for the 1998-2000 period
752 753 754
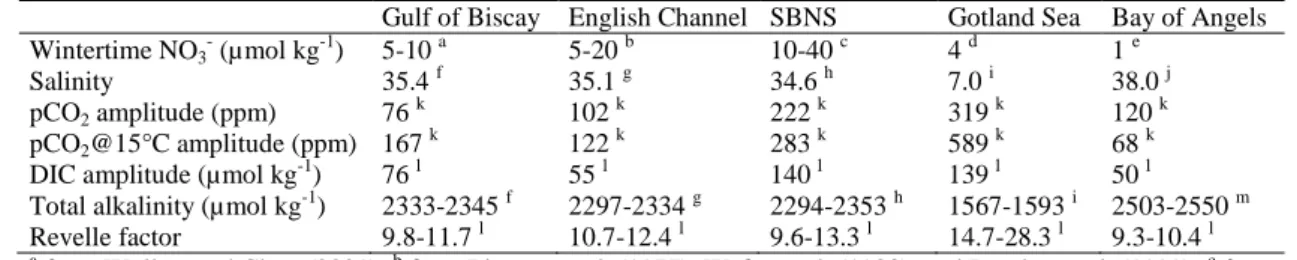
Table 2 – Wintertime nitrate concentration, salinity, seasonal amplitude of pCO2, of
755
pCO2 normalized to a constant temperature of 15°C (pCO2@15°C), and of DIC, range
756
of total alkalinity and of the Revelle factor, in 5 temperate European continental 757
shelves (Gulf of Biscay, English Channel, Southern Bight of the North Sea (SBNS), 758
Gotland Sea (Baltic Sea), and Bay of Angels (Mediterranean Sea)). 759
Gulf of Biscay English Channel SBNS Gotland Sea Bay of Angels Wintertime NO3- (µmol kg-1) 5-10 a 5-20 b 10-40 c 4 d 1 e Salinity 35.4 f 35.1 g 34.6 h 7.0 i 38.0 j pCO2 amplitude (ppm) 76 k 102 k 222 k 319 k 120 k pCO2@15°C amplitude (ppm) 167 k 122 k 283 k 589 k 68 k
DIC amplitude (µmol kg-1) 76 l 55 l 140 l 139 l 50 l Total alkalinity (µmol kg-1) 2333-2345 f 2297-2334 g 2294-2353 h 1567-1593 i 2503-2550 m Revelle factor 9.8-11.7 l 10.7-12.4 l 9.6-13.3 l 14.7-28.3 l 9.3-10.4 l
a
from Wollast and Chou (2001); b from Pingree et al. (1977), Wafar et al. (1983), and Bentley et al. (1999); c from
760
Lenhart et al. (2004); d from Leinweber et al. (2005); e from the nearby monitoring station B in the Villefranche
761
roadstead (http://www.obs-vlfr.fr/Rade/); f from Frankignoulle and Borges (2001); g from Borges and
762
Frankignoulle (2003); h from Schiettecatte et al. (2006b); i from Schneider and Kuss (2004); j from
Copin-763
Montégut et al. (2004) extracted for the continental shelf (http://www.obs-vlfr.fr/cd_rom_dmtt/dyf_main.htm); k
764
from Figure 3; l computed from salinity, temperature, pCO2 and total alkalinity, using the carbonic acid
765
dissociation constants of Mehrbach et al. (1973) refitted by Dickson and Millero (1987); m computed from total
766
alkalinity versus salinity relationship for the Mediterranean Sea from Copin-Montégut (1993)
767 768 769
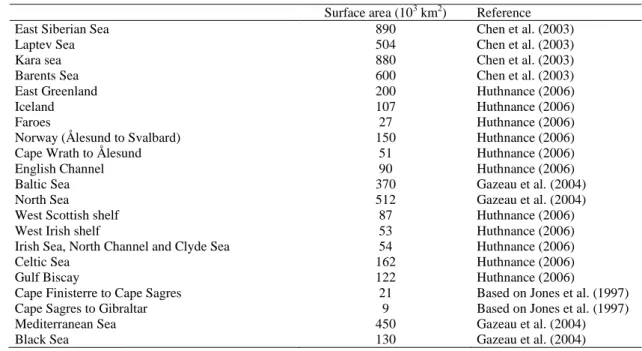
Table 3 – Surface area estimates of European and Russian Republic continental 770
shelves. 771
Surface area (103 km2) Reference
East Siberian Sea 890 Chen et al. (2003)
Laptev Sea 504 Chen et al. (2003)
Kara sea 880 Chen et al. (2003)
Barents Sea 600 Chen et al. (2003)
East Greenland 200 Huthnance (2006)
Iceland 107 Huthnance (2006)
Faroes 27 Huthnance (2006)
Norway (Ålesund to Svalbard) 150 Huthnance (2006)
Cape Wrath to Ålesund 51 Huthnance (2006)
English Channel 90 Huthnance (2006)
Baltic Sea 370 Gazeau et al. (2004)
North Sea 512 Gazeau et al. (2004)
West Scottish shelf 87 Huthnance (2006)
West Irish shelf 53 Huthnance (2006)
Irish Sea, North Channel and Clyde Sea 54 Huthnance (2006)
Celtic Sea 162 Huthnance (2006)
Gulf Biscay 122 Huthnance (2006)
Cape Finisterre to Cape Sagres 21 Based on Jones et al. (1997) Cape Sagres to Gibraltar 9 Based on Jones et al. (1997)
Mediterranean Sea 450 Gazeau et al. (2004)
Black Sea 130 Gazeau et al. (2004)
772 773