Superparamagnetic colloids in
viscous fluids
A. Darras
1,2,3, E. Opsomer
1,4, N. Vandewalle
1& G. Lumay
1The influence of a magnetic field on the aggregation process of superparamagnetic colloids has been well known on short time for a few decades. However, the influence of important parameters, such as viscosity of the liquid, has received only little attention. Moreover, the equilibrium state reached after a long time is still challenging on some aspects. Indeed, recent experimental measurements show deviations from pure analytical models in extreme conditions. Furthermore, current simulations would require several years of computing time to reach equilibrium state under those conditions. In the present paper, we show how viscosity influences the characteristic time of the aggregation process, with experimental measurements in agreement with previous theories on transient behaviour. Afterwards, we performed numerical simulations on equivalent systems with lower viscosities. Below a critical value of viscosity, a transition to a new aggregation regime is observed and analysed. We noticed this result can be used to reduce the numerical simulation time from several orders of magnitude, without modifying the intrinsic physical behaviour of the particles. However, it also implies that, for high magnetic fields, granular gases could have a very different behaviour from colloidal liquids. Superparamagnetic colloids are magnetic nanoparticles inserted in a matrix of non-magnetic material (polysty-rene or silica) to obtain particles with diameter d ranging from 100 nm to a few micrometres. These composite particles are combining a quasi-zero remanent magnetisation and a high magnetic response1–3. In applications,
the superparamagnetic colloids are functionalised to capture specific targets such as protein, cell or bacteria4–7.
After the capture, an inhomogeneous external magnetic field is applied to separate the superparamagnetic par-ticles by magnetophoresis8. Moreover, the formation of chains along the magnetic field enhances the separation
process. This technique is used for protein isolation, cell separation, waste capture, bacteria processing, chroma-tography, etc.1, 4–7, 9–17. More complex structures of superparamagnetic colloids can be obtained by using rotating
fields, even possibly leading to microswimmers or tracers of local dynamics18–32. Those complex structures open
ways to new kinds of applications as they have unique optical properties and offer tunable structures able to adapt to their environment and execute functional tasks20, 23, 26. However, the previous studies about those complex
structures focus on the properties of the structures obtained, without having a deep understanding of their for-mation process. To our knowledge, the only system for which some model of growth has been published in the literature up to now is the colloidal chains formed under constant magnetic fields.
In colloidal science, it is well known that particles tend to agglomerate due to van der Waals interactions33, 34.
In the present experiments, this agglomeration is prevented by covering the particles with carboxyl charged groups. These charged groups create a short range repulsion between the particles, typically within a range of 10 nm between the particles2, 35. This ensures the stability of the dispersion. In the following, this electrostatic
interaction is considered to define an effective size of the particles for the contact of particles which is 10 nm wider than the natural size of the particles1. However, when an external magnetic field →B is applied on the suspension,
the superparamagnetic particles acquire a magnetic dipole µ→ = →χVB , with the magnetic susceptibility χ of the particles and their volume V= 4πR
3 3, given their radius R. The particles then interact with each other through
dipolar interactions. The potential energy of magnetic interaction between two identical particles at distance r is therefore given by
1GRASP, CESAM - Physics Department, University of Liège, B-4000, Liège, Belgium. 2F.R.S.-FRNS, B-1000, Bruxelles,
Belgium. 3Experimental Physics, Saarland University, D-66123, Saarbrücken, Germany. 4Université Paris Diderot,
Sorbonne Paris Cité, MSC, CNRS (UMR 7057), F-75013, Paris, France. Correspondence and requests for materials should be addressed to A.D. (email: [email protected])
Received: 22 May 2017 Accepted: 29 June 2017 Published: xx xx xxxx
θ χ π µ θ = − U r R B r ( , ) 4 9 1 3 cos , (1) 2 6 2 0 2 3
with θ being the angle between the magnetic field →B and the line joining the centre of the particles. The force associated with this interaction is then
θ µ µ π θ θ → = − ∇→ = − → − →θ F U r r e e ( , ) 3 4 ((1 3 cos ) sin2 ), (2) m 0 r 2 4 2
with → =er →rr and → = → × →eθ ez er if →ez is the unitary vector perpendicular to the plan containing →er and →B (if →B
and →er are parallel, the orientation of →e is meaningless since θ = 0). Two particles then attract each other when θ
they are aligned with the field →B , while they repel each other if they are side-by-side. This interaction implies that two particles tend to aggregate in a chain aligned with the magnetic field →B . Several studies, both experimental and theoretical, have shown that superparamagnetic colloids self-organise into chains under those conditions, through diffusion-limited aggregation13, 36–41. Moreover, this aggregation is reversible, meaning that the chains
break up if the magnetic field →B is suppressed28, 42. Experimentally, chains of several particles are typically
observed36, 37, 39 and the growth is successfully described on short time (typically up to 300 s) by a Smoluchowsky
equation, predicting a power law behaviour of the mean size of the chains 〈s〉 ∝ tz after a transient behaviour36–40.
Current research usually focuses on more complex structures that have recently been observed under those con-ditions43, 44 and new theoretical models are currently studied in order to take them into account and describe their
properties41, 45, 46.
However, only little attention has been given to the influence of the viscosity of the surrounding fluid. Yet since the aggregation is diffusion-limited, the viscosity of the fluid could modify the aggregation mechanism through its influence on the diffusion coefficient. Moreover, the equilibrium state reached after a long time is still challenging on some aspects. Indeed, recent experimental measurements show deviations from pure analytical models in extreme conditions12, 43, 44. Current techniques of numerical simulations would require several years
of computing time to reach equilibrium state under some conditions: actual experiments last for hours and one second of simulation currently takes from 300 to 1100 hours of computer time. The most challenging situations are the ones leading to long chains, for which experiments and analytical models disagree12, 43.
In the present work, we first provide experimental observation of the influence of viscosity on the formation of such chains, and compare our results with previous theoretical models. Then, a modification of this viscosity is tested in simulations, in order to explore a wider range of viscosity. This allows to test conditions which are closer to dust suspensions in the air, where we observe another aggregation regime. Moreover, a nice application would be to use it to speed up the simulation time of colloidal system.
Experimental Setup
A sketch of the experimental pictures is presented in Fig. 1. The experiments were performed with superpara-magnetic microspheres dispersed in glycerol-water mixtures (Estapor
®
M1-070/60), with a volumic fraction of φ = 2 10−3. The viscosity of each liquid phase was measured before adding the particles to the suspension with a Haake-MARS rheometre. The measurements were consistent with the available tables47. The range of viscosity weused goes from 1 mPa s to 100 mPa s. We measured, by image analysis, a radius of particles r = 0.6 ± 0.3 μm while the mean susceptibility, obtained by magnetophoresis2, 48–50, was χ = 0.09 ± 0.03. Those values are consistent with
previous characterisation of that sample found in the literature28, 29. The suspension was placed inside a cylindrical
chamber of diameter D = 5 mm and thickness h = 50 μm. The chamber was formed by two parallel glass plates. The first glass plate was covered with a 50 μm layer of epoxy with the exemption of a circular region. A suspen-sion droplet of 1 μl was placed inside this region. Afterwards, the second glass plate was placed on the first one. A small quantity of low-viscosity silicon oil was placed on the epoxy to assess the watertightness of the chamber. A constant and homogeneous magnetic field B was generated by a constant current in surrounding coils at the Figure 1. Evolution of the chain formation along scaled time as observed from one of our experiments (left side of each picture) and one of our simulations (right side of each picture). The pictures are part of images obtained with a magnetic field B = 12 G. One can observe the formation of chains aligned with the external magnetic field and a qualitative similarity between experiments and simulations. The characteristic time tB is defined in
beginning of each experiment. The magnetic field produced by those coils was characterised with a Hall probe and was homogeneous within the precision range of the probe of 2% around the cell. The current in the coils had a constant intensity controlled by a programmable DC power supply GenH-750W from TDK Lambda, with a precision of 0.01 A. The suspension was observed from the bottom with a 10x magnification. The microscope used was an inverted microscope Olympus IX73, connected to a 4070M-CL Thorlabs Camera with 2048 by 2048 pixels of 16 Bits depth. The images were recorded with a frame rate of 1fps.
Experimental Results
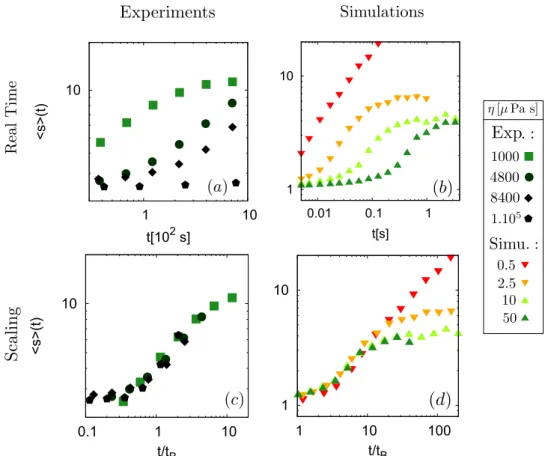
The time evolution of the system is shown in Fig. 2(a). We measured, as a function of time, the normalised mean size 〈s〉 of the chains, expressed in particles diameter, formed by the colloidal particles when the magnetic field is applied with an intensity of about 12 G. This size is obtained through image analysis, by averaging the major axis of ellipses fitted on each chain in the image (at least 2000 chains). For short time experiments, after a transient behaviour, we obtained a power law growth, with an exponent z close to 0.5, as observed in previous studies36, 37,
39. In Fig. 2(a), a clear trend can be seen on that graph: the higher the viscosity, the slower the growth.
For long times and low viscosity experiments, a saturation of the mean size 〈s〉 is observed as expected from the theoretical development of Andreu et al.12 and observed in some of our previous experiments (see Fig. 2(a))44.
Those differences of behaviour can be explained on the basis of the Smoluchowsky equation and the mecha-nism of diffusion-limited aggregation. Indeed, a diffusion-limited aggregation, taking into account an effective capture volume as suggested by Fermigier et al., has a characteristic time scale =
φ − Γ tB R D 24[(1/3) (1/3) ] 2 1/2 3/2 36, where
R is the radius of the particles, D is the diffusion coefficient of a single particle, Γ = χ π9µR Bk T ≡ k T2U
B B
2 3 2 0
0 is a
dimension-less parameter comparing the magnetic energy with the thermal energy kBT (χ is the magnetic susceptibility of
the particles and B is the magnetic field amplitude) and φ is the volume fraction of the particles. By using the Stokes-Einstein relation =D 6k Tπ ηBR , where η is the viscosity of the fluid, we can then write this characteristic time as
Figure 2. Log-log plots of the evolution of the mean size of the chains 〈s〉 during experiments ((a) and (c)) and simulations ((b) and (d)). The mean chains length is expressed in mean diameter of particles. After a transient behaviour whose duration depends on the viscosity, a power law growth is obtained with an exponent close to 0.5. In (a) and (b), a clear trend can be seen on that graph: the higher the viscosity, the slower the growth. In (c) and (d), the mean size of the chains is plotted as a function of the parameter t/tB, where the characteristic time is
defined in equation (3). All experimental curves then collapse. In simulations, if the magnetic field B = 12 G, curves collapse only for η > ηc, with ηc∈ .]2 5 Pa s; 5 Pa s[µ µ . Colours and points shapes correspondence are
πη φ = − . t R U 6 48[(1/3) (1/3) ] (3) B 3 1/2 3/2 0
When the data are expressed as a function of this dimensionless time t
tB, we obtain the plot in Fig. 2(c), where all the curves collapse. Since the only difference between our experiments is the viscosity η of the fluid, this collapse highlights that, in the range of our experiments, the viscosity simply slows down the aggregation process, without modifying further the intrinsic physical mechanism of aggregation.
But one can wonder: if increasing the viscosity simply slows down the growth process of the chains, would reducing the viscosity speed up this growth? This is what we tried to achieve in some numerical simulations, since fluids with lower viscosity than water are not abundant. Actually, the range of viscosity we explored is closer to the viscosity of the air. This means that experiments corresponding to those conditions should be performed with micrometric superparamagnetic dust or powder suspended in a gas, which is not easily available.
Numerical Simulations: Methods
Numerical simulations are useful tools to compare ideal experiments with, on the one hand, actual experiments or, on the other hand, theoretical expectations. Comparing with actual experiments can indicate if all the key physical ingredients are taken into account in the models. It can also be used to test some models in range of parameters which are not accessible experimentally. In the case of the analytical models for the mean chains length at saturation12, 51, such simulations can (dis)confirm the mathematical approximations. However, each
second of numerical simulation can require between 300 and 1100 hours of computer time, the most challenging situations being the ones leading to long chains12, 43. Speeding up the simulations is then critical to study the cases
corresponding to experiments which can last up to five hours.
In our study, simulations are realised using a Soft Sphere Discrete Element Method52–54 taking into account
the dipole-dipole interactions between the colloidal particles as well as the Brownian agitation in the system. The algorithm progresses with a constant time step Δt and solves Newton’s equations of motion at each iteration. The different force models we considered are described here below.
The normal contact force acting on two impacting particles is modelled using a linear spring-dashpot. The repulsive component is proportional to the overlap δ between particles while the energy dissipation during the collision is taken into consideration via an additional damping force. Altogether one obtains,
δ γ δ → = − → − → F k n d dt n , (4) n n
where kn is the spring stiffness, →n the normal unit vector and γ a complex function of kn and the restitution
coef-ficient ε. The tangential contact force is proportional to the relative slipping velocities vs of the particles. Moreover,
it is bounded by Coulomb’s criterion which yields in,
µ →
= − → ≤
Ft k v tt s , Ft d nF , (5)
where kt is a large positive constant, →t the tangential unit vector and μd is the dynamic friction coefficient.
When exposed to an external magnetic field, the colloidal particles acquire a magnetic dipole inducing long-range interactions between them. The associated force →Fm, given in equation (2), can directly be used in the
simulations for each pair of particles. However, in order to gain some computational time, we introduced a cut-off distance of about 12r by using a linked-cell method55.
The random motion of a particle due to its interaction with surrounding fluid molecules in the heat bath can be described by using a Langevin equation56. The drag force is considered to be →F = −6π ηR v→
d , where →v is the
velocity of the particle. The Brownian force →Fb is modelled as a Gaussian white noise process57, 58. One has,
ξ π η → =→ ∆ F R D t 6 2 (6) b
where Δt is the time step in the simulation and ξ→ is a vector of three random gaussian variables with zero mean and unit variance.
Since sedimentation plays an important role in the dynamics of our system, gravity and buoyancy, noted respectively →Fg and →Fa, have to be included.
It is worthwhile to notice that changing the viscosity parameter η then modifies both the drag force →Fd and the
Brownian force →Fb in the simulations (indeed, Fd ∝ η and Fb∝η D ∝ η). Besides this, all the other parameters
remain constant since they depend only on temperature and particles’ properties.
Numerical Simulations: Results
Simulations allow to test the scaling resulting from the former relation in equation (3) relating the characteristic time of the system tB ∝ η to the viscosity η for low viscosities. If this scaling is valid for every value of viscosity, it
can be used to speed up the simulations related to our experiments. Indeed, to some extent, it would mean simu-lations performed with a fluid viscosity which is lower than the ones available experimentally are faster but the colloidal assemblies retain the same geometrical properties and aggregation mechanisms. We then performed simulations for viscosities varying from η = 5 10−7 Pa s to 10−4 Pa s. As illustrated in curve Fig. 2b, the same trend as in experimental is observed: the higher the viscosity, the slower the growth. In curve and Fig. 2d, the curves
efficiently collapse with the scaling t/tB, except if the viscosity η is smaller than a critical value ηc, with
ηc∈ .]2 5 Pa s;5 Pa s[µ µ in the case of Fig. 2.
One might wonder if this viscosity threshold arises from a numerical bias. But in our numerical model, the main approximation depending on viscosity is the use of the Brownian force →Fb to create the diffusive motion of
the particles, according to the Langevin model56. This model is valid as long as the characteristic autocorrelation
time of the Brownian force, which is determined by the time step Δt ≈ 10−7 s in our simulations, is negligible compared to the characteristic viscous time 29ρηR2 ≈ 10−10ηPa s2, with ρ = 1200mkg3 the density of the particles. This
viscous time is defined as the characteristic speed relaxation time of a particle with a non-zero initial speed, if only the drag force is acting on it. We then have to respect 10 s−7 10 Pa s−10η 2 ⇔η10 Pa s−3 , which is always the case
in our simulations since the maximum value of the viscosity we used is η = 10−4 Pa s. Actually, we chose it accord-ingly to the time step fixed by the contact dynamics ∆t2π km
n
52–54. To be certain of the validity of this
assump-tion, we also performed some simulations with a reduced time step of Δt ≈ 10−8 s but no modification of the simulations’ results was then observed, for any of the viscosity we used. Eventually, this shows that the Langevin model is only better when the viscosity decreases, and the Langevin model can not be responsible for an artificial onset of the behaviour transition we observed in the simulations.
This means that no numerical effect is responsible for this behaviour transition. Actually, we believe that a new physical aggregation mechanism appears when the viscosity is below a critical threshold. Our hypothesis is that this threshold comes from the rise of a non-negligible drift due to the magnetic interactions of the grains. Indeed, every particle close to another one has a drift velocity due to the magnetic force exerted by this neighbour. On long times tt greater than the viscous time =η tη 6π ηmR , since the particles are in a viscous fluid, the motion
equation for average values of a single particle can be written →Fm =6π ηR v→D, where →vD is then the mean drift
velocity of the particles. The mean magnetic force →Fm depends on the actual particles density in the
neighbour-hood of the considered sphere, as well as its distance from the closest neighbour. However, a characteristic value is the maximum of this force Fm M, = πχ62 2 2µR B
0 , which is then related with the maximum drift velocity as
π η χ µ η = = . v F R R B 6 36 (7) D m, m M, 2 2 0
The impact of the magnetic interaction in the motion of the particles can then be assessed by the ratio of this maximum drift speed 〈vD,m〉 and the characteristic root mean square speed due to Brownian agitation =vth 3k TmB .
This defines a kind of Peclet number, comparing the drift transport due to magnetic interaction to the stochastic transport due to the Brownian motion
π η χ µ η ≡ = = = η Pe v v F R v F F R m k T B 6 36 3 , (8) D m th m M th m M v B , , , , 2 0 2 th
where Fη,vth is the modulus of drag force applied to a particle whose velocity is vth. The third expression above then expresses that this Peclet number Pe is also the ratio between the maximum magnetic force and the characteristic drag force during the Brownian motion. Actually, it is easy to show that this is the only force competition which is able to explain the breakdown of scaling depending on both magnetic field and viscosity. Indeed, the only forces concerned by (at least) one of those quantities are the drag force →Fd, the Brownian force →Fb (both depending only on viscosity) and the magnetic force →Fm (depending only on magnetic field). In our simulations, the ratio F
Fmb is ranging from 0 to approximately 10−2, which indicates that the magnetic force is always negligible compared to the thermal agitation. Then this competition is not likely to give rise to any transition. However, in our simula-tions, the ratio F
Fmd ranges from 0 to approximately 4, indicating that the magnetic force becomes, in some experi-ments only, greater than the characteristic viscous force. Any comparison between two forces including any another force would fail to completely explain our observations by missing at least one of this parameter. This is then enough to conclude that the competition between drag and magnetic interaction is the only one relevant to explain the scaling breakdown.
The last side of the equalities in equation (8) shows that, if the transition occurs for a critical value of Pec, there
is a value of viscosity η under which the mechanism of aggregation is intrinsically different from usual experi-mental observations. This minimal viscosity η = χ
µ lim R k Tm B Pe 36 3B C 2 0 2
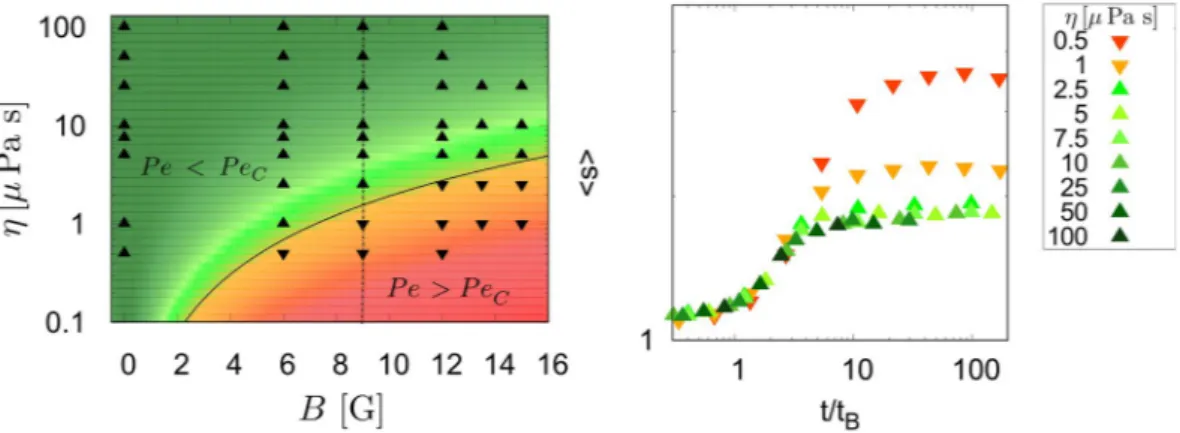
depends on B2 for a given set of particles. Through all the simulations we performed, with magnetic fields ranging from 0 G to 15 G, the range of viscosity for which the scaling efficiently collapses the curves is consistent with a critical value of the Peclet number PeC = 0.825 ± 0.025, see Fig. 3.
Another argument supporting this assumption is given by the analysis of the Mean Square Displacement (MSD) of the particles along time (see Fig. 4). Indeed, for a given magnetic field, the MSDs of the particles in that plane are similar for all viscosities were Pe < PeC, while it is not if Pe > PeC. This clearly means that when
Pe > PeC another kinematic process, acting against the diffusion, occurs. The existence of such threshold also
determines the limit of how the simulations related to a given experiment can be artificially sped up by decreasing the viscosity.
Conclusions
Our experiments show that modifying the viscosity of the fluid only rescales the characteristic time of the agglomeration process, without modifying the underlying physical mechanisms. Then, numerical simulations showed that another aggregation regime occurs for low viscosities or high magnetic field. This indicates that, for high magnetic fields, the granular gases could have a very different behaviour from colloidal liquids. This also implies that numerical simulations can be performed on systems with lower viscosities and still be an efficient model for the experiments. The benefit of using lower viscosities is that the computer time of the simulations can be reduced from several months to a few days. This then also opens new prospects to efficiently simulate complex colloidal systems.
References
1. Faraudo, J., Andreu, J. S. & Camacho, J. Understanding diluted dispersions of superparamagnetic particles under strong magnetic fields: a review of concepts, theory and simulations. Soft Matter 9, 6654–6664 (2013).
2. Faraudo, J. & Camacho, J. Cooperative magnetophoresis of superparamagnetic colloids: theoretical aspects. Colloid Polym. Sci. 288, 207–215 (2010).
3. Tavacoli, J. W. et al. The fabrication and directed self-assembly of micron-sized superparamagnetic non-spherical particles. Soft
Matter 9, 9103–9110 (2013).
4. Corchero, J. L. & Villaverde, A. Biomedical applications of distally controlled magnetic nanoparticles. Trends Biotechnol. 27, 468–476 (2009).
5. Kozissnik, B., Bohorquez, A. C., Dobson, J. & Rinaldi, C. Magnetic fluid hyperthermia: advances, challenges, and opportunity.
International Journal of Hyperthermia 29, 706–714 (2013).
6. Pankhurst, Q., Thanh, N., Jones, S. & Dobson, J. Progress in applications of magnetic nanoparticles in biomedicine. Journal of Physics
D: Applied Physics 42, 224001 (2009).
Figure 3. Left: global efficiency of the time scaling for all simulations. Upwards triangles are the simulations whose curves collapse with others with the same magnetic field. Downwards triangles are the simulations which don’t collapse. The black curve represents the transition Pe = PeC, and the colour gradient is related to the
difference of local Peclet number and its critical value Pe − PeC. Right: a graphic showing the curves obtained
for the simulations performed with a magnetic field B = 9 G. Those curves then correspond to the points on the dot-dashed line in the left graphic. The red and orange curves are not collapsing with the others and correspond to cases Pe > PeC. 0 5 10 15 20 25 30 35 40 0 0.2 0.4 0.6 0.8 1 1.2 <∆ R 2 > t/tB
Figure 4. Mean Square displacement of the particles in the horizontal plane as a function of dimensionless time. The mean square displacement is expressed in particles diameter and the time has been scaled by the aggregation characteristic time tB (equation (3)) to compare curves from various simulations under a magnetic
field of 9 G. All the curves corresponding to points in the region Pe < PeC collapse, while curves in the region
7. Colombo, M. et al. Biological applications of magnetic nanoparticles. Chemical Society Reviews 41, 4306–4334 (2012).
8. Yavuz, C. T., Prakash, A., Mayo, J. & Colvin, V. L. Magnetic separations: from steel plants to biotechnology. Chem. Eng. Sci. 64, 2510–2521 (2009).
9. Yavuz, C. T. et al. Low-field magnetic separation of monodisperse fe3o4 nanocrystals. Science 314, 964–967 (2006).
10. Krishnan, K. M. Biomedical nanomagnetics: a spin through possibilities in imaging, diagnostics, and therapy. IEEE Trans. Magn. 46, 2523–2558 (2010).
11. Jeong, U., Teng, X., Wang, Y., Yang, H. & Xia, Y. Superparamagnetic colloids: controlled synthesis and niche applications. Adv. Mater.
19, 33 (2007).
12. Andreu, J. S., Camacho, J. & Faraudo, J. Aggregation of superparamagnetic colloids in magnetic fields: the quest for the equilibrium state. Soft Matter 7, 2336–2339 (2011).
13. Gajula, G. P., Neves-Petersen, M. T. & Petersen, S. B. Visualization and quantification of four steps in magnetic field induced two-dimensional ordering of superparamagnetic submicron particles. Appl. Phys. Lett. 97, 103103 (2010).
14. Khalil, K. S. et al. Binary colloidal structures assembled through ising interactions. Nat. Commun. 3, 794 (2012).
15. Gurevich, Y., Mankov, Y. & Khlebopros, R. Self-assembly of superparamagnetic ferrihydrite nanoparticles. Dokl. Phys. 11, 478–481 (2013).
16. Martinez-Pedrero, F. & Tierno, P. Magnetic propulsion of self-assembled colloidal carpets: Efficient cargo transport via a conveyor-belt effect. Phys. Rev. Applied 3, 051003, doi:10.1103/PhysRevApplied.3.051003 (2015).
17. Carstensen, H., Kapaklis, V. & Wolff, M. Phase formation in colloidal systems with tunable interaction. Phys. Rev. E 92, 012303, doi:10.1103/PhysRevE.92.012303 (2015).
18. Müller, K. et al. Pattern formation and coarse-graining in two-dimensional colloids driven by multiaxial magnetic fields. Langmuir
30, 5088–5096 (2014).
19. Llera, M., Codnia, J. & Jorge, G. A. Aggregation dynamics and magnetic properties of magnetic micrometer-sized particles dispersed in a fluid under the action of rotating magnetic fields. J. Magn. Magn. Matter 384, 93–100 (2015).
20. Erb, R. M., Son, H. S., Samanta, B., Rotello, V. M. & Yellen, B. B. Magnetic assembly of colloidal superstructures with multipole symmetry. Nature 457, 999–1002 (2009).
21. Löwen, H. Colloidal dispersions in external fields: recent developments. Journal of Physics: Condensed Matter 20, 404201 (2008). 22. Froltsov, V., Blaak, R., Likos, C. & Löwen, H. Crystal structures of two-dimensional magnetic colloids in tilted external magnetic
fields. Physical Review E 68, 061406 (2003).
23. Martinez-Pedrero, F. & Tierno, P. Magnetic propulsion of self-assembled colloidal carpets: Efficient cargo transport via a conveyor-belt effect. Phys. Rev. Applied 3, 051003 (2015).
24. Martinez-Pedrero, F., Ortiz-Ambriz, A., Pagonabarraga, I. & Tierno, P. Colloidal microworms propelling via a cooperative hydrodynamic conveyor belt. Phys. Rev. Lett. 115, 138301 (2015).
25. Carstensen, H., Kapaklis, V. & Wolff, M. Phase formation in colloidal systems with tunable interaction. Phys. Rev. E 92, 012303 (2015).
26. Liu, P., De Folter, J. W., Petukhov, A. V. & Philipse, A. P. Reconfigurable assembly of superparamagnetic colloids confined in thermo-reversible microtubes. Soft Matter 11, 6201–6211 (2015).
27. Blair, D. L. & Kudrolli, A. Clustering transitions in vibrofluidized magnetized granular materials. Physical Review E 67, 021302 (2003).
28. Domínguez-García, P., Pastor, J. & Rubio, M. Aggregation and disaggregation dynamics of sedimented and charged superparamagnetic micro-particles in water suspension. Eur. Phys. J. E 34, 1–7 (2011).
29. Domínguez-García, P., Melle, S., Pastor, J. & Rubio, M. Scaling in the aggregation dynamics of a magnetorheological fluid. Phys. Rev.
E 76, 051403 (2007).
30. Merminod, S., Jamin, T., Falcon, E. & Berhanu, M. Transition to a labyrinthine phase in a driven granular medium. Physical Review
E 92, 062205 (2015).
31. Edmond, K. V. et al. Tracking the brownian diffusion of a colloidal tetrahedral cluster. Chaos-Woodbury 21, 041103 (2011). 32. Dreyfus, R. et al. Microscopic artificial swimmers. Nature 437, 862–865 (2005).
33. Everett, D. H. Basic principles of colloid science (Royal Society of Chemistry, 1988).
34. Israelachvili, J. N. Intermolecular and surface forces: revised third edition (Academic press, 2011). 35. Royall, C. P., Poon, W. C. & Weeks, E. R. In search of colloidal hard spheres. Soft Matter 9, 17–27 (2013).
36. Promislow, J. H., Gast, A. P. & Fermigier, M. Aggregation kinetics of paramagnetic colloidal particles. J. Chem. Phys. 102, 5492–5498 (1995).
37. Fraden, S., Hurd, A. J. & Meyer, R. B. Electric-field-induced association of colloidal particles. Phys. Rev. Lett. 63, 2373 (1989). 38. Kolb, M. Unified description of static and dynamic scaling for kinetic cluster formation. Phys. Rev. Lett. 53, 1653 (1984).
39. Martínez-Pedrero, F., Tirado-Miranda, M., Schmitt, A. & Callejas-Fernández, J. Formation of magnetic filaments: A kinetic study.
Phys. Rev. E 76, 011405 (2007).
40. Miyazima, S., Meakin, P. & Family, F. Aggregation of oriented anisotropic particles. Phys. Rev. A 36, 1421 (1987).
41. Ezzaier, H. et al. Two-stage kinetics of field-induced aggregation of medium-sized magnetic nanoparticles. The Journal of Chemical
Physics 146, 114902 (2017).
42. Darras, A., Fiscina, J., Vandewalle, N. & Lumay, G. Relating brownian motion to diffusion with superparamagnetic colloids.
American Journal of Physics 85, 265–270 (2017).
43. Faraudo, J., Andreu, J. S., Calero, C. & Camacho, J. Predicting the self-assembly of superparamagnetic colloids under magnetic fields.
Advanced Functional Materials 3837 (2016).
44. Darras, A., Fiscina, J., Pakpour, M., Vandewalle, N. & Lumay, G. Ribbons of superparamagnetic colloids in magnetic field. The
European Physical Journal E 39, 1–6 (2016).
45. Messina, R., Khalil, L. A. & Stanković, I. Self-assembly of magnetic balls: From chains to tubes. Physical Review E 89, 011202 (2014). 46. Vandewalle, N. & Dorbolo, S. Magnetic ghosts and monopoles. New Journal of Physics 16, 013050 (2014).
47. Cheng, N.-S. Formula for the viscosity of a glycerol-water mixture. Industrial & engineering chemistry research 47, 3285–3288 (2008).
48. Suwa, M. & Watarai, H. Magnetoanalysis of micro/nanoparticles: a review. Anal. Chim. Acta 690, 137–147 (2011).
49. De Las Cuevas, G., Faraudo, J. & Camacho, J. Low-gradient magnetophoresis through field-induced reversible aggregation. J. Phys.
Chem. C 112, 945–950 (2008).
50. Ally, J. & Amirfazli, A. Magnetophoretic measurement of the drag force on partially immersed microparticles at air–liquid interfaces.
Colloids Surf., A 360, 120–128 (2010).
51. Rojas, N., Darras, A. & Lumay, G. Self-assembly processes of superparamagnetic colloids. to be published (2017).
52. Pöschel, T. & Schwager, T. Computational granular dynamics: models and algorithms (Springer Science & Business Media, 2005). 53. Radjaï, F. & Dubois, F. Discrete-element modeling of granular materials (Wiley-Iste, 2011).
54. Ooi, J. Y., Magnanimo, V., Sun, J. & Luding, S. Particle modelling with the discrete element method: A success story of pardem.
Powder technology 293, 1–2 (2016).
55. Welling, U. & Germano, G. Efficiency of linked cell algorithms. Computer Physics Communications 182, 611–615 (2011). 56. Pottier, N. Physique statistique hors d’équilibre: processus irréversibles linéaires (EDP Sciences, 2007).
57. Peng, Z., Doroodchi, E. & Evans, G. Dem simulation of aggregation of suspended nanoparticles. Powder Technology 204, 91–102 (2010).
58. Li, A. & Ahmadi, G. Dispersion and deposition of spherical particles from point sources in a turbulent channel flow. Aerosol science
and technology 16, 209–226 (1992).
Acknowledgements
A.D. is financially supported by FNRS as research fellow. This work was financially supported by the FNRS (Grant PDR T.0043.14) and by the University of Liège (Starting Grant C-13/88). E.O. acknowledges financial support by the European Space Agency and Belspo (Prodex) via the VipGran Project. Authors thank their colleague Dr. Jorge Fiscina for useful advice about preparing and characterising glycerol-water mixtures. Authors also thank Charlotte Marique for spell-checking the manuscript.
Author Contributions
G.L. and A.D. conceived the experiments, A.D. conducted the experiment(s), E.O. and A.D. conceived the simulation code, E.O. wrote the simulation code, A.D. managed the simulations, E.O. and A.D. wrote the manuscript. A.D., E.O., G.L. and N.V. analysed the results and reviewed the manuscript.
Additional Information
Competing Interests: The authors declare that they have no competing interests.
Publisher's note: Springer Nature remains neutral with regard to jurisdictional claims in published maps and institutional affiliations.
Open Access This article is licensed under a Creative Commons Attribution 4.0 International License, which permits use, sharing, adaptation, distribution and reproduction in any medium or format, as long as you give appropriate credit to the original author(s) and the source, provide a link to the Cre-ative Commons license, and indicate if changes were made. The images or other third party material in this article are included in the article’s Creative Commons license, unless indicated otherwise in a credit line to the material. If material is not included in the article’s Creative Commons license and your intended use is not per-mitted by statutory regulation or exceeds the perper-mitted use, you will need to obtain permission directly from the copyright holder. To view a copy of this license, visit http://creativecommons.org/licenses/by/4.0/.