HAL Id: hal-02122482
https://hal.archives-ouvertes.fr/hal-02122482
Submitted on 21 May 2019HAL is a multi-disciplinary open access archive for the deposit and dissemination of sci-entific research documents, whether they are pub-lished or not. The documents may come from teaching and research institutions in France or abroad, or from public or private research centers.
L’archive ouverte pluridisciplinaire HAL, est destinée au dépôt et à la diffusion de documents scientifiques de niveau recherche, publiés ou non, émanant des établissements d’enseignement et de recherche français ou étrangers, des laboratoires publics ou privés.
Impact of freshwater release in the Mediterranean Sea
on the North Atlantic climate
Didier Swingedouw, Christophe Colin, Frédérique Eynaud, Mohamed Ayache,
Sébastien Zaragosi
To cite this version:
Didier Swingedouw, Christophe Colin, Frédérique Eynaud, Mohamed Ayache, Sébastien Zaragosi. Impact of freshwater release in the Mediterranean Sea on the North Atlantic climate. Climate Dy-namics, Springer Verlag, 2019, 53 ((7-8):), pp.3893-3915 (IF 4,708). �10.1007/s00382-019-04758-5�. �hal-02122482�
Impact of freshwater release in the Mediterranean Sea on
the North Atlantic climate
Didier Swingedouw1, Christophe Colin2, Frédérique Eynaud1, Mohamed Ayache1, Sébastien Zaragosi1
1
Environnements et Paléoenvironnements Océaniques et Continentaux (EPOC), UMR CNRS
5805 EPOC—OASU—Université de Bordeaux, Allée Geoffroy Saint-Hilaire, Pessac 33615, France.
2
Laboratoire GEOsciences Paris-Sud (GEOPS), UMR 8148, CNRS-Université de Paris-Sud,
Université Paris-Saclay, Bâtiment 504, 91405 Orsay Cedex, France.
Abstract
Sediment cores from the Mediterranean Sea have evidenced several periods of Sapropel deposition, which can be explained by events of anoxic bottom conditions. An explanation for such events calls for a very stratified sea, possibly related with freshwater input through increased precipitations and runoff discharges. It has been suggested that such a stratified Mediterranean Sea may in turn weaken the Atlantic meridional overturning circulation (AMOC) through changes in the Mediterranean overflow water (MOW). Nevertheless, models used to establish this result were relatively simple and the mechanisms leading to such an impact remained elusive. To improve on those previous studies, we analyse the impact of different freshwater releases with rates of 0.2, 0.1, 0.05 and 0.02 Sv (1 Sv=106m3/s) in the Mediterranean Sea using the IPSL-CM5A-LR model in a few multi-centennial simulations. We focus the analysis on the impact of a decrease in the Mediterranean overflow water (MOW) on the large-scale Atlantic circulation. We find a consistent change in horizontal currents in the upper Atlantic Ocean in all simulations in the first century, with a large enhancement of the northward current west of Rockall in the northeast Atlantic. Concerning the AMOC response, we identify three different processes that impact its fate. The first is related to changes in geostrophic currents at depth induced by the disappearance of the MOW, which tends to weaken the AMOC. On the contrary, the second enhances the AMOC and is associated with the increase in northward currents in the horizontal upper circulation. The last process is due to the spread of surface freshwater anomalies out of the Mediterranean Sea that freshens the North Atlantic convection sites and weakens the AMOC. Depending on the rate of the freshwater release, the strength and balance of these three processes are different. For rates larger than 0.05 Sv, we observe a strong reduction of the AMOC, while for lower rates, we notice an enhancement in the upper cell. The climatic response follows that of the upper AMOC with a warming of the North Atlantic for rates lower than 0.05 Sv and a cooling for higher rates. Given that past estimates of freshwater release in the Mediterranean Sea indicate rates lower than 0.05 Sv, we argue that Sapropel events may have enhanced of the upper AMOC and warmed of the North Atlantic.
1. Introduction
The Mediterranean Sea is a semi-enclosed basin where the inflowing fresh and relatively warm Atlantic surface water is transformed into a saltier and cooler (i.e. denser) water mass through the removal of heat and water at the sea surface (Wüst 1961). Mean evaporation exceeds precipitation and river runoff when averaged over the Mediterranean basin. The associated strong buoyancy loss promotes deep convection in the Mediterranean Sea, making it one of the few areas in the world where intermediate and deep waters are formed. In the Mediterranean, convection mainly occurs in the Aegean Sea, the Adriatic Sea, the Tyrrenian Sea and the Gulf of Lions. Following a pattern of anti-estuarine circulation, the deep Mediterranean water forms the Mediterranean Overflow Water (MOW) as it overflows at depth out from the Gibraltar Strait and enters the Atlantic Ocean (e.g. Millot & Taupier-Letage 2005; Lascaratos et al. 1999). This overflow, routed at depth, is denser than the water it pours out into in the Atlantic Ocean. Thus, the MOW cascades along the continental slope west of Gibraltar, mixing with the ambient water through entrainment processes, until it reaches a stability level where its buoyancy equals that of the surrounding water, at around 1000 m. Then, the MOW spreads at mid-depth westward into the subtropical North Atlantic and northward along the western European margin where it progressively mixes with central and eastern Atlantic water masses (Lozier & Stewart 2008) and thus contributes to the heat and salt budget of the Northeast Atlantic, and possibly to the strength of the Atlantic Meridional Overturning Circulation (AMOC, e.g. Rahmstorf 1998).
Reid (1978, 1979) argued that the deep core of MOW that flows northwards could play a key role for the upper stratification of the North Atlantic. This statement entails that the MOW potentially outcrops at high latitudes and becomes a source of salt that can influence, convection patterns in the Nordic Seas. McCartney & Mauritzen (2001) termed this process the “deep source hypothesis”, in reference to the fact that this salty water comes from the deeper ocean. However, the latter authors cautioned, on the basis of a diverse set of in situ oceanographic data, that most of the MOW flows westward, and very little is found northward at Wyville-Thomson Ridge (south of Faroe Islands), where the MOW flow is rather downward than upward. According to this argument from McCarthey & Mauritzen (2001), the MOW would mainly impact the North Atlantic deep-water formation through its mixing with the North Atlantic drift on its northeast pathway, providing a further source of salt to this already salty water. Nevertheless, it is possible that the lack of observational evidences at Wyville-Thomson Ridge and Rockall Trough in support of the “deep source hypothesis” may be related to the decadal variability of the MOW (Lozier & Stewart 2008). By comparing recent observation to ocean General Circulation Model (GCM) simulations, Bozec et al. (2011) showed that the northward-flowing branch of the MOW may have been larger between 1950 to 1975, before changing its course to become mainly westward from 1975 to 1995, and finally returning to a predominantly northward flow since 1995. These changes in flow pattern are associated with large-scale changes in wind forcing. Indeed, Holliday et al. (2008) observed a large salinity anomaly at 900 m at Rockall Trough that began circa 1995, which may be related to a return of the MOW at this location. This is in line with a westward shift of the subpolar front allowing for more water from the eastern Atlantic to enter the Rockall Trough. Thus, while the variability of MOW pathways has been successfully documented over the past few decades, its exact impact on the North Atlantic remains unclear.
Past marine sedimentation in the eastern Mediterranean Sea is characterized by the deposition of organic-rich dark layers, called sapropels (Rossignol-Strick et al. 1982), that
occurred during the last 13.5 millions of years (Rohling et al. 2015) and also recurrently during the Pleistocene. They are believed to be related to (i) increased abundance of organic matter sinking from surface water, induced by an increase of primary productivity, or (ii) reduced deep-water ventilation due to lower evaporation excess associated with freshwater discharge, or (iii) a combination of both processes (Cramp and O’Sullivan, 1999; Rohling et al., 2015). Many studies have shown that the timing of sapropel deposition usually concurs with precession minima. These periods are marked by a humid climate (intensification of the African monsoon) and high river runoff (Rossignol-Strick et al. 1982; Lourens 2004; Zhao et al., 2012), while deglaciation processes (sea level changes notably) can also play crucial role by bringing further freshwater release towards the Mediterranean (Grant et al. 2016). Thus, to explain Sapropel depositions, it has been proposed that the increase in runoff from the Nile (Rossignol-Strick et al. 1982) and other paleo-rivers, related to an enhanced African monsoon (Revel et al. 2010), may have led to a freshening of the Mediterranean Sea, preventing its ventilation through convective process. Such conditions may be notably related, during the early Holocene, to the hypothesis of the “Green Sahara” (e.g. Tierney et al. 2017), a period during which the West African monsoon was shifted further north. The associated increased moisture transport led to the development of vegetation over part of the present-day Sahara Desert and potentially strengthening the flow of the Nile. Furthermore, local precipitation increase over the Mediterranean Sea (Bosmans et al. 2012), runoff as well as melting from northern glaciers or ice sheets, associated with a connection to the Black Sea could have also strongly contributed to freshwater release in the Mediterranean Sea (Rohling et al. 2015). All these freshwater inputs may have led to the onset of a strong halocline that isolated deeper oceanic water from the surface, leading to decreased available oxygen and therefore anoxic conditions. The most recent Sapropel event, called S1, occurred between around 10.2 and 6.4 kyrs ago (Mercone et al. 2000). The exact processes leading to this Sapropel event are complex and may involve (i) pre-conditioning of the deep Mediterranean Sea supplied with colder and therefore denser waters during the glacial period, (ii) the inflow of nutrients by riverines and ocean-biogeochemical processes and (iii) the impact of freshwater input on ventilation (Grimm et al. 2015). In the present study, we will mainly focus on this third effect and will try to decipher the impact of a freshwater input in the Mediterranean on the Atlantic circulation.
Several studies have shown that the Mediterranean thermohaline circulation was highly sensitive to both rapid climatic changes occurring in the high latitudes of the Northern Hemisphere notably related to Heinrich Stadials (Rogerson et al. 2010; Toucanne et al. 2007; Toucanne et al. 2015), and to orbitally-forced (minimum of precession) modifications of the eastern Mediterranean freshwater budget mainly driven by increased freshwater discharge from the Nile and North African paleo-rivers (e.g. Bahr et al. 2015). Sapropel events may have led to a strong decrease of deep and intermediate water formation feeding the MOW as shown in recent paleo-reconstructions of water properties out of the Gibraltar Strait (Bahr et al., 2015). In particular, a link between the intensification of the MOW outflow and the modulation of the AMOC intensity was proposed during specific events of the last glacial periods (stadial events, e.g. Voelker et al., 2006; Penaud et al. 2011; 2010). It has been suggested that the intensity of the MOW and, more generally, the variations of the thermohaline circulation of the Mediterranean Sea could play a significant role in triggering a switch from a weakened to an enhanced state of the AMOC through the injection of saline Mediterranean waters into the intermediate North Atlantic (Rogerson et al. 2006; Voelker et al. 2006). Nevertheless, past reconstructions of the proportion and intensity of the MOW
along the European Margin are not available as quantified products (i.e. numerical values of salinity, flow intensity…). Some indirect proxies document its influence and variability through sediment accumulation modes (e.g Schönfeld & Zahn 2000; Rogerson et al. 2005; Bahr et al. 2014) but cannot fully attest to such a link between variations of the thermohaline circulation of the Mediterranean Sea and variations of the AMOC.
Using a simple climate model, Rahmstorf (1998) explored the influence of the MOW on the Atlantic Ocean circulation. He showed a small decrease of the whole AMOC when the MOW ceases. More recently, Ivanovic et al. (2014) conduced different sensitivity experiments, using HadCM3 climate model, by modifying the parametrization of the MOW in this model. They showed that halving the salinity of the Mediterranean can lead to a reduction of the AMOC by up to 4 Sv in its deepest part. On the contrary, the upper limb of the AMOC was slightly enhanced by up to around 2 Sv in its top 500 m (cf. their Figure 8). This complex response is explained by changes in the zonal and vertical density structure of the North Atlantic due to the disappearance of the MOW. These modifications may lead, through the thermal wind relationship, to modifications in the northward flow and shear and therefore the AMOC structure.
Using relatively high resolution (1/3°) ocean-only models, Jia (2000) and New et al. (2001) showed a strong influence of the MOW on the existence of the Azores current. In an ocean model simulation where the MOW was absent, the Azores current was also not present, contrary to a model simulation with a vigorous MOW. This link between the two can be simply understood through volume conservation between the mid-depth flow of the MOW and upper flow of the Azores current. If the former disappears, the latter is also removed. The exact interplay is in fact more subtle, as explained by Özgökmen & Crisciani (2001) who showed that the sinking of the mass of the MOW can be seen as a source of potential vorticity, which explains the formation of the Azores current, through the so-called beta plumes effect. This effect extends the influence of the MOW to the upper ocean along the latitude of the Gibraltar Strait until the western boundary of the Atlantic where it is responsible of the formation of the Azores current and the predominant zonal dimension of this current.
This relationship entails that the North Atlantic drift is deviated from its course by the MOW to create the Azores current. As such, the volume of the North Atlantic drift may be larger in the instance of a reduced export of MOW through the Gibraltar Strait. This may increase the input of subtropical water towards the North Atlantic and affect deep convection at higher latitudes. Such a potential effect was nevertheless not discussed in Jia (2000) and New et al. (2001), possibly due to the fact that they were considering ocean-only simulations, where the large-scale circulation is strongly constrained by the surface forcings that are imposed.
Thus, different processes related to Sapropel events can have an impact on the North Atlantic circulation and notably the AMOC. Nevertheless, up to now, a clear picture of the oceanic processes at play and of their interactions has not been provided. This remains crucial to evaluate the influence that Sapropel events may have on the larger-scale climate.
In the present study, we investigate the impact of a freshwater release in the Mediterranean catchment on the North Atlantic circulation, with a specific focus on the AMOC, and its climatic impact. For this purpose, we use a state-of-the-art ocean-atmosphere coupled model and perform different sensitivity experiments under preindustrial climatic conditions, where we release freshwater into the Mediterranean Sea at different rates.
2. Experimental design Description of the model
The ocean-atmosphere coupled model used in this study is the IPSL-CM5A (Dufresne et al. 2013) in its low-resolution (LR) version as developed for coupled model intercomparison project in its 5th phase (CMIP5). The atmospheric model is LMDZ5 (Hourdin et al. 2006) with a number of points in longitude, latitude and altitude of 96x96xL39 in a regular grid. The oceanic model is NEMO (version 3.2, Madec 2008) with a 182x149xL31 non-regular grid, including the LIM-2 sea ice model (Fichefet & Morales Maqueda 1997) and the PISCES (Aumont & Bopp 2006) module for oceanic biogeochemistry.
The NEMO model has been developed at LOCEAN, a laboratory dedicated to oceanographic study, with a specific interest in the convective processes in the Gulf of Lions (Madec et al. 1991). This may explain why particular attention has been given to correctly represent the Mediterranean Basin, even in ORCA2 global configuration with a relatively coarse resolution (grid boxes of around 90 km in the Mediterranean). In particular, local modifications of the scale factor have been integrated into the code to restrict the width of the Gibraltar Strait to make it more realistic (cf. Madec 2008). The model also uses a bottom boundary layer (BBL) parameterization, first introduced by Beckmann & Döscher (1997), which allows a better communication between two adjacent bottom cells at different levels, whenever a cell with denser water is located above a cell with lighter water. This parameterization strongly improves the representation entrainment processes in z-coordinate models (Beckmann & Döscher 1997). The communication is done here by a diffusive flux. To correctly reproduce the observed exchange at Gibraltar, the ORCA2 configuration uses a mesh grid whose latitude length e2u equals 20 km at the Strait of Gibraltar, to better reproduce the geometry of the strait. For the grid point located at the exit of the strait in the Atlantic Basin, the diffusion coefficient of the BBL is enhanced by four, based on empirical optimisation. This allow for more accurate characteristics of the MOW (as compared to present-day observations) to be reproduced at their equilibrium depth (Madec 2008). We argue here that this parameterization of the MOW is a significant improvement compared to previous studies that analysed the potential impact on the MOW using simpler and coarser ocean models (e.g Rahmstorf 1998; Bigg & Wadley 2001; Chan & Motoi 2003; Wu et al. 2007; Rogerson et al. 2010; Ivanovic et al. 2013). The parametrisation is based on present-day observations of the MOW, but is not entirely tuned towards these conditions, since the flow remains free to evolve in response to changes in deep water masses in the Mediterranean catchment. How well such a parametrization performs under different climatic conditions may be debated.
Description of the simulations performed
A control simulation has been run for more than 1000 years under preindustrial conditions. This simulation starts after thousands of years of spin up and has therefore almost no drift in the deep ocean (+0.011°C/millennium on average for the ocean temperature below 1000 m). Four sensitivity experiments have been performed where freshwater is released all over the surface of the Mediterranean Sea with a constant value. Indeed, since the resolution of the ocean model used is relatively coarse, the representation of the Mediterranean circulation remains crude. We thus do not attempt to use a strictly realistic representation of freshwater release, related for instance to an increase in the flow of the Nile. These idealised simulations mainly aim at analysing the impact of a change in the freshwater balance of the
Mediterranean Sea on the larger-scale circulation, especially in the North Atlantic. We add constant volumes of freshwater following the free surface scheme (Roullet & Madec 2000) used in NEMO with a constant rate of release all along the experiments. In order to test the model’s sensitivity to the amount of freshwater released, four different rates are used for the hosing: 0.2 Sv (HosMedHuge2), 0.1 Sv (HosMedHuge1), 0.05 Sv (HosMed05) and 0.02 Sv (HosMed02). These different rates are very large. Indeed, over the length of HosMedHuge1 (1000 years) and HosMedHuge2 (500 years), 3.15x10⁶ km3 of freshwater are added, which represents around 75% of the volume of the Mediterranean.
The estimate of the Nile’s discharge before the construction of the Aswan dam (that is, closer to the natural Nile river system than today’s) is of around 2.7 mSv (Rohling et al. 2015). Thus, the experience where we add 0.02 Sv of freshwater corresponds to an increase of the Nile runoff by around sevenfold. This is also nearly twice the magnitude used in Grimm et al. (2015) who added 9 mSv to the Nile runoff in their experiments to reproduce the last Sapropel 1. As a further element of comparison, the total precipitation rates over the Mediterranean Basin for the present-day period are estimated at 0.056 Sv (HOAPS, Andersson et al. 2010) to 0.086 Sv (ERA-interim, Simmons et al. 2007), while the total runoff is estimated at around 0.03 Sv (Ludwig et al. 2009). Thus, HosMed02 freshwater forcing can be duplicated by increasing precipitation rates in the Mediterranean Basin by around 15% (or around 11 mSv) in addition to the 9 mSv strengthening of the Nile runoff during Sapropel 1 used in Grimm et al. (2015). HosMedHuge1 stands for around a doubling of present-day freshwater forcing, which is therefore very large.
The rationale to use such large amounts is to evaluate the processes at play, even for extreme freshwater release events. Other potential sources of freshwater (release) around the Mediterranean Basin may also have existed before (preconditioning) and during Sapropel events, coming from both Africa, as runoff or additional precipitation (e.g. Bosmans et al. 2015), and from Europe, notably as runoff from the potential remnant melting of the Fennoscandia ice sheet in the Early Holocene (e.g. Thunell & Williams 1989; Ehrmann et al. 2007). For instance, during the last deglaciation, the Caspian and Black Seas collected meltwater from the southern margin of the Eurasian ice sheet via the Volga and Dniepr Rivers. Freshwater from the Back Sea has reached the Mediterranean Sea through the Bosphorus and Dardanelles Straits since around 23 kyrs BP (Vidal et al. 2010, Algan et al. 2001). The Caspian Sea became an additional source of freshwater to the Mediterranean Sea between 16 and 14 kyrs BP, when it overflowed into the Black Sea through the Kuma-Manych Strait (Tudryn et al. 2016).From 24 to 14 kyrs BP, the entire Fennoscandian ice sheet lost on average 250 km3 yr-1 (0.007 Sv), peaking at rates >3000 km3 yr-1 (>0.09 Sv) during the 14.9–12.9 kyrs BP interval (Patton et al. 2017). Thereby the meltwater from the south-eastern part of this ice sheet could have been evacuated into the Caspian Sea, before overflowing into the Black Sea and finally the Mediterranean Sea. Nevertheless, even for such extreme periods of melting, it is unlikely that large release rates of up to 0.2 Sv occurred. As such, the 0.2 Sv experiment ought not be considered as a reproduction of a realistic course of events, but should be taken as an idealized, extreme case simulation performed to evaluate the limit of the system analysed in this work.
3. Results
Validating the MOW in the control simulation
The meticulous oceanic representation in our model is key to accurately simulate MOW dynamics. Figure 1 shows the salinity map at 1000 m water depth using the Levitus (1988)
data and in the control simulation. The Mediterranean water outflow is clearly visible in both the observational-based and simulated maps, as high salinity water spreads westward into the Atlantic. The salinity of the outflowing water is relatively well reproduced in the model and is only slightly underestimated. Accordingly, the simulated MOW is close to the 1000 meters’ maximum found near Gibraltar in the observations, albeit at a slightly lower water depth (cf. longitude-depth section from Figure 1). We also notice a weak salinity lense at the surface at around 20°W corresponding to the salinity bias that can be found in the North Atlantic in this control experiment (e.g. Escudier et al. 2013). A recent estimate of the outflow of MOW at Gibraltar from Soto-Navarro et al. (2010) for the period 2004-2009 quantifies the outflow at -0.78 Sv (positive when eastward), which is similar to other estimates of -0.92 Sv by Bryden & Kinder (1991) and -0.82 Sv ± 0.05 Sv by Criado-Aldeanueva et al. (2012). In the model, the outflow from Gibraltar is -0.75 Sv, which is in good agreement with the aforementioned observation-based estimates. The evaporation minus precipitation and runoff budget at the surface of the Mediterranean Sea is +0.046 Sv, which is also close to the estimated +0.038 Sv from Soto-Navarro et al. (2010).
The precise convective processes at the regional scale are poorly resolved in this global climate model. Indeed, due to bias in atmospheric forcing and ocean representation (the Mediterranean Sea is represented with only 258 grid points in the global ocean model), the convection sites are not located exactly in the observed geographical location (not shown). Nevertheless, we argue that the main characteristics of the MOW and of the freshwater budget over the Mediterranean are relatively well reproduced and may allow an evaluation of the impact of a direct perturbation of the Mediterranean freshwater budget. We note however that important caveats remain and will be further discussed at the end of the paper, when all the related processes will be depicted.
Changes in the Mediterranean Sea
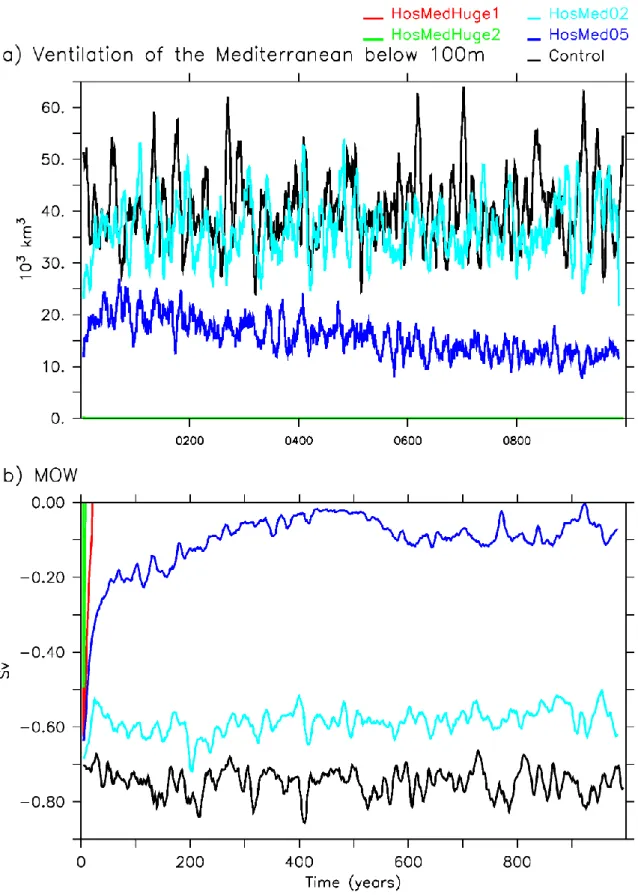
Deep convection and ventilation of the Mediterranean Sea are strongly affected by freshwater release into the basin. This is shown in Figure 2a: the ventilation of the Mediterranean Sea, defined by the volume of mixed layer water below 100 m from monthly mean outputs, is reduced in the first few years of the hosing simulations. Then, the ventilation in the different hosing experiments stabilizes to a constant value that is lower than the control simulation (Figure 2a). The impact of this decrease in ventilation on the MOW at Gibraltar is shown in Figure 2b. In HosMedHuge2 and HosMedHuge1, the circulation is reversed, with water leaving the Mediterranean at the surface and entering it at subsurface depths (Figure 3), following the typical circulation pattern in an estuarine system. The addition of freshwater in these two experiments provokes a remarkable change to the Mediterranean Sea which is no longer an evaporative basin but rather releases a net flow of water, mainly at the surface. It is also very clear from Figure 3, that the MOW, with its high salinity signature, has entirely disappeared in these two simulations, and this happens very rapidly (Figure 2). Conversely, HosMed05 and HosMed02 keep a qualitatively similar circulation as the control experiment (Figure 3). The MOW is, however, largely reduced in HosMed05, where outflowing water with a salinity larger than 35 g/kg is only around 0.1 Sv in the last century (reduction of 86%). For the same period, the outflow remains around 0.6 Sv in HosMed02 (reduction of 20%). Thus, our different experiments allow to evaluate very different possibilities of MOW changes, from a total collapse to a slight reduction of the MOW. We now focus on the impact this may have on the North Atlantic Ocean.
Impact on the North Atlantic
The changes in sea surface salinity (SSS) are shown in Figure 4. We focus on the changes occurring during the first and last centuries of our experiments. This allows to evaluate the relatively rapid adjustment of the climate system, and the longer adjustment, which could be key notably for the reconstructed long-term Holocene variability. A very clear drop in SSS exceeding 1 g/kg is noted in the Mediterranean Sea in all the hosing simulations in the first century, except in HosMed02. This negative salinity anomaly is propagated across the Gibraltar Strait into the Atlantic by advection processes. The spatial extent of the anomaly increases with the rate of freshwater released, being very small in HosMed05 and HosMed02 during the first century. The signature of the SSS anomalies becomes slightly clearer in the North Atlantic at the end of the millennium in the two latter experiments (Figure 4f, h). In all hosing simulations, a positive SSS anomaly occurs during the first century in the north-east Atlantic and in the Nordic Seas. The positive SSS anomaly disappears within 500 years in HosMedHuge2, and is barely noticeable in HosMedHuge1 after 1000 years, while it remains clear in HosMed05 and HosMed02 after 1000 years. A negative salinity anomaly can also be found at the core depth of the MOW, at around 1000m (not shown) in all the hosing simulations, confirming that our experimental design effectively removes part of the salty MOW, as previously illustrated in Figures 2 and 3.
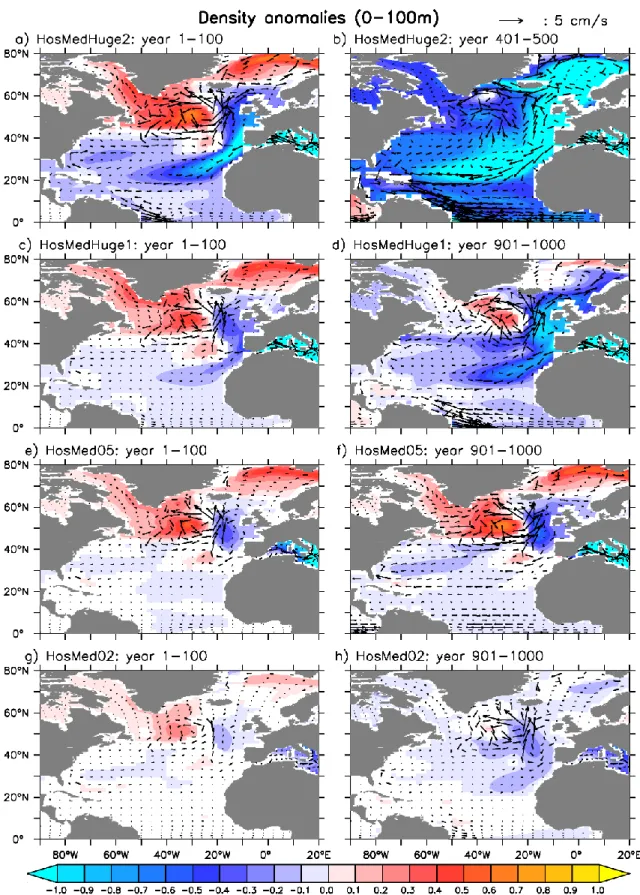
To explain the positive salinity anomaly in the north-east Atlantic, we analyse the changes in the upper ocean current (first 100 m) in Figure 5. In the first century, there are anomalous northward velocities in the upper ocean, west of the Rockall Trough, in all hosing simulations. Those anomalies can be interpreted as an increase in the North Atlantic drift and a decrease in the Azores current. This is supported by significant positive anomalies in the barotropic stream function in the subtropical gyre in all the hosing simulations (Figure 6) which highlight an increase in the flow towards the subpolar gyre and a decrease of the Azores current. These positive anomalies in the barotropic stream function in the subpolar gyre can reach up to over 3 Sv (Figure 6a, c, e and f).
The ocean velocity anomaly west of Rockall Trough can be related to the negative density anomaly to its east, and to the positive density anomaly to its west (Figure 5). Indeed, the density gradient resulting from these positive and negative density anomalies should lead to a northward geostrophic current. To explain the establishment of this density gradient, we can argue that the negative density anomaly found to the east can be associated with the negative SSS anomalies which come out of the Mediterranean area through Gibraltar Strait and propagate northeast along the European coast. This negative density anomaly then induces a northward geostrophic current west of Rockall Trough. This northward anomalous current brings warmer and saltier water from subtropical latitudes to the subpolar gyre (Figure 4), and may explain the development of the positive density anomaly west of the anomalous current that creates it. The northward salt transfer through this process further accentuates the density anomaly and constitutes a positive feedback. This positive feedback mechanism may have led to the strong northward ocean velocity anomalies west of Rockall Trough that are observed in all the hosing simulations, especially during the first century (Figure 5). The positive density anomaly in the subpolar North Atlantic also enhances the subpolar gyre as shown in Figure 6 in all the hosing simulations for the first century.
The decrease in the Azores current (Figure 6) can be related to the findings from Jia (2000) showing that a decrease of the MOW can lead to such a reduction in the Azores
current. The Azores current is weak in the model used here (around 1 Sv), possibly due to the coarse horizontal resolution of the ocean model that is not fine enough to sufficiently resolve it. In reality, the Azores current is a meandering current of around 100 km wide, with eastward velocities of 25-50 cm/s and is responsible for an eastward transport of around 10-15 Sv (cf. Jia 2000). The flux of this current is thus underestimated in the preindustrial simulation from the IPSL-CM5A-LR model by an order of magnitude.
The dipole pattern in density (Figure 5) found in all simulations for the first century, as well as the enhancement of the subpolar gyre, the enhancement of the North Atlantic drift and the reduction of the Azores current (also found in all the hosing simulations for the first century, cf. Figure 6) persists at the end of the simulation in HosMedHuge1, HosMed05 and HosMed02, but is suppressed after 500 years by a strong density reduction over the whole Atlantic in HosMedHuge2.
Changes in the AMOC
The increase of SSS in the subpolar gyre that occurs in all the hosing simulations for the first century, due to a stronger North Atlantic drift, strongly enhances convection there (not shown). Such an enhancement of deep water formation may then further amplify the strength of the subpolar gyre (Born et al. 2016) as well as the intensity of the AMOC (Tailleux & Rouleau 2010), which displays a non-uniform response as shown in Figure 7. In all hosing simulations, a positive (cyclonic) anomaly occurs in the upper 500 m of the North Atlantic Ocean during the first century, while the deeper layers are dominated by a negative (anticyclonic) anomaly.
In the longer term, the positive anomalies in HosMedHuge2 – and to a lesser extent in HosMedHuge1 – are entirely reversed by a strong negative anomaly caused by a weakening of the AMOC, although slightly positive values persists in the top 200 m (Figure 7). The persistence of positive anomalies also occurs in HosMed05 and HosMed02, but with larger values of up to +2-3 Sv, as a result of an enhancement of the upper part of the AMOC.
We interpret these positive and negative anomalies, occasioned by the response of the AMOC to the release of freshwater into the Mediterranean Sea, as the signature of three different processes that may affect the strength of the AMOC:
1. The first has been identified in Ivanovic et al. (2014) and is related to the geostrophic adjustment of the deeper layers of the North Atlantic Oceans in response to the collapse of MOW and the associated changes in zonal density gradients for depths between around 500 m and 2000 m.
2. The second can be related to changes in surface currents, notably in the strength of the North Atlantic drift, leading to an increase of SSS in the subpolar gyre which, in turn, enhances deep water formation, and therefore, the AMOC. 3. The last is associated with the slow propagation of freshwater anomalies from
the Mediterranean Sea to the upper layers of the North Atlantic Ocean, where freshwater is accumulated. This can lead to a large decrease of SSS and deep convection after a few decades of model integration, especially for large rates of freshwater release into the Mediterranean Sea.
The first and third mechanisms tend to decrease the strength of the AMOC. The first, however, mainly affects the relatively deep limb (< 500 m) of the North Atlantic, while the third acts on the AMOC as a whole through changes in (North Atlantic) deep-water formation. On the contrary, the second process produces a systematic enhancement of the AMOC, most effective in the upper layers of the ocean. We hypothesize that its deeper
signature is overpowered by the action of process 1 in the long term. The intensity of these different processes – and, in fine, the response of the AMOC – may ultimately depend on the rate of freshwater release. The different responses of the AMOC are illustrated in Figure 7. For freshwater release rates larger than around 0.05 Sv, process 3 becomes dominant (Figure 3), leading to a decrease in SSS in the long term, a decrease in deep-water formation, and a systematic weakening of the AMOC after a few centuries. For rates lower than around 0.05 Sv, a large increase in the upper limb of the AMOC subsists in the long term (Figure 7), which can be related to a persistent influence of process 2, whose effect remains very clear in the upper ocean (cf. Figures 4-6).
The geostrophic response which is associated with process 1 and affects the deeper limb of the AMOC, is not straightforward. According to geostrophic balance, the decrease in the strength of the AMOC at around 1000 m and below requires a decrease in the positive east-west density gradient at that depth. If the density at the western border of the Atlantic is unchanged in the simulations where the MOW is strongly reduced, the weakening of the AMOC must be related to an increase in density at the Atlantic’s eastern border at those depths. Such an increase in density in the eastern Atlantic could be counterintuitive when the high-salinity MOW, which cascades along the continental slope before stabilizing at depth, is reduced. A simple hydrostatic approach would rather suggest that its disappearance would lower the density in the eastern North Atlantic. The zonal structure of the density change in the Atlantic is shown along the latitude of the Gibraltar Strait in Figure 8. A decrease in density on the eastern flank of the Atlantic can be observed with reference to 0 (i.e. density with pressure reference at the surface, not shown). However, using 2 (i.e.
density with pressure reference taken at 2000m, which is close to where the negative anomaly of the AMOC is located) the density anomaly on the eastern flank of the Atlantic is positive below 1000m (Figure 8). Such a positive anomaly using 2 induces a decrease of the
zonal density gradient, and therefore a decrease in the strength of the AMOC at those depths. Thus, it is the non-linearity of the density function with depth, as illustrated in the Temperature-Salinity diagram in Figure 9, that may explain the increase in density towards the eastern flank of the Atlantic that ultimately leads to a weakening of the AMOC at depth. This effect therefore explains how process 1 impacts the AMOC. Indeed, the deep water corresponding to the MOW has a mean salinity and temperature of 35.6 g/kg and 7.4°C when averaged between 1000 and 2000 m in the eastern flank of the Atlantic at 36°N in the control simulation. Its salinity and temperature decrease to 34.9 g/kg and of 3.9°C, respectively, in HosMed05 after 100 years, leading to a clear decrease in density for depth larger than 1000 m, as illustrated in Figure 9.
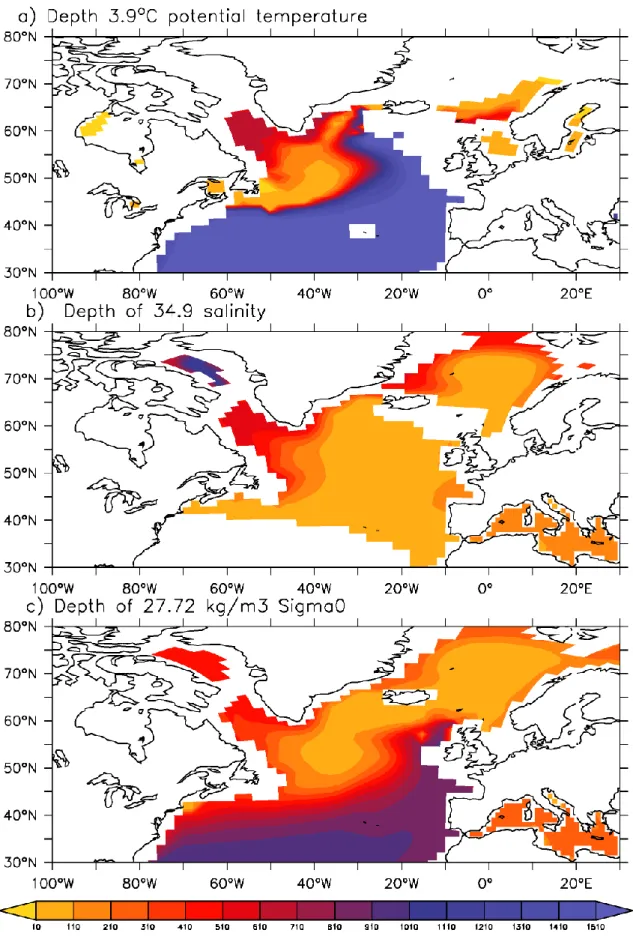
The water mass that replaces the MOW can be traced by using its main characteristics. For instance, in HosMedHuge1, we find that after 100 years (mean over year 91-100), the water in the grid box located just at the exit of Gibraltar at 1000 m has a mean temperature of 3.9°C and salinity of 34.9 g/kg (blue cross in Figure 9). This water mass replaces the MOW which has a mean temperature and salinity of 7.4°C and 35.6 g/kg (black cross in Figure 9) in the control simulation. The origin of this new water mass can be traced back where the isopycnal with the same temperature and salinity characteristics outcrops. Following this approach, a potential origin can be found in the region east of the Grand Banks (Figure 10). Nevertheless, such a simple approach does not account for the mixing processes that may modify the water masses on their pathways and is therefore a crude approximation of the exact origin of this water mass. Keeping in mind this limitation, it seems that the MOW has been replaced by a water mass formed in a northern location,
which has subducted under the Gulf Stream and spread to the eastern flank of the Atlantic, where its density is finally larger than water from the MOW at depths greater than 1000 m. This process partly explains why a decrease of the MOW leads to a weakening of the AMOC, mainly at depth, as described in Ivanovic et al. (2014, see their fresh-Med experiment in their Figure 8). The fact that the MOW is replaced by denser water, which is normally located at a similar depth but further west (not shown), therefore supports the fact that the MOW maintains this denser water further west when it is active. This entails that a stronger zonal density gradient at the latitude of Gibraltar is present when the MOW is stablished.
Impact on climate
One of the most significant impacts of the change in the strength of the AMOC is the modification in meridional heat transport over the Atlantic. The meridional heat transport at 45°N is larger by up to 0.08 PW at the end of HosMed05 compared to the control simulation. This represents an increase by up to 40% for freshwater release rates lower than or equal to 0.05 Sv. The heat transport is lower for larger release rates, approaching nil values in HosMedHuge2. We can explain this feature by the fact that the AMOC is enhanced in the upper layers (first 500 m) in HosMed05 and HosMed02. Since most of the temperature gradient of the ocean is found in this upper layer, the heat transport is particularly sensitive to a stronger AMOC in the upper layer (cf. Böning et al. 1996). This change in upper and deeper cells of the AMOC is illustrated in Figure 12. It shows that the positive anomalies in all hosing simulations are of at least 1.6 Sv and up to 3.6 Sv in HosMed05 which displays the largest change at the end of the simulations (Figure 12b). HosMed05 also shows the largest heat transport anomaly at 45°N (Figure 11a). The negative AMOC anomalies go from around -2.8 Sv in HosMed02 to -11 Sv in HosMedHuge2 (Figure 12c). Thus, we argue that it is mainly the positive AMOC anomalies in the upper cell that explain the increase in meridional heat transport at 45°N in HosMed05 and HosMed02. In HosMedHuge2, the large weakening in the deeper AMOC cell overpowers the positive anomaly in the upper cell and decreases the meridional heat transport. In HosMedHuge1, the positive and negative changes in the upper and lower AMOC cells are of similar magnitude in absolute value. In the first half of the HosMedHuge1 simulation, the heat transport at 45°N is larger than the control simulation (the same is also true during the first century of HosMedHuge2). In the second half of the simulation, the significant weakening of the deeper AMOC seems to suppress the increased heat transport, leading to non-significant differences with the control simulation at 45°N. This can be explained by the opposition of processes 2 and 3. While the former takes place rapidly, an accumulation of freshwater anomalies in the North Atlantic occurs in the latter, which eventually decreases the SSS in the deep-water formation regions and the whole AMOC (Figure 7).
At 26°N (Figure 11b), such a large increase in meridional heat transport does not occur. The heat transport in HosMed02 and HosMed05 remains very similar to the control simulation. On the contrary, it decreases in HosMedHuge2 by up to around 60%, and by up to around 20% in HosMedHuge1. This response at 26°N is in line with the changes in the AMOC (Figure 7). Indeed, the positive anomaly in the upper AMOC is mainly found north of this latitude. At 26°N the AMOC is weakened at all depths in HosMedHuge1 and HosMedHuge2, (in line with the large impact of processes 1 and 3), which explains the decrease in meridional heat transport.
Furthermore, our simulations show that atmospheric surface temperatures are affected by these general changes in the AMOC (figure 13). There is a positive temperature
anomaly in the first century in all the simulations (Figure 13), going from +0.42°C (HosMed02) to +1.1°C (HosMedHuge2) when averaged over the box [60°W-40°E, 45°N-85°N]. These positive anomalies could be related to the positive anomaly of the upper AMOC around 40°N (Figure 7). Later on, there is a strong cooling in HosMedHuge2 (-2.2°C when averaged over the former box) which is consistent with previously described fingerprints of AMOC collapse (Swingedouw et al. 2009; Jackson et al. 2015), notably a clear inter-hemispheric bipolar seesaw. A similar structure of temperature response after one millennium is found in HosMedHuge1, but with a more limited cooling in the North Atlantic, and a reduced warming in the South Atlantic. Remarkably, the Nordic Seas remain warm (+1.1°C when averaged over the box [20°W-40°E, 60°N-80°N]) in our HosMedHuge1 experiment, similarly to the first century (+1.8°C when averaged over the former box). This shows that the climatic response in this experiment is more complex than one might expect. We argue that the changes in the North Atlantic drift can explain the temperature anomalies that we observe (cf. Figure 5). Indeed, a stronger northward current in the west would entail enhanced temperate water transports towards the Nordic Seas, eventually melting sea ice (not shown), and leading to a large warming through albedo and insulation feedbacks. In HosMed05 and HosMed02, the warming of the North Atlantic persists over several centuries, while a slight cooling is observed in the South Atlantic. Thus, very different large-scale climatic responses can be triggered in the Atlantic, depending of the freshwater release rate in the Mediterranean. When process 2 is initiated (HosMed02, HosMed05), we observe a warming of around 1°C in the North Atlantic, while when process 1 and 3 are triggered (HosMedHuge2), the North Atlantic experiences a large cooling (<-2°C), related to a pronounced weakening of the AMOC.
The precipitation patterns also follow the temperature response and notably the bipolar seesaw (Figure 14). A large southward migration of the intertropical convergence zone (ITCZ) takes place in the experiments where the AMOC collapses or is significantly weakened (HosMedHuge2, HosMedHuge1), while there is a slight northward shift of the ITCZ in HosMed05 and HosMed02. This northward shift of the ITCZ significantly enhances precipitations over the Sahelian region.
Our experimental design is built on the hypothesis of enhanced Nile outflow in a “Green Sahara” (e.g. Tierney et al. 2017). Therefore, the increase in precipitation that we found in HosMed05 and HosMed02 can be explained by the following positive feedback mechanism. First, an increase in precipitation over Africa enhances the flow of the Nile, which weakens the MOW, thereby modifying the North Atlantic current. This leads to a warming of the North Atlantic and a slight northward shift of the ITCZ which, in turn, increases precipitation over the Sahel region. This positive feedback is nonetheless very weak as illustrated in Figure 15. The increase in precipitation over the African region [10°W-35°E, 8°N,20°N] is only +0.053 mm/day (significant at the 95% level) in the last century in HosMed05, and +0.055 mm/day in HosMed02, representing a ~6% increase compared to pre-industrial values from the control simulation. When averaged over the whole period, the differences are still significant at the 95% level, but amount to only ~3% for HosMed05 and HosMed02. This feedback becomes negative for freshwater releases equal to or greater than 0.1 Sv in the Mediterranean Sea (Figure 15). Nevertheless, such a rate represents a very large amount of freshwater discharge in the Mediterranean Sea: 0.1 Sv is at the upper end of estimates of freshwater release events in the past (cf. experimental design). We thus conclude that the feedback in response to Sapropel events linking AMOC, precipitations in the Sahel region
and freshwater discharge in the Mediterranean is likely positive, although it remains very weak in our simulations.
4. Discussions and conclusions
A set of four IPSL-CM5A-LR simulations, ran over a period of 500 to 1000 years, and beginning with idealized freshwater releases into the Mediterranean Sea, has allowed us to examine the possible impacts of a freshening of the upper layers of this sea, which is thought to have occurred during Sapropel events. Our simulations have shown that such events can have a significant effect on the larger-scale climate through a series of cascading processes. We have shown here that the North Atlantic Ocean circulation can exhibit very different responses to freshwater release in the Mediterranean Sea depending on the rate of the release. Three different processes can be initiated by freshwater release and lead to widely contrasting effects on the AMOC and, in fine, on the climate.
A first process is linked with changes in density at depth due to the weakening or disappearance of the MOW. When the MOW is reduced, there is an increase in density on the eastern Atlantic flank at around 1000 m and below. The water mass that replaces the MOW is denser than the original MOW. We find that this water mass originates from the northern North Atlantic, and is cooler, fresher, and thus denser than the MOW for the pressure at the considered depth (but not at the surface). This leads to a reduction of the zonal density gradient, and thus of the geostrophic meridional current that goes southward at depth, which weakens the deep AMOC.
The second process at play is related to changes in barotropic currents, linked to upper ocean salinity anomalies at the exit of Gibraltar, as well as changes in the Azores current due to the modification of the MOW. This leads to large changes in both the subpolar (increase by up to 15 Sv) and subtropical (decrease by up to 3 Sv) gyres, which enhance the subtropical water transport towards the subpolar region in the east of the North Atlantic, through the North Atlantic drift. As a consequence, there is a strong increase in surface salinity (up to 1 g/kg), and thereby of deep convective activity in the experiments where this process is dominant (HosMed05 and HosMed02). This leads to a strengthening of both the subpolar gyre and the upper AMOC cell.
The third key process at play is related to the outflow of the freshwater out of the Mediterranean Sea. This export of freshwater anomalies out of the Mediterranean is clearly dependent on the rate of the release at the surface. If the rate remains lower than or close to the evaporation-precipitation-runoff (EPR) budget of the Mediterranean Sea (HodMed02 and HosMed05), then the westward outflow through Gibraltar remains modest, and the negative salinity anomalies in the North Atlantic remain moderate. For release rates larger than the Mediterranean’s EPR budget, the westward outflow through Gibraltar surpasses the inflow of Atlantic water into the Mediterranean Sea, generating a net westward flow to compensate for the positive surface mass flux over the whole Mediterranean area. Furthermore, the SSS in the Mediterranean becomes lower than the SSS in the Atlantic at the exit of Gibraltar, inversing the surface density gradient between the Atlantic Ocean and the Mediterranean Sea. The surface outflow from the Mediterranean to the Atlantic generated by hydraulic forcing is associated with a massive export of freshwater into the Atlantic. This freshwater can spread to the North Atlantic convection sites, potentially leading to a collapse of the AMOC (e.g. HosMedHuge2).
For release rates lower than 0.05 Sv, these changes in ocean circulation increase the ocean heat transport in the North Atlantic and trigger sea ice feedbacks which lead to high
positive temperature anomalies centred in the Nordic Seas when freshwater release rates are lower than 0.05 Sv. For larger release rates, the third process becomes dominant and significantly weakens the AMOC. Changes in precipitations over Africa are following the southward migration of the ITCZ when the AMOC is strongly reduced. Conversely, for release rates lower than or equal to 0.05 Sv, precipitations are slightly enhanced in the Sahelian region, which may constitute a (weak) positive feedback for the Sahara greening.
The main limitation of the present study is the fact that only one model has been used. An important bias from the IPSL-CM5A-LR model is its large overestimation of sea ice cover in the Nordic Seas for present-day conditions (Escudier et al. 2013). This bias can potentially lead to an overestimation of the warming in this region in the simulation. Another limitation of this model concerns its ocean resolution, which does not properly resolve mesoscale dynamics which play a key part in both the MOW and the Azores current dynamics. Shifts in the Azores front position have also been suggested at millennial to sub-millennial scales on the basis of sedimentological records (e.g. Rogerson et al. 2005). The Azores current is underestimated in our control simulation compared to the real ocean, meaning that the impact of a decrease of the MOW on the barotropic circulation could be underestimated in our simulations. Thus, the increase in northward transport by the barotropic current could be far greater, suggesting that the potential associated climatic impact could also be underestimated. A more accurate assessment of the impact of ocean resolution on the response of the AMOC will require a fully coupled ocean-atmosphere model. Indeed, ocean-only models, as used in Jia (2000) and New et al. (2001), are strongly constrained by their surface fluxes which do not evolve enough with large-scale changes in the AMOC. Coupled models with eddy-permitting resolution in the ocean, are currently being developed (e.g. Saba et al. 2015) and may allow to perform high-resolution simulations in the near future. This may also enable one to evaluate the impact of changes in the MOW decadal variability in future climate projections.
A key aspect of our analyses concerns the role played by the rate of freshwater release in the Mediterranean Sea. It is clear that the experimental design from Ivanovitch et al. (2014) was missing such an aspect with their idealized simulation fresh-Med, where the freshening of the Mediterranean Sea was achieved by simply halving its salinity. In that sense, the present study provides completely new insights concerning the potential impact of enhanced freshwater input into the Mediterranean Sea on the large-scale ocean circulation.
Reconstructed SSS records indicate a decrease in salinity of around 2 g/kg in the Mediterranean Sea for the last Sapropel event (Kallel et al. 1997). Furthermore, different proxies collected out of the Gibraltar Strait in the Gulf of Cadiz seem to indicate that the MOW was weakened but not suppressed during Sapropel events (e.g., Bahr et al. 2015). Thus, we argue that HosMed05 and HosMed02 may be more representative of hydrological conditions of the Mediterranean Sea during the Sapropel deposition S1. Indeed, Grimm et al. (2015) have also assumed values of additional freshwater from the Nile of around 0.01 Sv. Other sources could also have contributed to freshening the Mediterranean Sea during S1, such as regional increases in precipitation and runoff. The reconnection of the Mediterranean Sea with the fresher Black Sea may also have played a role since it received the remnant melt water of the Fennoscandian ice sheet (connected to the Caspian Sea through the Volga river, which overflowed into the Black Sea through the Kuma-Manych Strait, cf. Tudryn et al. 2016). Nevertheless, all of these potential fluxes are likely to be lower than 0.1 Sv in total, even during periods of peak ice sheet melting.
Thus, the impact of the greening of the Sahara and deglaciation processes in the Early Holocene may be more in line with HosMed05 and HosMed02, and may therefore have led to an enhancement of the upper AMOC (up to 2-3 Sv), the subpolar gyre (up to 15 Sv) and the associated heat transport (up to 0.08 PW at 45°N). Several studies conducted on cold-water corals in the southwest of Rockall Trough and on SSS reconstructions South of Iceland confirmed a strong intensity and eastward extension of the subpolar gyre in the Early Holocene (Colin et al. 2010; Thornalley et al. 2009). Several processes were at play during and before (preconditioning) this period of Sapropel deposition, notably large remnant melting from the ice sheet (cf. Blaschek et al. 2015), as well as changes in insolation. Nevertheless, based on the present study, a decrease of the MOW can be clearly invoked to have participated in the intensification of the AMOC following the Early Holocene, as suspected by sortable silt proxy from Kissel et al. (2013) and the onset of convection in the Labrador Sea around 7 kyrs BP (Hillaire-Marcel et al. 2001). On the contrary, the end of the Green Sahara and of the Sapropel event around one to two millennia after 7 kyrs BP may have led to a weakening of the AMOC, which is also recorded in Kissel et al. (2013) proxy data. Thus, our sensitivity experiments indicate that the Mediterranean freshwater budget can play a key role in large-scale dynamics of the Atlantic. To validate and better quantify our hypothesis, separate transient simulations over large periods of the Holocene, that either include or exclude a freshening of the Mediterranean, will be necessary. Such simulations may shed further light on the greening of the Sahara which remains a key challenge in present-day AOGCM (e.g. Tierney et al. 2017).
Furthermore, our sensitivity experiments revealed the complexity of the response of the AMOC to changes in the MOW. The effects of the MOW on the AMOC are not homogeneous, but are rather expressed differently depending on depth. Then, the heat transport mainly depends on the upper AMOC cell (where the temperature gradient is located) so that changes in deep transport does not necessarily translates in meridional heat transport, as illustrated here (e.g. changes in AMOC and heat transport in HosMed05). These results suggest that reconstructions of water mass changes in the North Atlantic from a single depth should be interpreted carefully since they may not be representative of the large-scale, systematic response of the AMOC and meridional heat transport. A 3-dimensional approach must be integrated into the understanding of these modifications at different depths and spatial locations.
In the light of the aforementioned spatial disparities in the AMOC, we can argue that a stronger MOW does not necessarily lead to an enhanced AMOC (e.g. control vs. HosMed02) because of the complex response of the 3-dimensionnal current and most notably the second process (described in the subsection “Changes in the AMOC”) and its impact on the barotropic stream function. This result has implications concerning the hypothesis raised by Rogerson et al. (2006) or Voelker et al. (2006), namely that enhanced MOW after Heinrich events may participate in the recovery of the AMOC. Although a more intense MOW may contribute to increased salinities in the North Atlantic at depth, we have shown here that dynamical processes and changes in ocean circulation may have opposite effects on the surface salinity budget in the North Atlantic (e.g. further weakening of SSS in the North Atlantic in the control vs. HosMed02). Nevertheless, we should highlight that we are here considering control simulation with an active AMOC which may limit the potential implications of our results concerning this particular hypothesis.
Our results can also have implications concerning the impact of variability of the MOW for the recent period (e.g. Soto-Navarro et al. 2015; Jordà et al. 2017) and the future.
According to our results, a weakening of the MOW may induce an eastward extension of the SPG and a significant warming of the Nordic Seas and the neighbouring regions. If the opposite is true, we can assume that an enhancement of the MOW, related to a warmer and dryer Mediterranean area which is clear in CMIP5 projections (IPCC 2013), may lead to an enhancement of the Azores current, a weakening of the SPG, and a cooling of the Nordic Seas. Such a phenomenon is normally already included in CMIP models. Nevertheless, given the poor representation of the Azores current in our simulations, it remains possible that the impact of a disappearance of the MOW may be even greater than our simulations suggest. Finally, we argue that a full monitoring of the MOW would be useful to estimate and predict potential impacts of MOW variations on the large-scale ocean at decadal time scale.
Acknowledgments: We thank Eleanor Georgiadis for very significant help in the language
improvement of this paper, Julie Deshayes for enlightening discussion concerning the parametrization used in the NEMO model, Jonathan Beuvier for useful discussions on the present-day Mediterranean circulation and Olivier Marti for well-thought insights concerning the way to perform sensitivity experiments. The research leading to this study has received funding from the French National Research Agency HAMOC project (Grant ANR-13-BS06-0003). This work was granted access to the HPC resources of TGCC under the allocation No. 2016- 017403. We thank Patrick Brockmann for help with figure design. This research also benefited from Blue-Action project (European Union’s Horizon 2020 research and innovation program, grant number: 727852).
5. References:
Algan, O., Çağatay, N., Tchepalyga, A. et al. Geo-Mar Lett (2001) 20: 209. https://doi.org/10.1007/s003670000058
Andersson, A. et al., 2010. The Hamburg Ocean Atmosphere Parameters and Fluxes from Satellite Data – HOAPS-3. Earth System Science Data Discussions, 3(1), pp.143–194. Available at: http://www.earth-syst-sci-data-discuss.net/3/143/2010/.
Aumont, O. & Bopp, L., 2006. Globalizing results from ocean in situ iron fertilization studies.
Global Biogeochemical Cycles, 20(2).
Bahr, A. et al., 2014. Deciphering bottom current velocity and paleoclimate signals from contourite deposits in the Gulf of Cádiz during the last 140 kyr: An inorganic
geochemical approach. Geochemistry, Geophysics, Geosystems, 15(8), pp.3145–3160. Bahr, A. et al., 2015. Persistent monsoonal forcing of mediterranean outflow water dynamics
during the late Pleistocene. Geology, 43(11), pp.951–954.
Beckmann, A. & Döscher, R., 1997. A Method for Improved Representation of Dense Water Spreading over Topography in Geopotential-Coordinate Models. Journal of Physical
Oceanography, 27(4), pp.581–591. Available at:
http://dx.doi.org/10.1175/1520-0485(1997)027%3C0581:AMFIRO%3E2.0.CO%5Cn2.
Bigg, G.R. & Wadley, M.R., 2001. Millennial-scale variability in the oceans: An ocean modelling view. Journal of Quaternary Science, 16(4), pp.309–319.
Blaschek, M. et al., 2015. Holocene North Atlantic Overturning in an atmosphere-ocean-sea ice model compared to proxy-based reconstructions. Paleoceanography, 30(11), pp.1503–1524.
Böning, C.W. et al., 1995. Deep water formation and meridional overturning in a high-resolution model ofthe North Atlantic. Journal of Physical Oceanography, 26, pp.1142– 1164.
Born, A., Stocker, T.F. & Sandø, A.B., 2016. Transport of salt and freshwater in the Atlantic Subpolar Gyre. Ocean Dynamics.
Bosmans, J.H.C. et al., 2012. Monsoonal response to mid-holocene orbital forcing in a high resolution GCM. Climate of the Past, 8(2), pp.723–740.
Bosmans, J.H.C. et al., 2015. Precession and obliquity forcing of the freshwater budget over the Mediterranean. Quaternary Science Reviews, 123, pp.16–30. Available at:
http://dx.doi.org/10.1016/j.quascirev.2015.06.008.
Bozec, A. et al., 2011. On the variability of the mediterranean outflow water in the North Atlantic from 1948 to 2006. J. Geophys. Res., 116, C09033, doi:10.1029/2011JC007191. Bryden, H.L. & Kinder, T.H., 1991. Steady two-layer exchange through the Strait of Gibraltar.
Deep Sea Research Part A. Oceanographic Research Papers.
Chan, W.-L. & Motoi, T., 2003. Effects of stopping the Mediterranean Outflow on the southern polar region. Polar meteorology and glaciology, 17, pp.25–35. Available at: http://ci.nii.ac.jp/naid/110000034872/en/.
Colin, C. et al., 2010. Neodymium isotopic composition of deep-sea corals from the NE Atlantic: Implications for past hydrological changes during the Holocene. Quaternary
Science Reviews, 29(19–20), pp.2509–2517.
Criado-Aldeanueva, F., Soto-Navarro, F.J. & García-Lafuente, J., 2012. Seasonal and
interannual variability of surface heat and freshwater fluxes in the Mediterranean Sea: Budgets and exchange through the Strait of Gibraltar. International Journal of
Climatology, 32(2), pp.286–302.
Dufresne, J.L. et al., 2013. Climate change projections using the IPSL-CM5 Earth System Model: From CMIP3 to CMIP5. Climate Dynamics, 40(9–10), pp.2123–2165. Ehrmann, W. et al., 2007. Clay minerals in late glacial and Holocene sediments of the
northern and southern Aegean Sea. Palaeogeography, Palaeoclimatology,
Palaeoecology, 249(1–2), pp.36–57.
Escudier, R., Mignot, J. & Swingedouw, D., 2013. A 20-year coupled ocean-sea
ice-atmosphere variability mode in the North Atlantic in an AOGCM. Climate Dynamics, 40(3–4), pp.619–636.
Fichefet, T. & Morales Maqueda, A.M., 1997. Sensitivity of a global sea ice model to the treatment of ice thermodynamics and dynamics. J. Geophys. Res., 102, pp.2609–2612. Grant, K.M. et al., 2016. The timing of Mediterranean sapropel deposition relative to
insolation, sea-level and African monsoon changes. Quaternary Science Reviews, 140, pp.125–141. Available at: http://dx.doi.org/10.1016/j.quascirev.2016.03.026.
Grimm, R. et al., 2015. Late glacial initiation of Holocene eastern Mediterranean sapropel formation. Nature Communications, 6, p.7099. Available at:
http://www.nature.com/doifinder/10.1038/ncomms8099.
Hillaire-Marcel, C. et al., 2001. Absence of deep-water formation in the Labrador Sea during the last interglacial period. Nature, 410(6832), pp.1073–1077.
Holliday, N.P. et al., 2008. Reversal of the 1960s to 1990s freshening trend in the northeast North Atlantic and Nordic Seas. Geophysical Research Letters, 35(3), pp.1–5.
Hourdin, F. et al., 2006. The LMDZ4 general circulation model: Climate performance and sensitivity to parametrized physics with emphasis on tropical convection. Climate
Dynamics, 27(7–8), pp.787–813.
IPCC, 2013: Climate Change 2013: The Physical Science Basis. Contribution of Working Group I to the Fifth Assessment Report of the Intergovernmental Panel on Climate Change [Stocker, T.F., D. Qin, G.-K. Plattner, M. Tignor, S.K. Allen, J. Boschung, A. Nauels, Y. Xia,
V. Bex and P.M. Midgley (eds.)]. Cambridge University Press, Cambridge, United Kingdom and New York, NY, USA, 1535 pp.
Ivanovic, R.F. et al., 2014. Sensitivity of modern climate to the presence, strength and salinity of Mediterranean-Atlantic exchange in a global general circulation model. Climate
Dynamics, 42(3–4), pp.859–877.
Ivanovic, R.F. et al., 2013. The parameterisation of Mediterranean-Atlantic water exchange in the Hadley Centre model HadCM3, and its effect on modelled North Atlantic climate.
Ocean Modelling, 62, pp.11–16.
Jackson, L.C. et al., 2015. Global and European climate impacts of a slowdown of the AMOC in a high resolution GCM. Climate Dynamics, 45(11–12), pp.3299–3316.
Jia, Y., 2000. Formation of an Azores Current due to Mediterranean overflow in a modeling study of the North Atlantic. Journal of Physical Oceanography, 30, pp.2342–2358. Available at: http://ams.allenpress.com/amsonline/?request=get-abstract&issn=1520-0485&volume=030&issue=09&page=2342.
Jordà, G. et al., 2017. The Mediterranean Sea heat and mass budgets: Estimates, uncertainties and perspectives. Progress in Oceanography, 156(July), pp.174–208. Kallel, N. et al., 1997. Enhanced rainfall in the Mediterranean region during the last Sapropel
Event. Oceanologica Acta, 20(5), pp.697–712.
Kissel, C. et al., 2013. Variations in the strength of the North Atlantic bottom water during Holocene. Earth and Planetary Science Letters, 369–370, pp.248–259. Available at: http://dx.doi.org/10.1016/j.epsl.2013.03.042.
Lascaratos, A. et al., 1999. Recent changes in deep water formation and spreading in the eastern Mediterranean Sea: a review. Progress in Oceanography.
Lourens, L.J., 2004. Revised tuning of Ocean Drilling Program Site 964 and KC01B
(Mediterranean) and implications for the δ18O, tephra, calcareous nannofossil, and geomagnetic reversal chronologies of the past 1.1 Myr. Paleoceanography, 19(3), pp.1– 20.
Lozier, M.S. & Stewart, N.M., 2008. On the Temporally Varying Northward Penetration of Mediterranean Overflow Water and Eastward Penetration of Labrador Sea Water.
Journal of Physical Oceanography, 38(9), pp.2097–2103. Available at:
http://journals.ametsoc.org/doi/abs/10.1175/2008JPO3908.1.
Ludwig, W. et al., 2009. River discharge of water and nutrients to the Mediterranean and Black Sea: Major dirivers for ecosystem changes during past and future decades?
Progress in Oceanography.
Madec, G. et al., 1991. A three-dimensional numerical study of deep-water formation in the northwestern Mediterranean Sea. Journal of Physical Oceanography, 21(9), pp.1349– 1371. Available at: http://cat.inist.fr/?aModele=afficheN&cpsidt=5149571.
Madec, G., 2008. NEMO ocean engine, Paris: Institut Pierre-Simon Laplace (IPSL).
McCartney, M.S. & Mauritzen, C., 2001. On the origin of the warm inflow to the Nordic Seas.
Progress in Oceanography, 51(1), pp.125–214.
Mercone, D. et al., 2000. Duration of S1, the most recent sapropel in the eastern
Mediterranean Sea, as indicated by accelerator mass spectrometry radiocarbon and geochemical evidence. Paleoceanography, 15(3), pp.336–347.
Millot, C. & Taupier-Letage, I., 2005. Additional evidence of LIW entrainment across the Algerian subbasin by mesoscale eddies and not by a permanent westward flow.
Progress in Oceanography.


![[PDF] Introduction à la plateforme J2EE support de cours | Formation informatique](data:image/gif;base64,R0lGODlhAQABAIAAAP///wAAACH5BAEAAAAALAAAAAABAAEAAAICRAEAOw==)