HAL Id: hal-03217842
https://hal.archives-ouvertes.fr/hal-03217842
Submitted on 6 May 2021
HAL is a multi-disciplinary open access
archive for the deposit and dissemination of
sci-entific research documents, whether they are
pub-lished or not. The documents may come from
teaching and research institutions in France or
abroad, or from public or private research centers.
L’archive ouverte pluridisciplinaire HAL, est
destinée au dépôt et à la diffusion de documents
scientifiques de niveau recherche, publiés ou non,
émanant des établissements d’enseignement et de
recherche français ou étrangers, des laboratoires
publics ou privés.
of submicron particulate matter in central Amazonia
Suzane de Sá, Brett Palm, Pedro Campuzano-Jost, Douglas Day, Weiwei Hu,
Gabriel Isaacman-Vanwertz, Lindsay Yee, Joel Brito, Samara Carbone, Igor
Ribeiro, et al.
To cite this version:
Suzane de Sá, Brett Palm, Pedro Campuzano-Jost, Douglas Day, Weiwei Hu, et al.. Urban influence on
the concentration and composition of submicron particulate matter in central Amazonia. Atmospheric
Chemistry and Physics, European Geosciences Union, 2018, 18 (16), pp.12185-12206.
�10.5194/acp-18-12185-2018�. �hal-03217842�
© Author(s) 2018. This work is distributed under the Creative Commons Attribution 4.0 License.
Urban influence on the concentration and composition of submicron
particulate matter in central Amazonia
Suzane S. de Sá1, Brett B. Palm2, Pedro Campuzano-Jost2, Douglas A. Day2, Weiwei Hu2,
Gabriel Isaacman-VanWertz3,a, Lindsay D. Yee3, Joel Brito4,b, Samara Carbone4,c, Igor O. Ribeiro5,
Glauber G. Cirino6,d, Yingjun Liu1,e, Ryan Thalman7,f, Arthur Sedlacek7, Aaron Funk8, Courtney Schumacher8, John E. Shilling9, Johannes Schneider10, Paulo Artaxo4, Allen H. Goldstein3, Rodrigo A. F. Souza5, Jian Wang7, Karena A. McKinney1,g, Henrique Barbosa4, M. Lizabeth Alexander11, Jose L. Jimenez2, and Scot T. Martin1,12
1School of Engineering and Applied Sciences, Harvard University, Cambridge, Massachusetts, USA 2Department of Chemistry and Cooperative Institute for Research in Environmental Sciences,
University of Colorado, Boulder, Colorado, USA
3Department of Environmental Science, Policy, and Management, University of California, Berkeley, California, USA 4Institute of Physics, University of São Paulo, São Paulo, Brazil
5School of Technology, Amazonas State University, Manaus, Amazonas, Brazil 6National Institute for Amazonian Research, Manaus, Amazonas, Brazil 7Brookhaven National Laboratory, Upton, New York, USA
8Department of Atmospheric Sciences, Texas A&M University, College Station, Texas, USA
9Atmospheric Sciences and Global Change Division, Pacific Northwest National Laboratory, Richland, Washington, USA 10Particle Chemistry Department, Max Planck Institute for Chemistry, Mainz, Germany
11Environmental Molecular Sciences Laboratory, Pacific Northwest National Laboratory, Richland, Washington, USA 12Department of Earth and Planetary Sciences, Harvard University, Cambridge, Massachusetts, USA
anow at: Department of Civil and Environmental Engineering, Virginia Tech, Blacksburg, Virginia, USA bnow at: Laboratory for Meteorological Physics (LaMP), University Blaise Pascal, Aubière, France cnow at: Institute of Agricultural Sciences, Federal University of Uberlândia, Minas Gerais, Brazil dnow at: Department of Meteorology, Geosciences Institute, Federal University of Pará, Belém, Brazil
enow at: Department of Environmental Science, Policy, and Management, University of California, Berkeley, California, USA fnow at: Department of Chemistry, Snow College, Richfield, Utah, USA
gnow at: Department of Chemistry, Colby College, Waterville, Maine, USA
Correspondence: Scot T. Martin (scot_martin@harvard.edu) Received: 15 February 2018 – Discussion started: 20 February 2018
Revised: 5 July 2018 – Accepted: 28 July 2018 – Published: 23 August 2018
Abstract. An understanding of how anthropogenic emis-sions affect the concentrations and composition of airborne particulate matter (PM) is fundamental to quantifying the influence of human activities on climate and air quality. The central Amazon Basin, especially around the city of Manaus, Brazil, has experienced rapid changes in the past decades due to ongoing urbanization. Herein, changes in the concentration and composition of submicron PM due to pollution downwind of the Manaus metropolitan region are reported as part of the GoAmazon2014/5 experiment.
A high-resolution time-of-flight aerosol mass spectrometer (HR-ToF-AMS) and a suite of other gas- and particle-phase instruments were deployed at the “T3” research site, 70 km downwind of Manaus, during the wet season. At this site, or-ganic components represented 79±7 % of the non-refractory PM1mass concentration on average, which was in the same
range as several upwind sites. However, the organic PM1was
considerably more oxidized at T3 compared to upwind mea-surements. Positive-matrix factorization (PMF) was applied to the time series of organic mass spectra collected at the
T3 site, yielding three factors representing secondary pro-cesses (73 ± 15 % of total organic mass concentration) and three factors representing primary anthropogenic emissions (27 ± 15 %). Fuzzy c-means clustering (FCM) was applied to the afternoon time series of concentrations of NOy, ozone,
total particle number, black carbon, and sulfate. Four clusters were identified and characterized by distinct air mass origins and particle compositions. Two clusters, 1 and Bkgd-2, were associated with background conditions. Bkgd-1 ap-peared to represent near-field atmospheric PM production and oxidation of a day or less. Bkgd-2 appeared to represent material transported and oxidized for two or more days, of-ten with out-of-basin contributions. Two other clusters, Pol-1 and Pol-2, represented the Manaus influence, one apparently associated with the northern region of Manaus and the other with the southern region of the city. A composite of the PMF and FCM analyses provided insights into the anthropogenic effects on PM concentration and composition. The increase in mass concentration of submicron PM ranged from 25 % to 200 % under polluted compared with background condi-tions, including contributions from both primary and sec-ondary PM. Furthermore, a comparison of PMF factor load-ings for different clusters suggested a shift in the pathways of PM production under polluted conditions. Nitrogen ox-ides may have played a critical role in these shifts. Increased concentrations of nitrogen oxides can shift pathways of PM production from HO2-dominant to NO-dominant as well as
increase the concentrations of oxidants in the atmosphere. Consequently, the oxidation of biogenic and anthropogenic precursor gases as well as the oxidative processing of pre-existing atmospheric PM can be accelerated. This combined set of results demonstrates the susceptibility of atmospheric chemistry, air quality, and associated climate forcing to an-thropogenic perturbations over tropical forests.
1 Introduction
Secondary organic material (SOM) constitutes a large frac-tion of the atmospheric particle burden (Hallquist et al., 2009; Jimenez et al., 2009). Therefore, it has important ef-fects on the Earth’s radiation balance, atmospheric visibil-ity, and human health. SOM is a complex mixture of com-pounds resulting from many chemical pathways, and the pro-cesses underlying the production of SOM remain poorly un-derstood. Models are especially challenged to accurately rep-resent the production of SOM in regions where there is a mix of biogenic and anthropogenic emissions (de Gouw et al., 2008; Glasius and Goldstein, 2016; Shrivastava et al., 2017). Possible shifts in the contributing mechanisms of SOM pro-duction between background and polluted conditions must be understood and quantified for distinct environments on the globe to test and enable accurate modeling predictions.
Several field observations, mainly in midlatitudes of the Northern Hemisphere, and modeling efforts have suggested that the production of SOM from biogenic precursor com-pounds becomes more efficient in polluted air (Weber et al., 2007; Goldstein et al., 2009; Hoyle et al., 2011; Huang et al., 2014; Zhang et al., 2018). In the northeastern USA, de Gouw et al. (2005) showed that concentrations of organic partic-ulate matter (PM) correlated well with anthropogenic trac-ers, yet the concentrations of the anthropogenic precursors were insufficient to explain the observed PM concentrations. In the southeastern USA, radioisotope analysis of organic PM determined that 70 % to 80 % of the carbon mass had a modern origin even as correlations were observed between SOM mass concentrations and anthropogenic VOC and CO concentrations (Weber et al., 2007). This finding and those of further field studies in the region together suggested that the organic PM was mainly produced from biogenic VOCs (BVOCs), yet it was modulated by anthropogenic emissions of NOxand SO2(Hu et al., 2015; Xu et al., 2015a, b; Zhang
et al., 2018). In the western USA, ground and aircraft mea-surements observed the highest organic PM increases when air masses containing high BVOC concentrations intercepted anthropogenic emissions (Setyan et al., 2012; Shilling et al., 2013). A metastudy for several locations in the USA con-cluded that air downwind of urban areas had increased or-ganic PM concentrations due to the photochemical produc-tion of SOM (De Gouw and Jimenez, 2009). Models have estimated that 50 % to 70 % of the biogenic SOM mass con-centration in several locations is modulated by anthropogenic emissions (Carlton et al., 2010; Heald et al., 2011; Spracklen et al., 2011). In addition, global-scale modeling studies have estimated an increase of 20 % to 60 % in the global annual mean SOM concentration relative to the preindustrial period (Tsigaridis et al., 2006; Hoyle et al., 2009).
Many possible mechanisms may contribute to the effects of anthropogenic emissions on increased SOM production, including changes in gas–particle partitioning, new parti-cle production and growth, and partiparti-cle acidity. However, changes in the concentrations of nitrogen oxides should be regarded as a critical factor (Hoyle et al., 2011 and references therein). Different NOxregimes favor distinct gas-phase
ox-idation pathways, leading to different oxox-idation products and particle yields, as evidenced in isoprene photooxidation (Kroll et al., 2005, 2006; Hallquist et al., 2009; Worton et al., 2013; J. Liu et al., 2016; Y. Liu et al., 2016). Isoprene accounts for half of global BVOC mass emissions, and trop-ical forests are responsible for about 80 % of terpenoid emis-sions (Guenther et al., 2012). In the Amazon, isoprene is the dominant BVOC emitted by vegetation and is estimated to contribute to about half of the organic PM concentrations under background conditions (Kuhn et al., 2010; Chen et al., 2015; Yáñez-Serrano et al., 2015). Under HO2-dominant
conditions (i.e., low NOx), isoprene epoxydiols (IEPOX) are
produced in the gas phase and, through heterogenous reac-tions involving sulfate, PM is produced (Paulot et al., 2009;
Surratt et al., 2010). Depending on the relative importance of increased concentrations of sulfate and NOxassociated with
pollution in a given region, an enhancement or suppression of IEPOX-derived PM production relative to background con-ditions may occur (Xu et al., 2015a; de Sá et al., 2017). As part of GoAmazon2014/5, de Sá et al. (2017) demonstrated that PM derived from IEPOX decreased under polluted com-pared to background conditions downwind of Manaus. Ni-trogen oxides in the pollution plume suppressed the produc-tion of isoprene hydroxyhydroperoxides (Y. Liu et al., 2016), leading to a decrease in the production of gas-phase IEPOX and subsequently of IEPOX-derived PM (de Sá et al., 2017). Amazonia, the largest tropical forest in the world and a large global source of SOM, is comparatively understudied relative to northern midlatitude regions, and the influence of pollution on the SOM life cycle is, in particular, little stud-ied (Martin et al., 2010a). Manaus, a city of over two million people in the central Amazon, continuously releases an urban plume into an otherwise mostly unperturbed region (Kuhn et al., 2010; Martin et al., 2017). The region downwind of Man-aus, especially in the wet season in the absence of regional fires (Artaxo et al., 2013), offers a natural laboratory for the investigation of biogenic–anthropogenic interactions and the resulting consequences for the amount and composition of PM in the region.
The present study investigates the influences of urban pol-lution on the concentration and composition of fine particles in central Amazonia, focusing on organic PM and its sev-eral component classes. The analysis employs datasets col-lected in the wet season from 1 February to 31 March, 2014, corresponding to the first Intensive Operating Period (IOP1) of the GoAmazon2014/5 experiment (Martin et al., 2016). Herein, positive-matrix factorization (PMF) of organic mass spectra measured by an aerosol mass spectrometer (AMS) in conjunction with a clustering analysis of pollution indicators by fuzzy c-means are employed to investigate the changes in particle concentration and composition associated with the influence of urban pollution downwind of Manaus.
2 Methodology 2.1 Site description
The primary site in this study, named “T3” (3.2133◦S, 60.5987◦W), was located 70 km to the west of Manaus, Brazil, in central Amazonia (Martin et al., 2016). The site was situated in a pasture of 2.5 km × 2 km surrounded by forest. Based on modeled flow trajectories of the pollution plume, the T3 site intercepted the plume about 40 % of the time (Martin et al., 2017). Auxiliary sites “T0a” and “T0t”, served as references for background conditions in relation to T3 (Fig. S1 in the Supplement). Site T0a (2.1466◦S, 59.0050◦W) refers to the Amazonian Tall Tower Obser-vatory (ATTO; Andreae et al., 2015), located 150 km to
the northeast of Manaus. Site T0t (2.5946◦S, 60.2093◦W) was situated 60 km to the north-northwest of Manaus in the Cuieiras Biological Reserve (“ZF2”) and refers to tower “TT34”, established in 2008 for the AMAZE-08 experiment (Martin et al., 2010b). The T0 sites were typically upwind of Manaus, with only occasional transport of pollution to these sites (Andreae et al., 2015; Chen et al., 2015). Aux-iliary site “T2” served as a reference for polluted conditions. This site was located just across the Rio Negro (3.1392◦S, 60.1315◦W), 8 km from the southwestern edge of Manaus and typically downwind of urban emissions during the day-time.
2.2 Aerosol mass spectrometry
Characterization of the atmospheric PM was obtained using a high-resolution time-of-flight aerosol mass spectrometer (hereafter AMS; Aerodyne, Inc., Billerica, Massachusetts, USA; DeCarlo et al., 2006; Canagaratna et al., 2007). De-tailed aspects of the AMS operation in GoAmazon2014/5 were presented in de Sá et al. (2017). In brief, the instru-ment was housed in a temperature-controlled research con-tainer, and the inlet to the instrument sampled from 5 m above ground level. Ambient measurements for this study were obtained every other 4 min. The other 4 min was used for an analysis of the output from an oxidation flow reactor as presented in Palm et al. (2018).
Data analysis was performed using SQUIRREL (1.56D) and PIKA (1.14G) of the AMS software suite (Sueper et al., 2017; DeCarlo et al., 2006). Organic, sulfate, ammonium, nitrate, and chloride PM mass concentrations were quanti-fied. “Sulfate” and “nitrate” concentrations reported by the AMS may include contributions from both organic and inor-ganic species (Farmer et al., 2010; Liao et al., 2015). Orinor-ganic and inorganic nitrate concentrations were estimated based on the ratio of NO+2 to NO+ signal intensity, as described in Sect. S2 (Fry et al., 2009, 2013; Farmer et al., 2010). The or-ganic elemental ratios, O : C and H : C, were calculated fol-lowing the methods of Canagaratna et al. (2015).
2.3 Auxiliary measurements and datasets
In complement to the AMS dataset, the analysis herein in-corporated auxiliary gas and particle measurements collected during IOP1 at T3 (Martin et al., 2016). Mass concentrations of molecular and tracer organic species in the gas and parti-cle phases were measured by a semi-volatile thermal desorp-tion aerosol gas chromatograph (SV-TAG) at a time resolu-tion of one hour (Isaacman-VanWertz et al., 2016). Concen-trations of volatile organic compounds (VOCs) were mea-sured by a proton-transfer-reaction time-of-flight mass spec-trometer (PTR-ToF-MS; Y. Liu et al., 2016). In the Mo-bile Aerosol Observing System (MAOS) of the ARM Cli-mate Research Facility (ACRF; Martin et al., 2016), mea-surements of NOy were made using a
chemiluminescence-based instrument (Air Quality Design). The raw NOy
mea-surements (10 s resolution) were averaged across 30 min in-tervals to dampen the influence of brief local events. In ad-dition, ozone concentrations were measured by an ultravio-let photometric analyzer (Thermo Fisher, model 49i, Ozone Analyzer). Particle number concentrations were measured by a condensation particle counter (TSI, model 3772). Black carbon (BC) concentrations were measured both by a 7-wavelength aethalometer (Magee Scientific, model AE-31) and a single particle soot photometer (SP2; Droplet Measure-ment Techniques). The two datasets differed by a factor of up to 3 in absolute mass concentrations, as observed in other studies (Subramanian et al., 2007; Cappa et al., 2008; Lack et al., 2008), but they agreed well in the temporal trend. Thus, the analysis herein for BC is restricted to the temporal trends. Wind direction, solar irradiance, and precipitation rate were measured by the ARM Mobile Facility (AMF-1), which was also part of the ACRF.
Additional measurements from T0a, T0t, and T2 were also used in the analysis. At T2, non-refractory particle composi-tion and concentracomposi-tion were measured by an Aerosol Chem-ical Speciation Monitor (ACSM) during the wet season from 9 March to 30 April 2014 (Cirino et al., 2018). ACSM mea-surements were made at T0a during the wet season of 2015, from 1 February to 31 March (Andreae et al., 2015). Further AMS datasets collected at T0t during the wet season of 2008 (6 February to 22 March; AMAZE-08 campaign) were used in the analysis (Chen et al., 2009; Schneider et al., 2011). 2.4 Air mass back trajectories and precipitation rates Simulations of 2-day backward air mass trajectories, starting at 100 m above T3, were made using HYSPLIT4 (Draxler and Hess, 1998). Input meteorological data were obtained from the Global Data Assimilation System (GDAS), pro-vided by the NOAA Air Resources Laboratory (ARL), on a regular grid of 0.5◦×0.5◦, 18 pressure levels, and 3 h in-tervals. Trajectory steps were calculated for every 12 min.
Information on precipitation along the trajectories was ob-tained from the S-band radar of the System for Amazon Protection (SIPAM) in Manaus (Machado et al., 2014). The radar had a beam width of 1.8◦, and it scanned 17 elevation angles every 12 min. Data were recorded to a range of 240 km at 500 m gate spacing. The reflectivity fields were quality controlled to remove non-meteorological echo and calibrated against the satellite precipitation radar of the Tropical Rain-fall Measuring Mission and Global Precipitation Measure-ment (TRMM-GPM; Kummerow et al., 1998; Hou et al., 2014). Ground clutter was used to analyze the stability of the calibration. The data were gridded at 2 km × 2 km in the horizontal and 0.5 km in the vertical using the NCAR Radx software. The reflectivity at 2.5 km of altitude was converted to rain rates based on the datasets of a Joss–Waldvogel dis-drometer (Joss and Waldvogel, 1967), located at T3, 70 km downwind of the radar.
3 Results and discussion 3.1 Fine-mode PM composition
The time series of mass concentrations of PM1 species at
T3 during the wet season of 2014 are plotted in Fig. 1a. Organic material dominated the composition, contributing 79±7 % (average ± one standard deviation), followed by sul-fate (13 ± 5 %). The standard deviation quantifies the vari-ability across the time series. Average non-refractory (NR) PM1mass concentrations and compositions at T3 as well as
at three other sites in the region are represented in Fig. 1b. The two T0 sites corresponded to predominantly background conditions. By contrast, the T2 site represented conditions just downwind of Manaus, and depending on wind direction experienced fresh Manaus pollution or background air. The comparison in Fig. 1b demonstrates that the organic compo-nent consistently constituted 70 % to 80 % of NR-PM1across
sites in this region in the wet season, for both background and polluted conditions, in line with previous observations (Chen et al., 2009; Martin et al., 2010a).
Even though the relative composition was similar across all sites, there were differences in the absolute mass concen-trations (Fig. 1b, top panel). The NR-PM1mass
concentra-tions at the T0 sites upwind of Manaus, although measured in different years, were consistently around 1 µg m−3. The concentrations at the T2 site just downwind of Manaus were more than three times higher on average (3.3 µg m−3). Aver-age concentrations at the T3 site (1.7 µg m−3), several hours downwind of Manaus, were lower compared to those at T2. This relative progression from T0, to T2, and then to T3 can be understood as a first-order quantification of the overall ef-fect of Manaus emissions in increasing the airborne PM bur-den in the downwind region.
The diel trends of organic and sulfate mass concentrations as well as their variabilities across the four sites are shown in Fig. 2. Lines represent means, solid markers show medi-ans, and boxes span the interquartile ranges. Organic mass concentrations and associated variability were higher at the T3 site compared with the T0 sites, markedly so in the af-ternoon hours. The greater variability at T3 is in line with a time-varying influence of Manaus emissions. This influence waxes and wanes with small northerly or southerly shifts of the trade winds as well as other changes in regional circula-tion tied to daily meteorology (dos Santos et al., 2014; Mar-tin et al., 2017). The higher afternoon mass concentrations at T3 can be attributed to the combination of (i) an oxidant-rich, sunlight-fed plume that increases the production rate of secondary PM and (ii) faster near-surface winds during the day that transport PM from Manaus to T3 with less loss by deposition and dispersion compared with more stagnant air at night. Among all sites, the T2 observations had both the highest average organic mass concentrations and the largest variability. These characteristics of the T2 dataset can be ex-plained by a combination of (i) the proximity of the site to
Figure 1. (a) Mass concentrations of PM1species at T3 during the wet season of 2014 (IOP1). Non-refractory (NR) PM1 species of
organic, sulfate, ammonium, nitrate, and chloride were measured by the AMS. Mass concentrations of black carbon were obtained by scaling aethalometer measurements by a factor of 2 based on the range of 1 to 3 for the comparison of SP2 to aethalometer measurements. The temporal trend of the two instruments agreed well. (b) Comparison of the summed mass concentrations of (top) non-refractory PM1species
and (bottom) the mass fractions of these species at T3 and three other regional sites. T0a-2015 refers to measurements in the wet season of 2015 at the ATTO location (Andreae et al., 2015). T0t-2008 refers to the AMAZE-08 experiment, which took place in the wet season of 2008 at the TT34 location (Chen et al., 2015). T2-2014 refers to measurements made during IOP1 at a site 8 km downwind of Manaus, just across the Black River (“Rio Negro”) (Cirino et al., 2018). Measurements at T0a in 2015 and at T2 in 2014 were made by an ACSM, and measurements at T0t in 2008 and at T3 in 2014 were made by an AMS. Concentrations were adjusted to standard temperature (273.15 K) and pressure (105Pa) (STP). The variability of measurements across sites is evaluated in Fig. 2.
T0a - 2015 T0t - 2008 T2 - 2014 T3 - 2014
(a)
(b)
Figure 2. Diel patterns of the mass concentrations of (a, green) organic and (b, red) sulfate species during the wet season at four different sites (cf. Figs. 1 and S1). The ordinate scale for the T2-2014 panel is twice that of the other panels. Mass concentrations were corrected to standard temperature and pressure (273.15 K and 105Pa) (STP). Local time is UTC minus 4 h. Lines represent means, solid markers show medians, and boxes span interquartile ranges.
Manaus, (ii) the rapid and 180◦changes in wind direction caused by the intersection of the trade winds with a local river breeze (dos Santos et al., 2014), and (iii) the possible contributions of emissions from brick kilns, located mostly southwest of the site, especially during nighttime (Martin et al., 2016; Cirino et al., 2018).
The diel trends of the sulfate mass concentrations were, in large part, similar to those of the organic mass concentra-tions. However, one distinction in the case of sulfate is that the variability at the T0 sites is similar to that at the T3 site. The explanation is that the background sources of sulfate,
including not only in-basin emissions but also out-of-basin long-range transport, are variable and significant enough to make the variability at the background sites similar to that at the T3 site (de Sá et al., 2017).
Overall, the organic PM1 at T3 was highly oxidized, as
indicated by the position of the gray markers in Fig. 3b. By contrast, the blue markers in Fig. 3a represent the dataset col-lected at T2 during the same period. The datasets encompass all times of the day and all conditions at both sites. Datasets from background sites collected in different years are shown in Fig. S2. Points in the upper left represent more-oxidized
Figure 3. Scatterplot of the AMS signal fraction at m/z 44 (f44) against that at m/z 43 (f43). Gray and blue circles correspond to
measure-ments at T3 and T2 during IOP1, respectively, in the wet season of 2014. For visualization purposes, the two datasets are plotted separately in panels (a) and (b). Solid squares represent median values, and whiskers represent 10 and 90 percentiles. Dashed lines delineate the region where worldwide measurements of ambient organic PM1commonly lie (Ng et al., 2011a).
material, and points in the lower right represent less-oxidized material (Ng et al., 2011a). The comparison depicted in Fig. 3 indicates the effects of the plume over the 4 h of transport from T2 to T3, which were investigated in detail by Cirino et al. (2018). The plot suggests that the enhanced oxidative cy-cle associated with higher OH and O3concentrations in the
pollution plume might cause (i) the production of highly ox-idized SOM, from both biogenic and anthropogenic precur-sors including aromatic compounds (Chhabra et al., 2011; Lambe et al., 2011), and (ii) the accelerated oxidative pro-cessing of preexisting organic PM by OH and O3(Martin et
al., 2017). The implication of this is that the emissions from Manaus can significantly affect the mechanisms that produce or modify fine-mode PM over the tropical forest.
3.2 Characterization of organic PM by positive-matrix factorization
Positive-matrix factorization was applied to the time series of the organic component of the high-resolution mass spec-tra (Ulbrich et al., 2009b). Diagnostics of the PMF analy-sis are presented in the Supplement (Sect. S1; Figs. S3 and S4). Herein, “factor profile” and “factor loading” refer to the mathematical products of the multivariate statistical analysis, whereas “mass spectrum” and “mass concentration” refer to direct measurements.
A six-factor solution was obtained based both on the nu-merical diagnostics of the PMF algorithm and the judged sci-entific meaningfulness of the resolved factors (Sect. S1). The factor profiles, diel trends of the factor loadings, and the time series of the factor loadings and other related measurements are plotted in panels (a), (b), and (c) of Fig. 4, respectively.
The inset of Fig. 4a shows the mean fractional loading con-tribution of each factor during the analysis period. The cor-relations of factor loadings with co-located measurements of gas- and particle-phase species are shown in Fig. 5.
The scientific interpretation of each factor was based on a combination of (i) the characteristics of the factor pro-file (i.e., “mass spectrum”), as referenced to a worldwide database of AMS spectra and PMF analyses (Ulbrich et al., 2009a, b, c), and (ii) the temporal correlations between the factor loading and other co-located measurements (Fig. 5). Three factors interpreted as primary emissions of organic PM were resolved: an anthropogenic-dominated factor (here-after, “ADOA”), a biomass burning factor (“BBOA”), and a fossil-fuel hydrocarbon-like factor (“HOA”). Three fac-tors interpreted as secondary production and processing were resolved: a more oxidized oxygenated factor (“MO-OOA”), a less oxidized oxygenated factor (“LO-(“MO-OOA”), and an isoprene-epoxydiols-derived factor (“IEPOX-SOA”). Fig-ure 5 shows that the correlations of factor loadings with ex-ternal measurements of gas- and particle-phase species sup-port this interpretation, as detailed in the following discus-sion for each factor.
The HOA factor profile had characteristic ions of C4H+7
and C4H+9 at nominal values of m/z 55 and 57,
respec-tively (Fig. 4a). It had an oxygen-to-carbon (O : C) ratio of 0.18 ± 0.02, the lowest among the six factors (Table 1). In line with the AMS PMF literature, the HOA factor repre-sents a class of primary hydrocarbon-like organic compounds that are typically associated with traffic emissions (Zhang et al., 2005). In the present study, the HOA factor loadings ac-counted for 6 % of the organic mass concentrations on av-erage (Fig. 4a, inset). As a point of comparison, the
aver-Figure 4. Results of the PMF analysis on the time series of AMS organic mass spectra collected at T3. (a) Mass spectral profile of each factor represented at unit mass resolution. The inset shows the mean fractional loading of each factor. (b) Diel trends for the loadings of each PMF factor. Local time is UTC minus 4 h. Lines represent means, solid markers show medians, and boxes span the interquartile ranges. (c) Time series of the factor loadings (left axis) and other related measurements at T3 (right axis). Methyl-butyl-tricarboxylic acid is abbreviated as MBTCA.
age in the southeastern USA typically varies from 9 % to 15 % (Xu et al., 2015b). The lower relative contribution of 6 % in this study might be due in part to the larger rela-tive role of secondary production in a tropical forest
envi-ronment. In addition, the distance from Manaus to the T3 site might allow time for substantial vertical mixing, dilu-tion, and the subsequent evaporation of primary emissions into entrained background air (Robinson et al., 2007; Y. Liu
Figure 5. Column plot of Pearson R correlations between the loading of each PMF factor and values of selected measurements at T3. Abbre-viations include tricarballylic acid (TCA), methyl-butyl-tricarboxylic acid (MBTCA), methyl vinyl ketone (MVK), methacrolein (MACR), and isoprene hydroxyhydroperoxides (ISOPOOH). SV-TAG measurements refer to particle-phase concentrations. Isomers could not be dis-tinguished by PTR-ToF-MS measurements; C8and C9aromatics include the xylene and trimethylbenzene isomers, respectively.
Table 1. Characteristics of the PMF factors derived from the AMS datasets. Listed are signal fractions fCO+
2 at nominal m/z 44 and
oxygen-to-carbon (O : C) and hydrogen-to-carbon (H : C) ratios. Values and associated uncertainties were calculated by running PMF in “bootstrap mode” (Ulbrich et al., 2009b). Elemental ratios were calibrated by the “improved-ambient” method, which has an estimated uncertainty of 12 % for O : C and 4 % for H : C (Cana-garatna et al., 2015). PMF factor fCO+ 2 O : C H : C MO-OOA 0.25 ± 0.01 1.09 ± 0.17 1.27 ± 0.12 LO-OOA 0.14 ± 0.02 0.72 ± 0.10 1.49 ± 0.07 IEPOX-SOA 0.17 ± 0.01 0.93 ± 0.10 1.39 ± 0.07 ADOA 0.11 ± 0.01 0.40 ± 0.05 1.63 ± 0.02 BBOA 0.123 ± 0.004 0.61 ± 0.08 1.57 ± 0.04 HOA 0.048 ± 0.006 0.18 ± 0.02 1.94 ± 0.02
et al., 2018; Shilling et al., 2018). Finally, the possible differ-ences in emission profiles associated with different types of regional economic development between the Brazilian Ama-zon and the southeastern USA (e.g., fleet density, fuel matrix, industry, and so forth) should also be considered. The HOA factor loading decreased during the day, which can be ex-plained by the growth of the planetary boundary layer (PBL) and the subsequent dilution of the concentrations of primary emissions (Fig. 4b). The time series of HOA factor loading did not correlate well (R < 0.5) with any of the co-located measurements at T3 (Fig. 5). It is plotted alongside the time series of NOyconcentration in Fig. 4c.
The BBOA factor profile was characterized by distinct peaks of C2H4O+2 (m/z 60) and C3H5O+2 (m/z 73), as shown
in Fig. 4a. These peaks can be attributed to levoglucosan and other anhydrous sugars that result from biomass pyrolysis (Schneider et al., 2006; Cubison et al., 2011). Correlations of the factor loadings with the mass concentrations of levoglu-cosan and vanillin (R > 0.8) measured by SV-TAG
corrobo-rate the association with biomass burning (Figs. 4c, 5). The BBOA factor of this study had an O : C ratio of 0.61 ± 0.08 (Table 1), which is consistent with large contributions from levoglucosan (O : C of 0.83) and similar sugars. The factor loading accounted for 9 % of the organic PM1mass
concen-tration on average (Fig. 4a, inset). This result is consistent with the low incidence of fires in the Amazon during the wet season (Martin et al., 2016). The BBOA factor loading typi-cally decreased during the day (Fig. 4b), which is suggestive of the dilution of local sources during the development of the PBL rather than long-range transport. Emissions from local fires around T3, including trash and tree burning, as well as from wood-fueled brick kilns along the road from Manaus to T3 might have contributed to this factor.
The ADOA factor profile, distinguished prominently by the C7H+7 ion at m/z 91, also had characteristic ions of C4H+7
at m/z 55 and C3H+5 at m/z 41 (Fig. 4a). A peak at m/z 91
can arise from many sources, including biogenic and anthro-pogenic emissions (Ng et al., 2011b). Therefore, elevated signal intensity m/z 91 in itself does not serve as a tracer for a specific source or process without consideration of the at-mospheric context. Factors with a characteristic m/z 91 peak (usually labeled “91fac”) have typically been associated with biogenic emissions (Robinson et al., 2011; Budisulistiorini et al., 2015; Chen et al., 2015; Riva et al., 2016). However, the ADOA factor profile of this study more strongly resembles the mass spectra previously reported for PM emissions from cooking activities (Lanz et al., 2007; Mohr et al., 2012) than those from “91fac” (Sect. S1; Fig. S5). The ratio of m/z 55 to m/z 57 of the ADOA factor was 4.1. This ratio lies in the range of 2 to 10 reported for several factors represent-ing primary cookrepresent-ing emissions and is well above the range of 0.8 to 1.4 reported for factors associated with traffic emis-sions, such as the HOA factor (Mohr et al., 2012 and refer-ences therein; Hu et al., 2016). Even though the ADOA factor profile has a large contribution from non-oxygenated ions, similar to the HOA factor and consistent with a dominance by primary emissions, it also contains considerable signal from oxygenated ions, resulting in a relatively higher O : C of 0.40 ± 0.05 (Table 1). The factor loading accounted for 13 % of the organic PM1mass concentration on average (Fig. 4a,
inset). The factor loading decreased as the PBL developed during the day, consistent with dominant non-photochemical, primary sources (Fig. 4b). Furthermore, there were small in-creases in factor loading at 12:00 and 18:00 LT (local time), suggestive of breakfast-time and lunch-time cooking activi-ties in Manaus based on a transport time of 4 to 6 h between the city and the T3 site (Martin et al., 2016; Cirino et al., 2018). Manaus typically has four rush hour periods each day from 06:30 to 08:00, 12:00 to 13:30, 16:30 to 18:30, and 21:00 to 22:00 LT. Therefore, heavy traffic at these hours may also have contributed to the ADOA factor. Correla-tions between factor loading and external measurements ex-ceeded R = 0.5 for many anthropogenic markers, including concentrations of aromatics (e.g., benzene, toluene, and C8
and C9species), carbon monoxide, particle count, and NOy
(Figs. 4c, 5). Contributions from secondary processes can-not be ruled out, and PM production from anthropogenic VOCs might also have been captured in this factor. Overall, the ADOA factor was interpreted in the present study as an indicator of anthropogenic influence associated with several sources in Manaus, most importantly cooking and possibly traffic emissions.
The IEPOX-SOA factor profile had marker ions of C4H+5
(m/z 53) and C5H6O+(m/z 82) (Fig. 4a; Lin et al., 2012; Hu
et al., 2015; de Sá et al., 2017). Furthermore, it had an O : C ratio of 0.9 ± 0.10 (Table 1). The factor loading accounted for 17 % of the organic PM1mass concentration on average
(Fig. 4a, inset). There were high correlations (R > 0.8) be-tween factor loadings and concentrations of C5-alkenetriols
and 2-methyltetrols, which are markers of IEPOX-derived PM, produced by the photooxidation of isoprene under HO2
-dominant conditions (Surratt et al., 2010; Lin et al., 2012; Fig. 4c). The increase in factor loading during daytime was consistent with a photochemical source (Fig. 4b). There were also correlations between factor loadings and concentrations of sulfate and some acids, such as tricarballylic acid (TCA; Fig. 5), which is in agreement with the association of IEPOX-derived PM and sulfate/acidity observed in other studies (Budisulistiorini et al., 2013; Nguyen et al., 2014; Kuwata et al., 2015). Therefore, this factor was interpreted as repre-sentative of PM produced from isoprene photooxidation un-der HO2-dominant conditions. The effects of urban pollution
on the loadings of this factor were the focus of a previous publication (de Sá et al., 2017).
The two remaining factors, LO-OOA and MO-OOA, were also associated with secondary atmospheric processes. The LO-OOA and MO-OOA factors had O : C ratios of 0.72 ± 0.10 and 1.09 ± 0.17, respectively. The LO-OOA factor was characterized by the greatest ratio of signal intensity of the C2H3O+ ion (m/z 43) to that of the CO+2 ion (m/z 44)
(Fig. 4a) compared with all other factors. This factor is usually attributed to lower generation, less oxidized, higher volatility secondary organic PM (Jimenez et al., 2009). By comparison, the MO-OOA factor profile had the strongest CO+2 (m/z 44) peak among all factors (Fig. 4a). This factor is usually attributed to higher generation, more oxidized, less volatile secondary organic PM or extensively oxidized pri-mary PM of any type that has resided in the atmosphere for several days or more (Jimenez et al., 2009).
The LO-OOA factor loading accounted for 25 % of the organic PM1 mass concentration on average (Fig. 4a,
in-set). The factor loading correlated better with the estimated concentrations of inorganic nitrate than with organic or to-tal nitrate (Fig. 5; Sect. S2 and Fig. S6), which is consis-tent with the interpretation of the higher volatility associ-ated with this factor (Jimenez et al., 2009; Zhang et al., 2011). The factor loading also correlated (R > 0.7) with the concentrations of 2-methylglyceric acid and methyl-butyl-tricarboxylic acid (MBTCA), which are products of
iso-prene and monoterpene oxidation, respectively, under NO-dominant conditions (Figs. 4c, 5). The factor loading in-creased starting at 09:00 LT and peaked in the afternoon hours (Fig. 4b). This diel trend, tied to the sunlight cycle, tracked the typical daily emission patterns of isoprene and monoterpenes from the surrounding forest (Yáñez-Serrano et al., 2015). The absence of a sharp decline at sunset and higher variability at nighttime may also indicate a contribution from terpene ozonolysis. For these several reasons, the LO-OOA factor was interpreted herein as secondary organic PM pro-duced mostly within several hours of observations by many possible pathways. Some of the inferred pathways include the following: (i) the photooxidation of isoprene along non-IEPOX pathways, (ii) the photooxidation of terpenes and other biogenic VOCs along both HO2- and NO-dominant
re-action pathways, (iii) the ozonolysis of terpenes, and (iv) the possible production of SOM from anthropogenic emissions from Manaus.
The MO-OOA factor loading accounted for 30 % of the organic PM1 mass concentration on average (Fig. 4a,
in-set). The factor loading correlated (R > 0.7) with the mass concentrations of several particle-phase carboxylic acids as well as the concentrations of sulfate, ammonium, and ozone (Fig. 5). The time series of malic acid and ozone concen-trations are shown alongside the MO-OOA factor loadings in Fig. 4c. Malic acid is a highly oxidized compound (O : C of 1.25), which may have many different sources (Röhrl and Lammel, 2002; van Pinxteren et al., 2014). The MO-OOA factor loading increased starting at 08:00 LT (sunrise was at 06:00 LT) and peaked between 10:00 and 16:00 LT. There was a large variability in the factor loading in the after-noon hours among different days (Fig. 4b). The afterafter-noon in-crease and day-to-day variability were consistent with strong but variable photochemical processing leading to further ox-idation of organic PM during the day, depending on daily weather. The high O : C of 1.09 ± 0.17 could also be indica-tive of production of PM from aromatic compounds emit-ted from Manaus (Chhabra et al., 2011; Lambe et al., 2011). Overall, this factor was interpreted as representing highly ox-idized PM from multiple processes. Species initially associ-ated with HOA, BBOA, ADOA, IEPOX-SOA, and LO-OOA factors may converge after sufficient atmospheric oxidation to become represented by the MO-OOA factor (Jimenez et al., 2009; Palm et al., 2018).
3.3 Shifts in PM with anthropogenic influences 3.3.1 Cluster analysis
To further investigate changes in the concentration and com-position of PM associated with anthropogenic influences, a fuzzy c-means (FCM) algorithm was applied to the time se-ries of concentrations of particle number, NOy, ozone, black
carbon, and sulfate measurements at the T3 site (Bezdek et al., 1984). The analysis was fully independent of the PMF
results. For each point in time, these concentrations repre-sented the spatial coordinates of the data point. As discussed below, four clusters were identified. Based on measures of spatial similarity, the clustering algorithm attributed a degree of membership relative to each of the four clusters to each data point (Sect. S3; Figs. S7 and S8).
The scope of the clustering analysis was restricted to after-noon time points for which 10-hour air mass back trajectories did not intersect significant precipitation and for which solar irradiance at T3 averaged over the previous 4 h was higher than 200 W m−2 (Sect. S3). This scope aimed at capturing fair-weather conditions and thereby minimizing the role of otherwise confounding processes, such as boundary layer dy-namics and wet deposition. However, the elimination of tra-jectories containing precipitation should not be regarded as fully accurate given the uncertainties in the HYSPLIT trajec-tories. The scoped dataset spanned 24 afternoons.
Four clusters were identified based on minimization of the FCM objective function as well as a subjective assessment of the meaningful interpretation of the set of clusters (Sect. S3). The FCM algorithm returned a matrix containing the degrees of membership (ranging from 0 to 1) to each of the four clus-ters (columns) for each point in time (rows). For any given time point (i.e., row), the sum of its degrees of membership to clusters (i.e., sum across columns) was always unity, by definition. A collection of examples, representing 37 % of the analyzed data points by FCM, is shown in Fig. 6a. For times predominantly associated with only one cluster (e.g., 9 and 10 February), the corresponding air mass back trajectories are plotted in Fig. 7. The FCM algorithm also returned the coordinates of cluster centroids, which are listed in Table 2.
Two clusters of data were interpreted as “background” and labeled “Bkgd-1” and “Bkgd-2”. They were character-ized by NOy<1 ppb, ozone < 20 ppb, and particle
num-ber < 1200 cm−3(Table 2; Fig. 6). The two clusters primar-ily differed in that Bkgd-2 had significantly larger concen-trations of sulfate and black carbon. A comparison of the datasets of 13 February 2014 (predominantly Bkgd-1) and 16 February 2014 (predominantly Bkgd-2) in Fig. 6 high-lights these differences. Concentrations of sulfate and black carbon were 0.15 and 0.10 µg m−3, respectively, on 13 Febru-ary, compared with 0.40 and 0.15 µg m−3 on 16 February. The back trajectories associated with Bkgd-1 had both north-easterly and southnorth-easterly components. The wind fields, out of line with the trade winds, may suggest passage through re-cent weather systems and may imply wet deposition, which in turn might explain lower gas and particle concentrations (Table 2). These recent weather systems might not have been excluded from the scoped dataset because of inaccuracies in the intersections of the back trajectories with precipitation data, as discussed above, or because they were more dis-tant than captured by the 10 h back trajectories. Consistent with this hypothesis, the centroid value of the solar irradi-ance at T3 averaged across 4 h (Sect. 3.3.2) was lower for Bkgd-1 (400 W m−2) compared to that of the other clusters
Figure 6. Results of the cluster analysis by fuzzy c-means (FCM) for afternoon periods (12:00 to 16:00 LT) are presented by several case studies. (a) The degree of membership in each of the four clusters. The sum of the degrees of membership across all clusters is unity. Background conditions are abbreviated as “Bkgd”, and polluted conditions are abbreviated as “Pol”. (b) Pollution indicators: concentrations of NOy, O3, black carbon (BC), and particle number count are plotted. (c) PM1mass concentrations for organic, sulfate, nitrate, and
ammonium species. (d) Fractional contribution of each factor to total organic PM1.
(600 W m−2), suggesting an association of Bkgd-1 with over-cast conditions. By comparison, the back trajectories asso-ciated with Bkgd-2 were predominantly from the northeast, coming from the direction of the T0t and T0a sites (Fig. 7), in line with the dominant trade winds of the wet season. The air masses of Bkgd-2 may have experienced less wet deposi-tion and may represent more extensive atmospheric oxidadeposi-tion than those of Bkgd-1. They may also have carried PM con-tributions from out-of-basin sources, which would be consis-tent with the higher sulfate and black carbon concentrations of Bkgd-2 compared to those of Bkgd-1 (Chen et al., 2009; Pöhlker et al., 2018).
Two other clusters were interpreted as “polluted” and la-beled “Pol-1” and “Pol-2”. They were characterized by con-centrations of NOy >1 ppb, ozone > 20 ppb, and particle
number > 1200 cm−3(Table 2; Fig. 6). The dataset of the af-ternoon of 9 March illustrates a shift in dominance from Pol-2 to Pol-1 (Fig. 6). Although Pol-1 and Pol-Pol-2 both have high concentrations of sulfate and other pollutants, they differ in the extent of those high concentrations. The explanation may be that these clusters represent different source regions. Pol-1 may be associated with emissions from the northern re-gion of Manaus, and Pol-2 may be associated with emis-sions from the southern region of Manaus. Industry, power production, and oil refineries are concentrated in the south-eastern region of Manaus (Fig. S9; Medeiros et al., 2017).
Population density and commercial activity are concentrated in the southwestern portion of the city where downtown is located (Fig. S10). Aircraft observations show that concen-trations of sulfate as well as other pollutants are higher in the urban outflow from the southern compared to the north-ern region of Manaus (Fig. S10). Directional plots of SO2
and particle number concentrations observed at the T2 site further demonstrate the heterogeneity in Manaus emissions (Fig. S10). This hypothesis of a geographical difference in source regions qualitatively aligns with the differences in back trajectories characteristic of times dominated by Pol-1 and Pol-2 (Fig. 7). However, this interpretation does imply that the back trajectories may have a 20◦inaccuracy. Such in-accuracy is reasonable for the application of HYSPLIT mod-eling in this region given (i) the absence of surface weather stations and (ii) the relatively large scale of input wind fields (i.e., 50 km) compared to the scale of modeling (i.e., 70 km from T3 to Manaus and a city cross section of 20 km). 3.3.2 Comparison of PM among clusters
The characteristic PM composition associated with each cluster was determined by calculating the centroid coordi-nates of the clusters for the AMS species and PMF factors (Sect. S3). The centroid coordinate of a cluster for a given variable is defined as a weighted mean of that variable across all points in time, where the weight is the degree of
mem-Figure 7. Air mass back trajectories associated with the four clusters of the FCM analysis for the case studies in Fig. 6. Trajectories were calculated using HYSPLIT 4 in steps of 12 min for 10 h (Draxler and Hess, 1998). Image data: Google Earth.
bership of each data point to that cluster. A comparison of PM1concentrations and compositions for the four clusters is
shown in Fig. 8. Values are listed in Table 2.
The NR-PM1 mass concentrations increased by 25 % to
200 % for clusters Pol-1 and Pol-2 compared with those of clusters Bkgd-1 and Bkgd-2 (Fig. 8a). Increases in sulfate and associated ammonium concentrations had a smaller, yet non-negligible, role in the increased PM1 mass
concentra-tions. Sources of sulfate other than Manaus sustain relatively high concentrations in the Amazon Basin, as represented by the Bkgd-2 cluster (Chen et al., 2009; de Sá et al., 2017). Compared to these regional background concentrations (i.e., Bkgd-2 cluster), the increases in sulfate concentrations were significant only for air masses associated with the heavily in-dustrialized and densely populated southern region of Man-aus (i.e., Pol-2 cluster).
With respect to the composition of the organic PM, Fig. 8b shows that the Bkgd-1 cluster had a large contribution from
the LO-OOA factor. By comparison, the Bkgd-2 cluster had larger contributions from the MO-OOA and IEPOX-SOA factors. A comparison of the results for 13 and 16 Febru-ary of 2014 (Fig. 6d) illustrates these findings. The low mass concentrations and the dominant contribution by the LO-OOA factor suggest that the Bkgd-1 cluster may repre-sent conditions under which secondary organic PM was pro-duced within recent hours through photooxidation of VOCs emitted by the forest and subsequent condensation of sec-ondary organic material. The low sulfate concentrations for Bkgd-1 may rationalize the absence of a significant contribu-tion by the IEPOX-SOA factor. Isoprene photooxidacontribu-tion may have contributed to PM production via pathways other than IEPOX uptake (Krechmer et al., 2015; Riva et al., 2016). By comparison, for Bkgd-2, the higher mass concentrations and the greater contributions by IEPOX-SOA and MO-OOA fac-tors suggest that this cluster may represent conditions under which secondary organic PM was a combination of
mate-Table 2. Coordinates of cluster centroids for input variables, AMS species concentrations, and PMF factor loadings. Table entries for AMS species and PMF factors are plotted in Fig. 8. The AMS species concentrations (except for sulfate) and the PMF factor load-ings were not used as input variables in the FCM clustering analysis.
Species Cluster centroid
Bkgd-1 Bkgd-2 Pol-1 Pol-2 Input variables Particle number (cm−3) 714 1117 2636 6697 NOy(ppb) 0.64 0.95 1.2 2.2 O3(ppb) 14 17 26 36 Black carbon (µg m−3) 0.05 0.16 0.21 0.18 Sulfate (µg m−3) 0.15 0.36 0.44 0.57 AMS species concentrations (µg m−3)
Organic 0.96 2.0 2.5 2.6 Ammonium 0.05 0.12 0.15 0.21 Nitrate 0.03 0.07 0.10 0.12 Chloride 0.007 0.011 0.009 0.007 PMF factor loadings (µg m−3) MO-OOA 0.29 0.83 1.13 1.13 LO-OOA 0.38 0.41 0.62 0.77 IEPOX-SOA 0.18 0.49 0.43 0.29 ADOA 0.044 0.086 0.19 0.32 BBOA 0.028 0.054 0.081 0.063 HOA 0.017 0.027 0.039 0.040
rial produced both on that day and on previous days. Dur-ing transport, the organic PM may have undergone exten-sive atmospheric oxidation by a combination of surface and condensed-phase chemistry, including cloud water processes (Carlton et al., 2006; Ervens et al., 2011; Hoyle et al., 2011; Perraud et al., 2012). Therefore, concentrations and compo-sition of the Bkgd-2 cluster may represent an extensive geo-graphical footprint.
The organic PM concentration and composition associated with the Pol-1 and Pol-2 clusters were distinct from those of the Bkgd-1 and Bkgd-2 clusters (Fig. 8). The mass concen-trations of organic PM were greater by 25 % to 150 % for Pol-1 and Pol-2. According to the PMF factors (Fig. 8b), the larger part of this increase in organic PM between the back-ground and polluted clusters was tied to the production of secondary organic PM, although primary emissions also con-tributed significantly. By comparison, for both Bkgd-1 and Bkgd-2 clusters, contributions by primary emissions were negligible, as indicated by the low summed contribution of factors of primary origin (i.e., ADOA, BBOA, and HOA) to the organic PM1(< 10 %). For Pol-1 and Pol-2, the ADOA
factor loading accounted for 10 % of the organic mass con-centration at T3 on average, serving as a strong marker of Manaus pollution. A comparison of the results for 9
Febru-Figure 8. Characteristic PM composition of the FCM clusters as represented by coordinates of cluster centroids. (a) Mass concentra-tions of AMS species characteristic of each cluster. (b) PMF factor loadings characteristic of each cluster. Calculations are presented in more detail in the Supplement (Sect. S3). Values plotted are shown in Table 2.
ary and 9 March with those of 13 and 16 February illustrates these findings (Fig. 6d).
With regard to secondary organic PM, the IEPOX-SOA factor loading decreased by almost 50 % under polluted compared with background conditions. The study of de Sá et al. (2017) attributed this decrease to the suppression of IEPOX production by elevated NO concentrations. This suppression typically outweighed possible enhancements in IEPOX uptake and subsequent PM production because of el-evated sulfate concentrations. By contrast, the LO-OOA and MO-OOA factor loadings increased by 50 % to 100 % under polluted conditions. These increases exceeded the decrease in IEPOX-SOA factor loadings, resulting in a net increase of around 100 % in mass concentration of secondary organic PM (Fig. 8).
The shifts in the processes governing the production of secondary organic PM because of increased NOx, OH, and
O3concentrations characteristic of the pollution plume were
path-ways were driven faster. The relatively high fCO+
2 values and
O : C ratios of all factors (Table 1), including those associ-ated with primary emissions, compared to typical values at other locations worldwide (Canagaratna et al., 2015), corrob-orate this interpretation. Ozone concentrations in the plume increase by 200 % to 300 %, and hydroxyl radical concen-trations increased by 250 % or more (Y. Liu et al., 2018). As HO2 pathways were suppressed, NO pathways became
more active. Increased oxidant concentrations may also have promoted additional multigenerational chemistry of semi- or intermediate-volatility species (Robinson et al., 2007). Ox-idation of VOCs by aqueous-phase reactions, including in-cloud processing, and the oxidation of biomass burning emis-sions may also have played roles to varying degrees on dif-ferent days (Carlton et al., 2006; Ervens et al., 2011; Hoyle et al., 2011; Perraud et al., 2012). In addition, when primary and secondary PM mass concentrations increased, further uptake of oxidized semi-volatile molecules could have been thermo-dynamically favored according to partitioning theory, repre-senting a positive feedback on the increase of mass concen-trations (Pankow, 1994; Odum et al., 1996; Carlton et al., 2010).
The increase in the LO-OOA and MO-OOA factor load-ings associated with Pol-1 and Pol-2 indicates that the net effect of this accelerated and modified chemistry was the quick production and further oxidation of secondary organic PM. Precursors may have included both the wide range of biogenic VOCs as well as contributions from anthropogenic precursors, such as gas-phase species from vehicle emissions or evaporated primary material (Nordin et al., 2013; Presto et al., 2014). The LO-OOA factor loading was important for the polluted conditions of Pol-1 and Pol-2 as well as for the clean conditions of Bkgd-1. This result is not necessarily because of a similar molecular composition but rather because of a shared process, i.e., fresh production of secondary organic PM (Fig. 9b). Likewise, the MO-OOA factor loading was im-portant for Pol-1, Pol-2, and Bkgd-2 because this factor rep-resented a shared process, i.e., extensive oxidation (Fig. 9b). In the case of the MO-OOA factor, there is also an overall similar composition characterized by highly oxidized species even as precursor species and subsequent oxidation pathways differed (Jimenez et al., 2009).
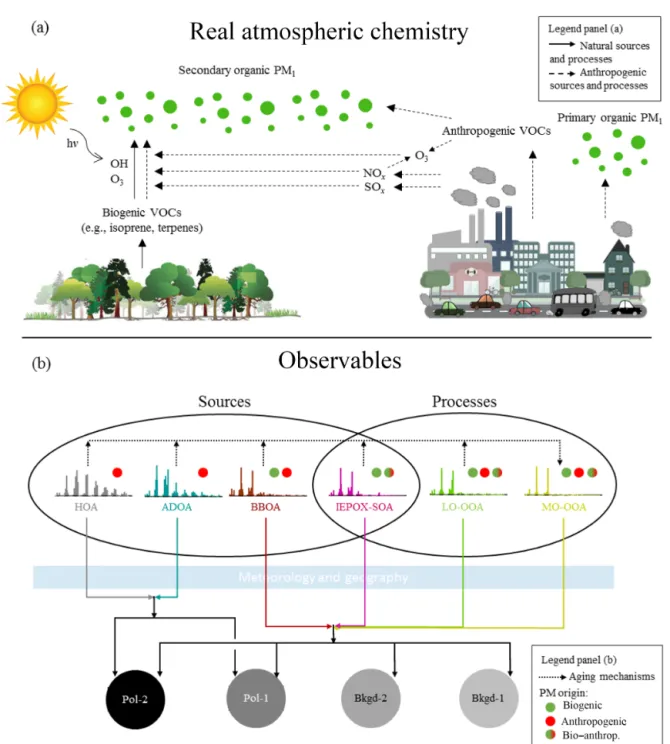
The complexity of the real atmospheric processes, as illus-trated in Fig. 9, is to some extent captured by the instrumental and analytical tools employed in this study. Positive-matrix factorization identified several broad classes of organic PM. Some PMF factors had sufficiently unique signatures that they could be associated to one specific source and/or process (e.g., HOA and IEPOX-SOA). Other factors, in contrast, rep-resented a wide range of sources that shared processes (e.g., LO-OOA and MO-OOA). The clustering analysis contextu-alized the PMF results and demonstrated that the effects of the urban pollution were neither limited to nor captured by a single PMF factor. Instead, the urban plume influenced
sev-eral PMF factors in different ways and to different extents. The implication is that changes in the AMS spectral signa-ture of the organic PM caused by polluted conditions may not be sufficiently unique to allow for its complete separation by PMF analysis alone, especially with respect to the production of secondary organic PM. In this context, the fuzzy c-means analysis served as a useful tool in this study to incorporate auxiliary datasets and further understand anthropogenic in-fluences on PM production and characteristics.
4 Summary and conclusions
Changes in the concentrations and the composition of fine-mode PM due to the influence of anthropogenic emissions were investigated for the Amazonian wet season. Organic material dominated the submicron composition, consistently representing between 70 % and 80 % of the PM1mean mass
concentration across measurement sites upwind and down-wind of Manaus and across different levels of pollution. However, absolute mass concentrations varied significantly among sites. Average concentrations downwind of Manaus were 100 % to 200 % higher than those upwind. Furthest downwind at T3, the organic component was more oxidized than that at the T2 site.
Positive-matrix factorization and fuzzy c-means clustering were applied to the datasets to obtain a composite analysis of the shifts in PM1concentrations and composition under
pol-luted conditions. Based on the FCM clustering, every point in time at T3 was interpreted as being affected by a combination of four influences, as represented by four clusters. Two back-ground (Bkgd-1 and Bkgd-2) and two polluted (Pol-1 and Pol-2) clusters were identified. Particle mass concentrations were double for polluted compared with background con-ditions. Contributions from secondary processes dominated (> 80 %) for both background and polluted conditions.
In terms of primary emissions, absolute contributions in-creased by a factor of 5 or more under polluted conditions, corresponding to an increase from < 10 % to 15 % of total PM1. The ADOA factor loading increased over 5-fold for the
polluted compared with the background clusters; thus, this factor served as a strong tracer of Manaus pollution. BBOA and HOA factor loadings, associated with biomass burning and fossil fuels, respectively, increased 2-fold with pollution. The ADOA factor loading represented 61 % to 76 % of the total primary factor loadings for the Pol-1 and Pol-2 clusters. Regarding secondary processes, the analysis finds that the pollution plume acted both to shift pathways of secondary organic PM production and to accelerate the atmospheric ox-idation of preexisting organic PM. The oxox-idation of biogenic PM precursors shifted from HO2- to NO-dominant pathways,
and the oxidation of anthropogenic precursors possibly con-tributed to increased PM concentrations. The IEPOX-SOA factor loadings were highest for the Bkgd-2 cluster, associ-ated with long-range transport under background conditions,
Figure 9. Schematic representation of (a) atmospheric processes, illustrated in a simplified manner, associated with the production of organic PM1and (b) observables of these processes as captured by the datasets and analytical approach employed in this study. In panel (a), the left
side depicts the emissions of biogenic volatile organic compounds (VOCs), their atmospheric oxidation, and the production of biogenic sec-ondary organic PM1. The right side depicts anthropogenic emissions of gas species and particulate matter that can alter natural atmospheric
concentrations and processes. There are primary organic PM1emissions from traffic, cooking, and industrial activities. Anthropogenic VOCs
can be precursors for the production of secondary organic PM1and can affect the production of ozone and hydroxyl radicals. NOxemissions
directly and indirectly alter the natural pathways of PM1production in the atmosphere. NOxand SOx can also directly contribute to the
formation of secondary inorganic PM1(not shown), which can in turn play a role in changing pathways of secondary organic PM1
produc-tion. In panel (b), different PMF factors represent distinct sources and/or processes. The IEPOX-SOA factor is at the intersection of the two, as it represents both a source (i.e., isoprene emissions from the forest) and a process (i.e., photooxidation under HO2dominant conditions,
influenced by sulfate concentrations). The dashed black line represents the natural and anthropogenic oxidative processes that transform the chemical signature of the HOA, ADOA, BBOA, IEPOX-SOA, and LO-OOA factors after sufficient atmospheric residence time into the MO-OOA factor. The clusters represent different conditions at the receptor site (i.e., T3); therefore, they incorporate the meteorological and geographical histories of the air masses that reach the site and affect the observed concentrations. The different PMF factors are associated to the different clusters (solid lines) to various extents (not detailed here for simplification purposes; cf. Fig. 8).
and decreased by almost 50 % for the polluted clusters, in line with a shift of isoprene oxidation from HO2-dominant to
NO-dominant pathways. Concomitantly, the LO-OOA factor loading increased by more than 50 % for these clusters, sug-gesting rapid in-plume production of secondary organic PM through several pathways. The LO-OOA factor was also im-portant for the Bkgd-1 cluster, associated with fresh back-ground conditions, which is suggestive of recent biogenic or-ganic PM production. The MO-OOA factor had large relative contributions in the Bkgd-2, Pol-1, and Pol-2 clusters, which is suggestive of significant oxidative processing associated with these clusters. Increases of up to 300 % in the MO-OOA factor loadings for Pol-1 and Pol-2 relative to background conditions of Bkgd-1 showed the effects of an accelerated oxidation cycle, leading to highly oxidized PM downwind of Manaus. Based on this and related studies (Y. Liu et al., 2016; de Sá et al., 2017; Martin et al., 2017), the critical lever seems to be increased concentrations of nitrogen oxides in the pol-lution plume for both directly shifting and indirectly accel-erating mechanisms of secondary organic PM production in central Amazonia during the wet season.
The altered composition under anthropogenic influences also affects the physical properties of the PM1. Bateman et
al. (2017), using the results of the PMF analysis presented herein, reported a shift from predominantly liquid PM under background conditions to a considerable presence of non-liquid PM under polluted conditions above a relative hu-midity of 50 %. Non-liquid PM can have different reactive chemistry from liquid PM (Li et al., 2015; P. Liu et al., 2018). A linear relationship between the increase in parti-cle rebound fraction and the sum of ADOA, BBOA, and HOA factor loadings had an R2of 0.7. The highest individual correlation was with the ADOA factor loading (Adam Bate-man, personal communication, 2017). In addition, Thalman et al. (2017), also using the PMF results reported herein, con-cluded that the larger relative contribution of secondary or-ganic material during the daytime compared with the night-time was the primary driver of the diel trend of higher particle hygroscopicity during the day compared to the night, as tied to the properties of cloud condensation nuclei.
This study communicates a snapshot of the changes that occur in the atmospheric composition over a tropical forest due to regional urbanization. In the context of a forest in transition (Davidson et al., 2012), the findings of this study provide a quantitative assessment of the effects of urban pol-lution on the forested surroundings of Manaus. The studied region and the observed changes in atmospheric composition represent a microcosm that might become more widespread through Amazonia as urbanization trends continue in the fu-ture. Further investigations of the specific chemical pathways and physical mechanisms that enhance PM production in the urban plume are warranted to understand what other pollu-tants are critical for control in the context of ongoing and future air quality regulation in the study region as well as for other tropical forested environments worldwide.
Data availability. The data sets used in this publication are available at the ARM Climate Research Facility database for the GoAmazon2014/5 experiment (https://www.arm.gov/research/ campaigns/amf2014goamazon, last access: 1 February 2018).
Supplement. The supplement related to this article is available online at: https://doi.org/10.5194/acp-18-12185-2018-supplement.
Author contributions. STM, JLJ, MLA, JW, RAFS, AHG, and PA designed, planned, and supervised the broader GoAmazon2014/5 field experiment. SSdS and STM defined the scientific questions and scope of this study. SSdS, BBP, PCJ, DAD, and WH carried out the primary measurements and data processing. GIV, LDY, JB, SC, YL, RT, AS, AF, CS, JES, JS, KAM, HB, GGC, and IOR performed auxiliary data collection/processing and simulations. SSdS, STM, and PA carried out the scientific analysis involving PMF and FCM. SSdS prepared the paper with substantial contributions from STM and additional contributions from all coauthors.
Competing interests. The authors declare that they have no conflict of interest.
Special issue statement. This article is part of the special issue “Observations and Modeling of the Green Ocean Amazon (GoA-mazon2014/5) (ACP/AMT/GI/GMD inter-journal SI)”. It is not as-sociated with a conference.
Acknowledgements. Institutional support was provided by the Cen-tral Office of the Large Scale Biosphere Atmosphere Experiment in Amazonia (LBA), the National Institute of Amazonian Research (INPA), and Amazonas State University (UEA). We acknowledge support from the Atmospheric Radiation Measurement (ARM) Climate Research Facility, a user facility of the United States Department of Energy (DOE; grant no. DE-SC0006680), Office of Science, sponsored by the Office of Biological and Environmental Research, and support from the Atmospheric System Research (ASR; grant no. DE-SC0011115, DE-SC0011105) program of that office. Additional funding was provided by the Amazonas State Research Foundation (grant no. FAPEAM 062.00568/2014 and 134/2016), the São Paulo State Research Foundation (grant no. FAPESP 2013/05014-0), the USA National Science Foundation (grant nos. 1106400 and 1332998), and the Brazilian Scientific Mobility Program (CsF/CAPES). Suzane S. de Sá acknowledges support from the Faculty for the Future Fellowship of the Schlum-berger Foundation. Brett B. Palm is grateful for a US EPA STAR Graduate Fellowship (grant no. FP-91761701-0). The authors thank Paulo Castillo for his assistance in quality checking the black carbon data from MAOS. Data access from the Sistema de Proteção da Amazônia (SIPAM) is gratefully acknowledged. The research was conducted under scientific license 001030/2012-4 of the Brazilian National Council for Scientific and Technological Development (CNPq).