HAL Id: hal-02472276
https://hal-univ-rennes1.archives-ouvertes.fr/hal-02472276
Submitted on 10 Feb 2020
HAL is a multi-disciplinary open access
archive for the deposit and dissemination of
sci-entific research documents, whether they are
pub-lished or not. The documents may come from
teaching and research institutions in France or
abroad, or from public or private research centers.
L’archive ouverte pluridisciplinaire HAL, est
destinée au dépôt et à la diffusion de documents
scientifiques de niveau recherche, publiés ou non,
émanant des établissements d’enseignement et de
recherche français ou étrangers, des laboratoires
publics ou privés.
mode group division multiplexing
Kevin Lenglé, Xavier Insou, Pu Jian, Nicolas Barré, Bertrand Denolle,
Laurent Bramerie, Guillaume Labroille
To cite this version:
Kevin Lenglé, Xavier Insou, Pu Jian, Nicolas Barré, Bertrand Denolle, et al.. 4x10 Gbit/s bidirectional
transmission over 2 km of conventional graded-index OM1 multimode fiber using mode group division
multiplexing. Optics Express, Optical Society of America - OSA Publishing, 2016, 24 (25),
pp.28594-28605. �10.1364/OE.24.028594�. �hal-02472276�
4 × 10 Gbit/s bidirectional transmission over
2 km of conventional graded-index OM1
multimode fiber using mode group division
multiplexing
K.
L
ENGLÉ,
1,*X.
I
NSOU,
1P.
J
IAN,
1N.
B
ARRÉ,
1B.
D
ENOLLE,
1L.
B
RAMERIE,
2 ANDG.
L
ABROILLE11CAILabs, 8 rue du 7eRégiment d’Artillerie, 35000 Rennes, France
2FOTON, CNRS UMR6082, 6 rue de Kérampont, 22300 Lannion, France
*kevin@cailabs.com
Abstract: We demonstrate 4 × 10 Gbit/s error-free bidirectional transmission over 2 km of conventional OM1 graded-index multimode fiber using OOK modulation and direct detection. We also perform field transmission to show reach and capacity boosts on legacy multimode infrastructure. Such transmission is enabled by selective mode group division multiplexing, based on multi-plane light conversion over 4 mode groups of the multimode fiber.
c
2016 Optical Society of America
OCIS codes: (060.4230) Multiplexing; (060.4510) Optical communications; (080.4295) Nonimaging optical systems; (230.1150) All-optical devices.
References and links
1. IEEE 802.3 Standard for Ethernet, section 4, http://standards.ieee.org/about/get/802/802.3.html 2. IEEE 802.3aq 10GBASE-LRM Standard, http://www.ieee802.org/3/aq/index.html
3. H. R. Stuart, “Dispersive multiplexing in multimode optical fiber,” Science 289(5477), 281–283 (2000).
4. R. Ryf, N .K. Fontaine, B. Guan, B. Huang, M. Esmaeelpour, S. Randel, A. H. Gnauck, S. Chandrasekhar, A. Adamiecki, G. Raybon, R. W. Tkach, R. Shubochkin, Y. Sun, and R. Lingle, “305-km Combined Wavelength and Mode-Multiplexed Transmission over Conventional Graded-Index Multimode Fibre,” in the 2014 European Conference and Exhibition on Optical Communication (ECOC), paper PD.3.5.
5. B. Franz and H. Bulow, “Experimental evaluation of principal mode groups as high-speed transmission channels in spatial multiplex systems,” IEEE Photon. Technol. Lett., 24(16), 1363–1365 (2012).
6. H. Chen, H. P. A. van den Boom, and T. Koonen, “30Gbit/s 3×3 Optical Mode Group Division Multiplexing System with Mode-Selective Spatial Filtering,” in Optical Fiber Conference (OFC) 2011, paper OWB1.
7. G. Labroille, B. Denolle, P. Jian, P. Genevaux, N. Treps, and J. F. Morizur, “Efficient and mode selective spatial mode multiplexer based on multi-plane light conversion,” Opt. Express 22(13), 15599–15607 (2014).
8. P. Jian, G. Labroille, B. Denolle, P. Genevaux, N. Barre, O. Pinel, and J. F. Morizur, “Six mode multi-plane light converter for mode-selective spatial multiplexing,” Proceedings SPIE 9389, 93890A (2015).
9. P. Genevaux, C. Simonneau, G. Labroille, B. Denolle, O. Pinel, P. Jian, J. F. Morizur, and G. Charlet, “6-mode Spatial Multiplexer with Low Loss and High Selectivity for Transmission over Few Mode Fiber,” in Optical Fiber Conference (OFC) 2015, paper W1A.5.
10. K. Igarashi, D. Souma, Y. Wakayama, K. Takeshima, Y. Kawaguchi, T. Tsuritani, I. Moriat, and M. Suzuki, “114 Space-Division-Multiplexed Transmission over 9.8-km Weakly-Coupled-6-Mode Uncoupled-19-Core Fibers,” in Optical Fiber Conference (OFC) 2015, paper Th5C.4.
11. G. Labroille, P. Jian, L. Garcia, J. B. Trinel, R. Kassi, L. Bigot, and J.F Morizur, “30 Gbit/s Transmission over 1 km of Conventional Multi-mode Fiber using Mode Group Multiplexing with OOK modulation and direct detection,” in the 2015 European Conference and Exhibition on Optical Communication (ECOC), P.5.12.
12. C. Simonneau, A. D’amato, P. Jian, G. Labroille, J.F. Morizur, and G. Charlet, “4 × 50 Gb/s transmission over 4.4 km of multimode OM2 fiber with direct detection using mode group multiplexing,” in Optical Fiber Conference (OFC) 2016, Tu2J.3.
13. J. Carpenter and T. D. Wilkinson, “Characterization of Multimode Fiber by selective Mode Excitation,” J. Lightw. Technol. 30(10), 1386–1392 (2012).
#275004 http://dx.doi.org/10.1364/OE.24.028594 Journal © 2016 Received 7 Sep 2016; revised 25 Nov 2016; accepted 29 Nov 2016; published 2 Dec 2016
1. Introduction
In local area networks (LANs) today, the increase in traffic is driving enterprise network man-agers and architects to look for faster technologies to solve increasing bandwidth demands. As enterprise applications use the common Ethernet backbone, the network must be able to seamlessly support a new array of bandwidth-consuming applications such as storage, streaming media, cluster computing, digital imaging, video, etc. This increase in bandwidth demand led to the definition of standards for 10 Gbit/s or higher transmission rates in conventional graded-index (GI) multimode fibers (MMFs) by the IEEE 802.3 task forces [1].
Current local area network bandwidth demands of multi-Gbit/s are pushing the limit of the bandwidth-distance product of MMFs, the predominant fiber in short range optical links. Due to inter-modal dispersion in multimode fibers, and therefore the low modal bandwidths of installed MMFs, the achievable reaches at high bit rates are limited. According to IEEE 802.3 standards, these limits correspond to a maximum of 33 m for OM1 fiber, 82 m for OM2 fiber and 300 m to 450 m for OM3 and OM4 fiber, all at 10 Gbit/s [1], as opposed to 2000 m for 100 Mbit/s. Greater reach can be achieved by using LRM transceivers [2]. The use of mode conditioning patchcords that enable offset launch into MMFs results in an extension of the transmission distance to 220 m at 10 Gbit/s in OM1 and OM2. However these specifications do not cover all the achievable reach needs. The bandwidth demands often require overhauls of new cabling infrastructure. Nowadays, to effectively deal with this increase in bandwidth demand in legacy LAN infrastructure, the solution for high speed enterprise networks is to deploy singlemode fibers (SMFs) for building interconnects. These fibers do not suffer from bandwidth limitation but this redeployment operation may be complex, costly or time-consuming if civil engineering is needed.
In order to overcome these capacity and reach limitations while still using already deployed MMFs, the use of spatial diversity has been proposed [3]. Schemes using complex modulation formats, coherent detection and digital multiple input-multiple output (MIMO) processing have been demonstrated in GI MMFs [4]. They have shown record-high fiber capacity, but they are not compatible with transceivers low cost and low complexity requirements associated with short haul links. A scheme known as mode group division multiplexing (MGDM) in MMFs, in which degenerate modes are used to transport a single data channel, has been introduced in [5, 6]. This way, intra-mode group mixing can be neglected, therefore relaxing the necessity of MIMO processing and allowing the use of simple on-off keying (OOK) modulation and direct detection. However in these experiments the mode groups were either not multiplexed or the lack of mode selectivity prior to detection limited the reach capabilities. Mode multiplexing and demultiplexing based on multi-plane light conversion (MPLC) [7, 8] have already demonstrated their high mode selectivity for transmission over few-mode fibers [9, 10]. Recently, we have shown that mode group multiplexing and demultiplexing based on MPLC enabled the transmission of 3 × 10 Gbit/s transmission over 1 km of OM2 fiber using three mode groups [11]. The same MPLC technique combined with four-level pulse amplitude modulation (PAM4) allowed to achieve 200 Gbit/s bidirectional transmission over 4.4 km of conventional OM2 fiber [12].
In this work, we demonstrate the full potential of mode group multiplexing for increasing the transmission capacity and the reach of existing legacy MMF links. By using highly mode-selective multiplexers (MUX) and demultiplexers (DEMUX) based on MPLC, we demonstrate a 4 × 10 Gbit/s link over 2 km of conventional GI OM1 fiber, using four mode groups of the fiber and standard transceivers. Bit error rates (BERs) below 10−12were measured for each mode group channel with simultaneous transmissions through the other channels. We investigate the behavior of this multiplexing technique with respect to system degradation. We also perform for the first time field trial transmission over 660 m of OM1 fiber in a LAN to demonstrate the capacity upgrade in an existing MMF LAN infrastructure.
2. Principle
2.1. Multi-plane light conversion
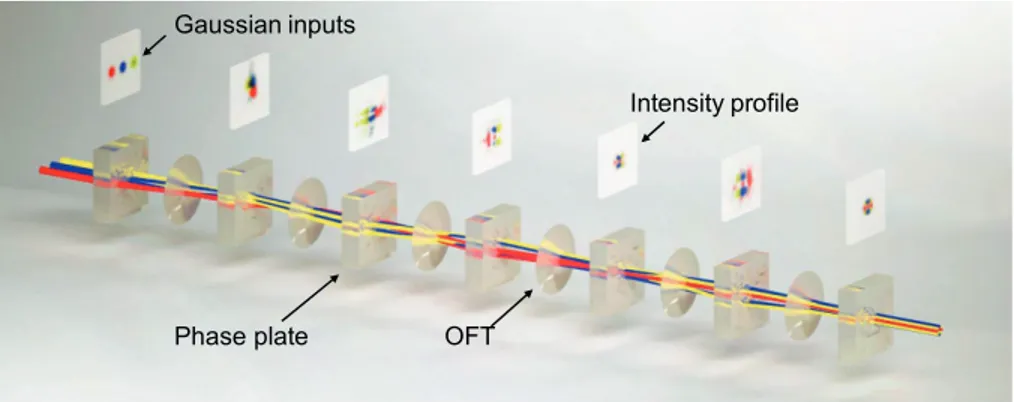
In this work, mode group multiplexing is based on MPLC. MPLC is a technique that allows to perform any unitary spatial transform. Theoretically, any unitary spatial transform can be implemented by a succession of transverse phase profiles separated by optical Fourier transforms (OFT). In particular, the conversion of N separate input Gaussian beams into N orthogonal propagation modes of a fiber, i.e. spatial multiplexing, can be considered as a unitary spatial transform and therefore can be achieved with MPLC [7]. An example of spatial multiplexing for 3 modes is shown in Fig. 1. The unitarity of the transform ensures that there is no intrinsic loss in the mode conversion. Losses in MPLC only occur due to imperfect optical elements (e.g. coating or imperfect phase plate manufacturing). The inverse unitary transform, given by using the MPLC in the reverse direction, implements the demultiplexing operation of the same modes.
OFT
Intensity profile
Phase plate Gaussian inputs
Fig. 1. Conceptual illustration of 3-mode multiplexing based on MPLC.
Input SMF array
Phase plate
Mirror Output MMF
Fig. 2. Photograph of a mode multiplexer based on MPLC.
In order to reduce the footprint of the MPLC as well as decrease the complexity of aligning free-space optical elements, the MPLC is in practice implemented using a multi-pass cavity (in Fig. 2), in which the successive phase profiles are all printed on a single reflective phase plate. The cavity is formed by a mirror and the reflective phase plate, implementing the successive phase profiles and optical transforms.
2.2. Mode group multiplexing
A GI MMF with a parabolic refractive index profile presents linearly polarized (LP) modes with degenerate propagation constants, for modes LPl,mwith the same value of l+2m +1. Degenerate modes couple very strongly within their mode group, while modes from separate mode groups are much more isolated and can be considered as independent transmission channels. In this work, a spool of 2 km of GI OM1 MMF is used (62.5 µm core diameter and 125 µm cladding diameter). According to mode-solving numerical calculations based on experimental graded-index profiles measurements, such fiber supports 171 modes in 18 mode groups at 1550 nm and 231 modes in 21 mode groups at 1310 nm. The same calculations show that GI OM2 MMF (50 µm core diameter and 125 µm cladding diameter) supports 55 modes in 10 mode groups at 1550 nm and 78 modes in 12 mode groups at 1310 nm. Note that these calculations consider perfect fibers without bending. Our calculations are close to experimental results obtained in [13]. Calculations show that the mode profiles of the first 4 mode groups are very similar in OM1 and OM2 (mode overlap > 98%, cross-talk < −22 dB) allowing to use the same multiplexer and demultiplexer over OM1 and OM2 fibers.
In this work, we use the first 4 mode groups, as shown in Fig. 3: LP01mode (group 1), mode
group comprising LP11a and LP11b modes (group 2), mode group comprising LP21a, LP21b
and LP02modes (group 3), and mode group comprising LP31a, LP31b, LP12aand LP12b modes
(group 4). MGMUX MGDEMUX MMF Transmission Intra mode group coupling
Fig. 3. Principle of mode group multiplexing.
In order to avoid the use of any complex detection scheme (coherent detection and MIMO processing), the spatial multiplexer (MUX) and demultiplexer (DEMUX) must fully encompass the capability of each mode group. More precisely, in the multiplexing part, one mode of each mode group is excited; after propagation in the fiber, due to the large intra-mode group coupling, all the modes of the same mode group need to be detected simultaneously.
Mode group multiplexing (MGMUX) is achieved by using a 4-mode MUX based on MPLC. The 4 modes excited by the MUX are: LP01, LP11b, LP21b and LP31b. These modes are chosen
arbitrarily, and other sets of modes for mode group 2, 3 and 4 yield similar performances for the MGMUX.Mode group demultiplexing (MGDEMUX) is obtained by demultiplexing all the 10 modes, then summing the optical fields by coupling the modes of a same mode group in an MMF pigtail. This last stage of summation and coupling is also performed by the MPLC, without any additional optical element.
Equipments are designed in order to allow bidirectional transmission in the fiber. Group 1 (i.e. LP01) and 4 (i.e. LP31b) are co-propagative while group 2 (i.e. LP11b) and 3 (i.e. LP21b) are
co-propagative and propagate in the opposite direction. In such a way, it is possible to obtain 2 duplex channels in a fiber or 4 duplex channels in a standard pair of fibers.
3. MGMUX and MGDEMUX assessment 3.1. Cross-talk and insertion loss performance
Two pairs of multiplexers, one at 1310 nm and one at 1550 nm, supporting 4 mode groups were fabricated using an implementation with 14 reflections on the phase plate. The systems convert light from 4 input SMFs into the modes LP01, LP11b, LP21b and LP31bof the OM2 MMF.
Figure 4 shows the measured intensity distribution of the four excited modes measured using a super luminescent diode (SLD) as light source before coupling to the MMF.
LP01 LP11b LP21b LP31b
Fig. 4. Measured intensity distributions of the four excited modes measured using an SLD source.
We characterize the MG(DE)MUX using the setup shown in Fig. 5. The transmission matrix of a back-to-back (BtoB) system comprising a MUX, 20 meters of OM2 MMF and a DEMUX is measured using an optical switch and a multi-channel optical power meter. The input light source is an SLD centered at 1550 nm or 1310 nm with FWHM bandwidth of 50 nm followed by an optical isolator and a polarization scrambler. Measurements with a low coherence SLD sources are not affected by multi-path interferences, therefore they are more stable than when using a high-coherence sources such as distributed feedback lasers (DFBs).
Input SMFs 1: 5 op tic al sw itc h M ul ti-ch an ne lp ow er me te r SLD Polarizationscrambler MG(De)Mux IN gp 1 IN gp 4 OUT gp 2 OUT gp 3 MG(De)Mux IN gp 2 IN gp 3 OUT gp 1 OUT gp 4 20m OM 2 fiber Output MMFs Reference channel
Fig. 5. Cross-talk and insertion loss characterization setup.
We measure the matrix of output powers Pi, jfor power on output j when light is launched into input i, allowing to retrieve the coupling efficiency and the modal cross-talk for all mode groups. Insertion loss for mode group i is obtained by the ratio between the input power (measured directly from the reference channel in Fig. 5) and Pi,i. Note that, we only take into account the
modal cross-talk for co-propagative mode groups (i.e. cross-talk between group 1 and group 4 as well as group 2 and group 3). Indeed, the modal cross-talk between mode groups that propagate in opposite direction are mainly due to back reflections and is below -33 dB, thus neglected.
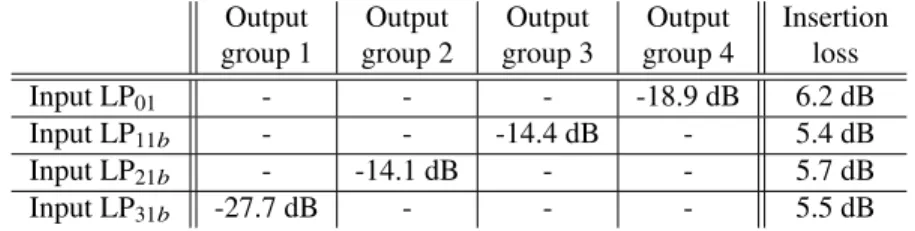
Table 1 shows the measured cross-talk and coupling efficiency matrix for a back-to-back system at 1550 nm using an SLD source. In the cross-talk matrix, terms due to back reflections are not shown and are neglected. The average insertion loss is 5.7 dB and the worst cross-talk is −14.1 dB. The average cross-talk between mode groups is -16.5 dB. Considering that several
Table 1. Modal cross-talk and insertion loss for a MPLC-based MG(DE)MUX back-to-back system at 1550 nm.
Output Output Output Output Insertion group 1 group 2 group 3 group 4 loss
Input LP01 - - - -18.9 dB 6.2 dB
Input LP11b - - -14.4 dB - 5.4 dB
Input LP21b - -14.1 dB - - 5.7 dB
Input LP31b -27.7 dB - - - 5.5 dB
modes are summed in the MGDEMUX, this is equivalent to a cross-talk between modes of -20.4 dB. The mode group dependent loss, defined as the difference between the highest and the lowest insertion losses, is 0.8 dB. Finally, polarization dependent loss is measured to be < 0.2 dB for all modes.
In order to evaluate the impact of transmission fiber length on the MG(DE)MUX performances, cross-talks and coupling efficiencies have been measured for several transmission configura-tions, from back-to-back to 2 km long transmission over MMF at both 1550 nm and 1310 nm wavelength range (see Table 2).
Table 2. Cross-talk (XT) and insertion losses (IL) summary for several transmission configurations of the MPLC-based MG(DE)MUX system (units: dB).
Transmission config. Wavelength band Worst XT Mean IL Worst IL
BtoB (20m OM2) 1550 nm -14.1 5.6 6.2
+1 m long OM1 spliced 1550 nm -13.1 5.8 6.3
+2 km long OM1 spliced 1550 nm -12.0 6.5 7.0
BtoB (20m OM2) 1310 nm -13.7 6.8 7.8
+1 m long OM1 spliced 1310 nm -11.5 7.1 8.0
+2 km long OM1 spliced 1310 nm -10.7 8.4 8.9
For the MG(DE)MUX at 1550 nm, the cross-talk is degraded by 1 dB when 1 m of OM1 is added by splicing. The degradation is mainly due to the splices that impact mode matching. The insertion losses increase by only 0.2 dB due to both end splices. When 2 km of fiber are added, cross-talk increases by 1 dB, showing the weak impact of cross-talk during propagation into the fiber, and the insertion loss increases by the standard propagation losses in an MMF (around 0.4 dB/km at 1310 and 1550 nm).
As far as the MG(DE)MUX at 1310 nm is concerned, the worst cross-talk is -13.7 dB for a 20 m back-to-back configuration. We can notice ∼ 2 dB cross-talk performance degradation when we add 1 m of OM1 by splicing. This degradation is higher than at 1550 nm but this is mainly explained by different fiber cores excentricities and by splicing issues rather than mode profile mismatch. Indeed, measurements show that the mode profiles for OM1 and OM2 fibers are very similar. When 2 km of OM1 MMF are added, the cross-talk performance decreases by 0.8 dB, confirming the very weak impact of cross-talk during propagation in the fiber.
3.2. Single channel transmission performance
The evaluation of 10 Gbit/s transmission over MMF fiber is performed using the setup shown in Fig. 6 with 2 km of OM1 MMF. Bit error rate tester (BERT) systems are used for each channel both for generating the data pattern and for error detection. A 10 Gbit/s signal consisting of a
M G (D e) M ux M G (D e) M ux MMF Fiber Fusion Splice In group 1 Out group 3 In group 4 Out group 2 Rx BERT 10GBASE-ER/LR transceiver Tx In group 2 Out group 4 In group 3 Out group 1
: Variable Optical Attenuator : SMF patchcord : MMF patchcord
BERT 10GBASE-ER/LR transceiver Rx Tx BERT 10GBASE-ER/LR transceiver Tx Rx BERT 10GBASE-ER/LR transceiver Tx Rx Rx
Fig. 6. Experimental characterization setup for high bit rate transmission over MMF.
231− 1 pseudo-random binary sequence (PRBS) data pattern is used to modulate an externally
modulated laser (EML) at 1310 nm or 1550 nm for each channel. Note that, in the 1310 nm range, standard 10GBASE-LR transceivers are used in this evaluation with specifications of 6 dB extinction ratio and 13 dB optical budget (Finisar FTLX1412M3BCL). In the 1550 nm range, standard 10GBASE-ER transceivers are used with specifications of 8.2 dB extinction ratio and 16 dB optical budget (Finisar FTLX1612M3BCL). The transceivers are connected to MG(DE)MUX through singlemode patchcords at the transmitting ports (Tx) and through multimode patchcords at the receiving ports (Rx).
22 21 20 19 18 17
Receiver Input Power (dBm)
10-12 10-11 10-10 10-9 10-8 10-7 10-6 10-5 10-4 10-3 10-2
Bit Error Rate
Single-mode BtoB Group 1 Group 2 Group 3 Group 4
(a) Bit error rates at 1310 nm.
25 24 23 22 21 20 19 18
Receiver Input Power (dBm)
10-12 10-11 10-10 10-9 10-8 10-7 10-6 10-5 10-4 10-3 10-2
Bit Error Rate
Single-mode BtoB Group 1 Group 2 Group 3 Group 4
(b) Bit error rates at 1550 nm.
Fig. 7. Bit error rate measurements at 10 Gbit/s for each channel independently launched in
a 2 km OM1 MMF, at (a) 1310 nm and (b) 1550 nm.
We successively assess the 10 Gbit/s transmission of each channel launched independently with the same transceiver, all other channels being switched off, by evaluating the power penalty. We define the power penalty as the additional received power required to achieve a BER of 10−9compared to the SMF back-to-back configuration. In order to test various fiber configu-rations exhibiting multi-path interferences, the MMF is subjected to stress conditions during the measurement: bending (down to a radius of curvature of 35 mm) and twisting. Figure 7 shows the BER as a function of the receiver input power. For this measurement, due to the lack of multimode variable optical attenuator (VOA), we use singlemode VOA at the output of the transmitter. The results show no error floor and no significant penalty (less than 1 dB at a BER
of 10−9) for each channel after passing through MG(DE)MUX and 2 km of OM1 MMF, for both 1310 nm and 1550 nm wavelength ranges. Despite the multi-path interferences induced by fiber shaking during the measurement, the power penalty is weak for each mode group channel. This measurement demonstrates that the modal selectivity of the MGMUX reduced the modal dispersion impact. Each of the four mode groups enables the transmission of 10 Gbit/s telecoms signals on long standard MMF.
4. 4×10 Gbit/s mode group multiplexed bidirectional transmission over
conven-tional graded-index OM1 multimode fiber 4.1. Power penalty due to MGDM transmission
In order to evaluate the power penalty induced by MGDM, mode group multiplexed transmission over 2 km long OM1 MMF is performed using the setup represented in Fig. 6. In order to use uncorrelated signals in the four simultaneous independent transmission channels, four standard 10 Gbit/s transceivers are used, independently controlled. Due to the lack of multimode VOA, we use singlemode VOA at the output of Tx ports. We evaluate, all other channels being switched on and attenuated by the same value as the channel under study, the power penalty for each channel compared to each transceiver singlemode back-to-back configuration. In this configuration, the modal cross-talk is kept constant while all channels are attenuated simultaneously by the same value.
The results are shown in Fig. 8, for 1310 nm and 1550 nm operation. Since the sensitivity of a transceiver varies from one transceiver to the other, we show the SMF BtoB of the four transceivers used. Transmission performance remains good for all channels, without error floor. For mode groups 1 to 4, the power penalties for a BER of 10−9 compared to SMF BtoB are 0.3 dB, 0.9 dB, 2 dB and 1.1 dB, respectively, for 1310 nm operation and 0.3 dB, 0.8 dB, 0.4 dB and 0.6 dB, respectively, for 1550 nm operation. We notice that mode groups with initial higher cross-talks (groups 2-4 compared to group 1) suffer from higher power penalty.
23 22 21 20 19 18 17 16 15 Receiver Input Power (dBm)
10-12 10-11 10-10 10-9 10-8 10-7 10-6 10-5 10-4 10-3 10-2
Bit Error Rate SMF BtoB for Group 1
SMF BtoB for Group 2 SMF BtoB for Group 3 SMF BtoB for Group 4 Group 1 Group 2 Group 3 Group 4
(a) Bit error rates at 1310 nm.
25 24 23 22 21 20 19 18 17 Receiver Input Power (dBm)
10-13 10-12 10-11 10-10 10-9 10-8 10-7 10-6 10-5 10-4 10-3 10-2
Bit Error Rate SMF BtoB for Group 1
SMF BtoB for Group 2 SMF BtoB for Group 3 SMF BtoB for Group 4 Group 1 Group 2 Group 3 Group 4
(b) Bit error rates at 1550 nm. Fig. 8. Bit error rate measurements for 4 × 10 Gbit/s mode group multiplexed transmission over a 2 km OM1 MMF at (a) 1310 nm and (b) 1550 nm.
4.2. Single channel degradation behavior
In this section, we evaluate the behavior of the 4 × 10 Gbit/s mode group multiplexed transmission under a channel degradation. Channel degradation may occur in case of additional losses on a channel input fiber or transceiver aging, i.e. decreased transmitter power for example. For this, we measure the impact of the adjacent channels on a channel with degraded transmitter. The four independent channels are transmitted over a 2 km long OM1 MMF. A singlemode variable optical attenuator is placed after the transmitter of the channel under study. By decreasing the emitting power of this channel, all other channels being switched on at nominal power, we measured the BER of the channel under test as a function of the received power, as shown in Fig. 9. Depending on the channel under study, the overall transmitter attenuation varies from 4 dB to 17 dB at 1550 nm and from 4 dB to 12 dB at 1310 nm. Transmission performance remains good for all channels and we notice no error floor for each channel. This configuration of a degraded channel exacerbates the effect of modal cross-talk on the channel under study and increases power penalty. We notice that transmission penalties are directly correlated with modal cross-talk in this experiment. Mode groups with higher cross-talk yield higher penalties. In the worst case of group 3, the mode group with the worst modal cross-talk, the power penalty for a BER of 10−9is 5.2 dB for 1310 nm operation and 10.1 dB for 1550 nm operation.
24 22 20 18 16 14 12
Receiver Input Power (dBm)
10-12 10-11 10-10 10-9 10-8 10-7 10-6 10-5 10-4 10-3 10-2
Bit Error Rate
Single-mode BtoB Group 1 Group 2 Group 3 Group 4
(a) Bit error rates at 1310 nm.
28 26 24 22 20 18 16 14 12 10 Receiver Input Power (dBm)
10-12 10-11 10-10 10-9 10-8 10-7 10-6 10-5 10-4 10-3 10-2
Bit Error Rate
Single-mode BtoB Group 1 Group 2 Group 3 Group 4
(b) Bit error rates at 1550 nm. Fig. 9. Bit error rate measurements for each channel successively by degrading the emitting power of the channel under study during a 4 × 10 Gb/s mode group multiplexed transmission over 2 km long OM1 MMF.
4.3. System power margin
In this characterization, we evaluate the system power margin in case of global system degrada-tion, additional losses on the link or higher reach needs. We use the experimental setup shown in Fig. 6 on a 2 km OM1 MMF. No variable optical attenuator is used in the measurement setup, corresponding to a standard use configuration. In order to simulate a deployed fiber configuration exhibiting multi-path interferences, the MMF is subjected to stress conditions during the measure-ment: bending (down to a radius of curvature of 35 mm) and twisting. Four standard 10 Gbit/s transceivers are used in nominal configuration (i.e. without VOA) and send uncorrelated signals. The four independent channels are transmitted without error (i.e. BER< 6.5 × 10⁻¹⁵with 95% confidence based on the measurement time, 13 hours). The power received by each channel is measured and shown as bargraph in Fig. 10. The average received power varies depending on the
channel due to different emitting powers and insertion losses. Due to multi-path interferences, we notice a deviation in the received power of each channel. This deviation is bounded and limited to 1.85 dB in the worst case for 1310 nm, with a maximum standard deviation of 0.26 dB. For 1550 nm, this deviation is bounded and limited to 1.69 dB in the worst case, with a maximum standard deviation of 0.33 dB. Despite these modest received power fluctuations, we see that the received powers for all channels are above the measured receivers sensitivities in standard configuration.
From standard use configuration measurements shown in Fig. 10 and channels sensitivities for BER of 10−9over 2 km of OM1 (Fig. 8), we measure at least a system power margin of 5 dB and 12 dB, respectively for 1310 nm and 1550 nm operation.
Tx emitting power range Rx sensitivity range for BER 10-9 Group 1 Rx sensitivity Group 2 Rx sensitivity Group 3 Rx sensitivity Group 4 Rx sensitivity Group 1 Group 2 Group 3 Group 4 System margin IL
(a) Received power distributions for 1310 nm.
Group 1 Group 2 Group 3 Group 4 Group 1 Rx sensitivity Group 2 Rx sensitivity Group 3 Rx sensitivity Group 4 Rx sensitivity Tx emitting power range Rx sensitivity range for BER 10-9 System margin IL
(b) Received power distributions for 1550 nm. Fig. 10. Distributions of received power for each mode group for a 4 × 10 Gbit/s mode group multiplexed transmission over 2 km long OM1 MMF, at (a) 1310 nm and (b) 1550 nm . In blue, the transceivers emitting power range. In dash line, the receivers measured sensitivities
for a BER of 10−9in standard mode group multiplexed transmission configuration.
5. Field trial experiment
We also report on field trials using mode group multiplexing for high capacity transmission to demonstrate that legacy fiber infrastructures are able to transport such multi-10 Gbit/s capacity. The aim is to validate the compliance of our solution with the real operational constraints of a “live” optical LAN infrastructure. Table 3 shows the back-to-back performance of the 1550 nm MG(DE)MUX used for the field trial. The average insertion loss is 6.5 dB and the worst cross-talk is -14.0 dB. Note that the MG(DE)MUX used to perform these field trials are from older generation, which exhibits higher mode group dependent loss up to 2.6 dB than the systems reported in section 3.1 (0.8 dB).
Table 3. Field trial back-to-back MG(DE)MUX performances. Worst XT IL group 1 IL group 2 IL group 3 IL group 4
-14.0 dB 5.4 dB 5.9 dB 7.2 dB 8.0 dB
As an example, we show measurements performed over 600 m OM1 MMF. The four indepen-dent channels are transmitted without error (i.e. BER< 1.4 × 10⁻¹⁵with 95% confidence based on the measurement time, 60 hours) allowing field assessment of the MG(DE)MUX.
As previously, the received power of each channel is measured and shown as bargraph in Fig. 11(a). A fiber shaker, similar to the one described in section 4.3, is used during these measurements. The average received power varies depending on the channel due to different emitting powers and insertion losses. Note that group 4 displays a 3 dB lower margin than group 3; this is because after splicing the MG(DE)MUX on the field trial fibers, mode group 4 shows 3 dB extra loss compared to group 3. This excess loss could be explained by a low quality splice, a dirty connector, or an excessive bend on the MMF which only affects higher order modes. We notice a deviation in the received power of each channel, due to multi-path interferences, bounded and limited to 2.41 dB in the worst case, with a maximum standard deviation of 0.45 dB. Despite these moderate received power fluctuations and the additional losses on group 4, received powers are far from measured receivers sensitivities. In this configuration, we measure a system power margin of 8.7 dB, in case of single channel degradation. Theses results show that the MG(DE)MUX enable 4 × 10 Gbit/s error free transmission over 600 m OM1 MMF legacy network infrastructures. Tx emitting power range Rx sensitivity range for BER 10-9 Group 1 Group 2 Group 3 Group 4 Group 1 Rx sensitivity Group 2 Rx sensitivity Group 3 Rx sensitivity Group 4 Rx sensitivity System margin IL
(a) Received power distributions.
28 26 24 22 20 18 16 14 12 Receiver Input Power (dBm)
10-11 10-10 10-9 10-8 10-7 10-6 10-5 10-4 10-3 10-2
Bit Error Rate
Single-mode BtoB Group 1 Group 2 Group 3 Group 4
(b) Bit error rate measurements. Fig. 11. Performance of a 4 × 10 Gbit/s mode group multiplexed transmission over 600 m field OM1 MMF: (a) received power distribution in standard configuration; in blue, the transceivers emitting power range, in dash line, the receivers measured sensitivities for
a BER of 10−9in mode group multiplexed transmission configuration. (b) Bit error rate
measurements for each channel successively by degrading the emitting power of the channel under study.
We also perform single channel degradation measurements in this field configuration, i.e. BER measurements for each channel successively by degrading the emitting power of the channel under study, all other channels being switched on at nominal power. Results are shown in Fig. 11(b). As previously in the laboratory experiment, we notice increased modal cross-talk leading to higher power penalty but no error floor for each channel. By considering the worst case, i.e. group 3, we measure a power penalty for a BER of 10−9of 8.4 dB.
Using such a mode group multiplexer, 4 × 10 Gbit/s signals using OOK modulation format have been transmitted over various MMFs pairs (OM1 and OM2) in production LANs, ranging from 400 m to 940 m, resulting in a gain factor of 400 in maximum bit rates in these fibers links (compared to 100 Mb/s achievable bit rates specifications for these fibers and distances). The various field trials have occurred in several LAN typologies (hospital, university, enterprise campus, etc), over fiber links currently used in production in the LAN, in different environmental conditions: different fiber age (initially deployed up to 27 years ago), different temperature and
humidity conditions (stabilized server room/ uncontrolled environment / outdoor environment). Table 4 shows some field trials examples performed with this technology, and the bit rates we have achieved on these legacy infrastructures.
Table 4. Mode group multiplexing field trials examples.
Network type Length of Fiber Deployment Bit
fiber link type year rates
Hospital 652 m OM1 1989 4 × 10 Gbit/s
University 926 m OM2 2004 4 × 10 Gbit/s
Urban community 940 m OM1 1997 4 × 10 Gbit/s
These 4 × 10 Gbit/s field trials, which took place over old fiber links, constitute a record transmission on such legacy infrastructure. This achievement represents an important milestone for deployment of high capacity network equipment for future network growth demands on legacy MMF infrastructure.
6. Conclusion
We demonstrate a bidirectional transmission of 4 × 10 Gbit/s over 2 km of conventional OM1 graded-index multimode fiber using 4 mode groups as independent channels.
To the best of our knowledge, this is the first experimental demonstration that mode group multiplexing achieves an increase in capacity and reach for an OM1 MMF transmission with standard transceivers (OOK modulation and direct detection). There is no need for powerful for-ward error correction codes and sophisticated digital signal processing algorithms to compensate for hardware and transmission impairments. Mode group multiplexing and demultiplexing are performed efficiently by using multi-plane light converters, with a complete detection of all the modes in each mode group. We are able to achieve, thanks to high selectivity of the multiplexer and demultiplexer, error free transmission for each mode group channel. All these results show the ability of this multiplexing technique to overcome the limitation of standard MMF.
We have also demonstrated error free 4 × 10 Gbit/s duplex transmission over a span of deployed legacy MMFs pairs (OM1 and OM2) conventionally limited to low bit rates (100 Mb/s). These results illustrate that MPLC-based MG(DE)MUX enable large capacity upgrade in existing MMFs links in LAN backbones.
Acknowledgments
We thank C. Peucheret from CNRS UMR 6082 FOTON for valuable discussion and L. Bigot from CNRS USR 3380 PhLAM/IRCICA for performing experimental graded-index profiles measurements. We also wish to express thanks to ENSSAT graduate engineering school for providing their fiber link for the field tests.