HAL Id: hal-01618291
https://hal.archives-ouvertes.fr/hal-01618291
Submitted on 13 Dec 2017
HAL is a multi-disciplinary open access archive for the deposit and dissemination of sci-entific research documents, whether they are pub-lished or not. The documents may come from teaching and research institutions in France or abroad, or from public or private research centers.
L’archive ouverte pluridisciplinaire HAL, est destinée au dépôt et à la diffusion de documents scientifiques de niveau recherche, publiés ou non, émanant des établissements d’enseignement et de recherche français ou étrangers, des laboratoires publics ou privés.
Modelling non-homogeneous flow and residence time
distribution in a single-screw extruder by means of
Markov chains
Denis Ponomarev, Élisabeth Rodier, Martial Sauceau, Clémence Nikitine,
Vadim Mizonov, Jacques Fages
To cite this version:
Denis Ponomarev, Élisabeth Rodier, Martial Sauceau, Clémence Nikitine, Vadim Mizonov, et al.. Modelling non-homogeneous flow and residence time distribution in a single-screw extruder by means of Markov chains. Journal of Mathematical Chemistry, Springer Verlag (Germany), 2012, 50 (8), pp.2141-2154. �10.1007/s10910-012-0022-x�. �hal-01618291�
Nomenclature
a Coefficient of the homographic equation (m/s)
b Coefficient of the homographic equation (m2/s)
B Distance between flanks (m)
d Diameter of the screw (m)
dz Transition probability along the axis z (–) dy Transition probability along the axis y (–)
D Diffusion coefficient (m2/s)
Db Internal diameter of the barrel (m) e Width of the screw flank (m)
E(i) Calculated residence time distribution (–)
Eexp(t) Experimental residence time distribution (–)
g Coefficient of the homographic equation (m)
gz The down channel pressure gradient (Pa/m) H Cross channel depth (m)
j The transition number (–)
L Length of the screw shaft (m)
Lf Length of the die (m) Ls Length of the channel (m) Lt Total path length (m) m Row number (–)
M Mass of material in the extruder (kg)
n Column number (–)
P Matrix of transition probabilities (–)
Pik Matrix of transition probabilities from kth to ith columns Q Mass flow rate (kg/s)
r Throttle ratio (–)
S State vector (–)
t Time at which the calculated results are obtained (s)
T Temperature of the barrel (◦C)
v Transition probability describing convection (–)
Vz Average velocity along the axis z (m/s) Vex Free volume of the extruder (m3)
W Channel width (m)
Z Zero matrix (–)
Greek symbols
!t Time interval (s)
!texp Experimental time of sampling (s) !y Height of a cell (m)
!z Length of a cell (m)
ρ Average density of the material (kg/s) µ Viscosity (Pa s)
1 Introduction
Extrusion is a process for converting a raw material into a product of uniform shape and density by forcing it through a calibrated orifice called a die under controlled con-ditions [1]. Material transport is achieved by one or two Archimedes screws rotating inside a barrel, where pressure, produced by the rotating screw, forces material flow through the die. Industrial applications of the polymer extrusion process date back to the 1930s. It has been extensively applied in thermoplastic, food and rubber industries. Recently, extrusion has proved to be a promising manufacturing process for polymer foam production with the use of CO2at supercritical conditions [2].
Several phenomena influence the characteristics of the final product and the global comprehension of extrusion is far from being reached [3]. Therefore, researches in this field can follow several directions [4,5]. One of them is the study of residence time distribution (RTD) of the matter under different operating conditions and its model-ling in order to understand and better control the material flow along the extruder and through the die.
A research study on this subject has been described by Yeh and Jaw [6], and Singh and Rizvi [7], where a model based on the combination of continuous stirred tank reac-tors exchanging with stagnant zones and plug flow reacreac-tors in series was proposed. This approach deals with the classical partial differential equation (PDE) describing mass transport with dispersion-convection mechanisms. Dispersion mechanism occurrence depends on the process modelled. In the reactor modelling theory, different solutions of the PDE using Laplace transformation can be used. Convection and dispersion are characterised by respectively v, the bulk mean velocity and D, the dispersion coeffi-cient. By considering v = 0 and D ̸= 0, an equation for a continuously stirred tank reactor can be obtained. On the contrary, if D = 0 and v ̸= 0, the equation applies to a plug flow reactor. Even if there is no analytical solution to this equation, this method allows fitting satisfactorily the experimental RTD data. However, models of this type bear some weaknesses. They cannot take into account extra phenomena without being drastically changed. They are difficult to apply when the dispersion and convection coefficients depend on concentration, temperature or pressure. In this case, it is neces-sary to get back to the original differential equations and to apply a numerical scheme to solve them.
More detailed research on polymer extrusion has been reported by Rauwendaal [1]. This author suggests that the velocity profile strongly depends on the phenomena occurring due to visco-elastic behaviour of the melt, pressure and temperature vari-ations. The extruder is divided into several phenomenological zones: solid transport, melting (or metering) and pumping zones. The analysis is given on the velocity profile evolution in each zone according to the process characteristics and material properties. This approach remains very physical but requires sophisticated experimental work to determine the process coefficients.
In addition, possibilities of making experimental study on what happens inside the different zones of the extruder are often limited. Moreover, the rheological behaviour of polymers is usually non-Newtonian, which makes tough the study of their flowing features [8]. Most often, only integral process characteristics can be measured (for
shown in Fig. 3. The probability to stay within a cell during a transition is equal to one minus the sum of the probabilities to leave the cell.
According to Fig.2, the transition matrix P11can be written as:
P11= ⎡ ⎢ ⎢ ⎢ ⎢ ⎢ ⎢ ⎣ 1− dy− dz− v1 dy 0 . . .0 0 dz+ v1 1− 2dy− dz− v2 dy . . .0 0 0 dz+ v2 1− 2dy− dz− v3 . . .0 0 . . . . 0 0 0 . . .1− 2dy− dz− vm−1 dy 0 0 0 . . .dz+ vm−1 1− dy − dz − vm ⎤ ⎥ ⎥ ⎥ ⎥ ⎥ ⎥ ⎦ (5) The same principle is implied for building other matrices Pii in accordance with the
scheme. The matrix of transition probability P12 is:
P12 = ⎡ ⎢ ⎢ ⎢ ⎢ ⎢ ⎢ ⎣ dz 0 0 . . . 0 0 0 dz 0 . . . 0 0 0 0 dz . . . 0 0 . . . . 0 0 0 . . . dz 0 0 0 0 . . . 0 dz ⎤ ⎥ ⎥ ⎥ ⎥ ⎥ ⎥ ⎦ (6)
The other matrices are constructed using this method. The elements on the main diag-onal of matrices Pii are calculated to keep the condition of normalisation, which
requires that the sum of all probabilities in each column of the matrix P should be 1. This approach is quite convenient but it is necessary to take care that no negative elements appear.
The velocity Vz (y) is different along the channel depth, and we can assign certain
value Vz(i)to each row of the cells. In order to define the distribution of Vz(i), the
following homographic function is taken:
Vz(y)= a· y + b
y + g (7)
To determine the coefficients a, b and g, any function can be used, according to the hydrodynamics theory for different flow regimes or experimental observations. The total mass flow rate can be defined as:
Q = ρ · W · H
) 0
V z(y)· dy (8)
where ρ is the average density of the material obtained by the following equation: ρ = M
vi = Vz(i)!t
!z (13)
According to the Fick’s first law, the relative part of mass transported by diffusion from one cell to another can be written for the corresponding axis as:
dz = D !t
!z2 (14)
dy = D !t
!y2 (15)
where D is the diffusion coefficient of the tracer into the polymer. We consider an isotropic diffusion, therefore D has the same value in both directions z and y.
The outflow can be calculated as a difference between the sum of states in the last column after j and j + 1 transitions, according to:
E( j)= mn , m(n−1)+1 -Skj+1− Skj. (16) Having the RTD, the mean residence time and variance can be easily calculated.
However, the set of data obtained from Eq. (16) must be adjusted to the set of exper-imental data. Usually, the calculation procedure gives the mass outflow after each tran-sition time, !t. The experimental curve gives the mass outflowing per time interval !texp(the time of collecting a sample), which is not equal to !t. Thus, the results can-not be compared directly and it is necessary to transform them to an identical time step.
3 Results and discussion
3.1 Experiments
The methods of experimentation as well as the experimental set up have been described in details by Nikitine et al. [12]. The polymer used for these experiments was Eudragit E100. First, the granules of polymer were introduced into the extruder hopper. As soon as a steady state regime was established, mean polymer mass flow rate and filling rate were measured by a mass balance. Then, a peak injection of a coloured tracer, eryth-rosine, was done at the inlet of the extruder. Then, the polymer flowing out at the die was cooled and cut every 10 s until the tracer disappearance. Afterwards, the samples obtained were dissolved in ethanol and the tracer concentration was determined by an UV-spectrophotometer. These experiments were made at different temperatures and screw rotation speeds.
3.2 Mass flow rate and velocity distribution in the channel
The first experimental results were obtained on the mass flow rate [12]. The total mass of polymer Eudragit E100 inside the extruder was 0.126 kg. The experiments on the
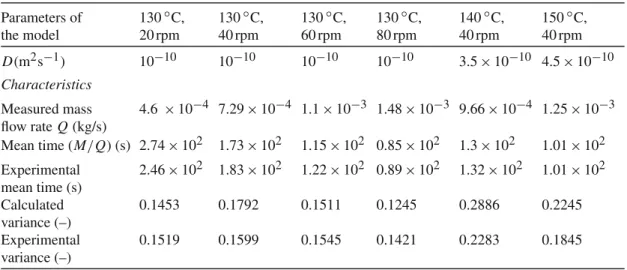
Table 3 Model parameters and characteristics (experiments with the die of 3 mm in diameter) Parameters of the model 130◦C, 20 rpm 130◦C, 40 rpm 130◦C, 60 rpm 130◦C, 80 rpm 140◦C, 40 rpm 150◦C, 40 rpm D(m2s−1) 10−10 10−10 10−10 10−10 3.5× 10⁻¹⁰ 4.5× 10⁻¹⁰ Characteristics Measured mass flow rate Q (kg/s) 4.6 × 10⁻⁴ 7.29× 10⁻⁴ 1.1× 10⁻³ 1.48× 10⁻³ 9.66× 10⁻⁴ 1.25× 10⁻³ Mean time (M/Q) (s) 2.74× 10² 1.73× 10² 1.15× 10² 0.85× 10² 1.3× 10² 1.01× 10² Experimental mean time (s) 2.46× 10² 1.83× 10² 1.22× 10² 0.89× 10² 1.32× 10² 1.01× 10² Calculated variance (–) 0.1453 0.1792 0.1511 0.1245 0.2886 0.2245 Experimental variance (–) 0.1519 0.1599 0.1545 0.1421 0.2283 0.1845
mass flow at different temperatures and different screw rotation speeds are shown in Table3. When the rotation speed or barrel temperature increased, the mass flow rate also increased, as expected. The viscosity of the polymer decreases at higher tem-peratures, which results in an enhanced mass flow rate. Higher rotation speed of the screw causes higher pressure gradients that also increase the mass flow rate. Knowing the total mass of material and the free internal volume of the extruder, 169.1 cm3, we could calculate the density of material, which is 745.08 kg/m3. The velocity distribu-tion in Eq. (7) with its mean values on the intervals, is calculated from the coefficients determination according to Eq. (10) and to the boundary conditions mentioned earlier. In addition, Rauwendaal [1] derived the coefficient r (throttle ratio) showing the influence of the process parameters on the velocity distribution of the conveying or pumping zone in the extruder:
r = H2
6µVz (17)
This ratio r compares the importance of the backward “Poiseuille” axial flow due to the pressure gradient to the forward shear flow due to velocity Vz. It means that, for
instance for r = 1/3, the forward flow is predominant all over the height of the chan-nel and, for r = 2/3, some backward flow is present near the screw while a forward flow exists near the barrel. This ratio may enlighten the relationships between flow characteristics. It comes from the model that r decreases with temperature, that may result from the fact that the down channel pressure gradient gz decreases faster than
the shear flow (µ, Vz).
3.3 Influence of the barrel temperature on RTD
Experimental residence time distribution can be represented using the following equa-tion:
!Eexp(t)= /!Mj
j!Mj
3.4 Influence of the screw rotation speed on RTD
Several RTD characteristics are shown in Fig.9for the temperature 130◦C at 20, 60 and 80 rpm respectively. The values of calculated parameters and characteristics are given in Table3. It was found that the diffusion coefficient D hardly depends on the rotation speed of the screw.
The evolution of the throttle ratio r in Eq. (17) is not so straight. Indeed, calcula-tions show two opposite tendencies with the increase of the screw rotation speed: the down channel pressure gradient gz increases and the viscosity µ diminishes (due to higher shear rates), which suggests that the Poiseuille backward flow increases, while the down channel velocity Vz increases.
The values of the mean residence time are the consequences of what has been men-tioned above: the increase in the screw rotation speed enhances mass flow rate and decreases viscosity (with higher shear rates) thus decreasing the mean residence time.
4 Conclusion and perspectives
Non-homogeneous crosswise velocity profile distribution of the flow in a single screw extruder has been taken into account by a new model developed on the basis of Markov chains. The volume of the extruder was represented as a two dimensional array of cells exchanging material mass with their neighbours. The model describes the transport of polymeric material along a horizontal extruder barrel and allows calculating con-centration and RTD at its outlet. The main feature of the model developed allows to link the transition probabilities with the physics of the process and, thus, the approach becomes more physical. The model can be also used to predict RTD characteristics within the experimental conditions domain without making additional experiments. Velocity distribution is closely related to the rheological properties of the material. Therefore, by knowing how changes in rheological properties may modify the velocity distribution, it becomes possible to study how the flow characteristics change.
The diffusion coefficient D is the only adjusting parameter of the model. It appeared that D does not depend on the screw rotation speed. An empirical correlation of D versus temperature was obtained. The model developed can potentially be applied to other flow processes where the velocity distribution is not homogeneous or where a backward flow may occur.
As prospect, the velocity distribution in different zones could be very interesting to measure. Modelling the heat exchange and phase transformations [13] is another track for the model development. This would require though a more sophisticated experimental set up to measure additional characteristics of the process.
Acknowledgments Authors acknowledge the financial support of the program GEMBIO from the Groupe
des Ecoles des Mines (France).
References
1. C. Rauwendaal, Polymer Extrusion, 4th edn (Hanser Publishers, München, 2001)
2. M. Sauceau, J. Fages, A. Common, C. Nikitine, E. Rodier, Prog. Polym. Sci. 36, 749 (2011) 3. S.-T. Lee, Foam Extrusion. Principles and Practice (CRC press, Boca Raton, 2000)
4. M. Sauceau, C. Nikitine, E. Rodier, J. Fages, J. Supercrit. Fluids 43, 367 (2007)
5. C. Nikitine, E. Rodier, M. Sauceau, J.-J. Letourneau, J. Fages, J. Appl. Polym. Sci. 115, 981 (2010) 6. A.-I. Yeh, Y.-M. Jaw, J. Food Eng. 35, 211 (1998)
7. B. Singh, S.H. Rizvi, J. Food Process Eng. 21, 91 (1998) 8. S.C. Kazarian, Polym. Sci. 42, 78 (2000)
9. A. Tamir, Applications of Markov chains in Chemical Engineering (Elsevier Science Publisher, Amster-dam, 1998)
10. H. Berthiaux, V. Mizonov, Can. J. Chem. Eng. 6, 143 (2004)
11. B. Vergnes, S. Puissant, in Techniques de l’Ingénieur, traité Plastiques et Composites AM 3 650, pp. 1–16 (2002)
12. C. Nikitine, E. Rodier, M. Sauceau, J. Fages, Chem. Eng. Res. Des. 87, 809 (2009) 13. V. Mizonov, H. Berthiaux, P. Arlabosse, D. Djerroud, Granul. Matter 10, 335 (2008)