Studying glass on metal: Raman analysis of medieval champlevé
enamelled objects
Stefan Röhrs1*, Gaia Fenoglio1,2, Ina Reiche1,3, Lothar Lambacher4
1 Rathgen-Forschungslabor, Staatliche Museen zu Berlin – Preußischer Kulturbesitz, Schloßstr. 1A,
14059 Berlin, Germany, *email: [email protected]
2 Dept. of Chemistry, University of Torino, Via Pietro Giuria, 7, 10125 Torino, Italy
3 PSL University, Institut de recherche de chimie Paris UMR 8247 CNRS, Centre de recherche et de
restauration des musées de France, 14 quai F. Mitterrand, 75001 Paris, France
4 Kunstgewerbemuseum, Staatliche Museen zu Berlin – Preußischer Kulturbesitz, Tiergartenstraße 6,
10785 Berlin, Germany
Abstract (300 words max)
Medieval champlevé enamelled objects are from copper sheets decorated with glass. The enamels were analysed by Raman spectroscopy to study the compositional differences in the glass matrix. Additional analyses were carried out by element analytical methods such µ-X-ray fluorescence analysis and environmental scanning electron microscopy with energy dispersive X-ray analysis. The two most frequently used glass types are mineral soda lime glass opacified with antimony
compounds and vegetal soda lime glass with a more significant addition of PbO, opacified with SnO2.
The enamel composition can succour the classification of the object regarding production time and place.
The wavenumber of the bending and stretching regions, δmax and max, and the polymerisation index
Ip were extracted from Raman spectra and results were interpreted with respect to the so-called
glass families from the literature. The two most frequently used glass types can be distinguished in the plot of Ip vs. max. For further differentiation, the Si-O stretching max against Si-O bending δmax
plot was exploited. This plot allowed a separation of glass types which superimposed in the plot of Ip
vs. max, such as mixed alkaline glass and soda lime glass with added PbO. The small spot size and
sensitivity of Raman analysis for lead and alkaline components allows to obtain complimentary data on compositional differences and heterogeneities of the glass matrix, which are difficult to detect by common laboratory micro-X-ray fluorescence analysis.
Keywords: Raman spectroscopy, émail champlevé, glass, medieval enamels, elemental analysis
Introduction
Medieval champlevé enamelled objects are made from copper decorated with colourful enamel work. The main production centres were in Limoges and the Rhenish / Mosan region. The enamel composition can give information about production time and place, and succours the classification of
the object. [1–4] Most of the medieval émaux champlevés are made of strongly coloured and
opacifyed soda lime silicate glass. Through the whole production time of émaux champlevé objects different glass types have been used for their making.[5] Most frequently, two sub-types of soda lime
glass are employed: mineral soda or plant ash soda. They can be distinguished by their differences in oxides of magnesium and potassium. For their use in enamels, differences in opacifier can be
observed too: antimony based opacifiers are mainly associated with mineral soda glass and tin oxide with plant ash soda glass. Additionally, the plant ash soda glass commonly has some added lead oxide. Red enamels vary strongly in composition, including high potassium contents. Energy
dispersive x-ray analytical methods are well-established for the elemental analysis of these types of objects, despite the challenge of accurate detection of alkaline elements. The opacifiers, which remain as crystalline phases in the glass are commonly characterized by Raman spectroscopy.[6–8] Our study will focus on the characterisation of the glass matrix by Raman spectroscopy. The enamels can contain large inclusions of crystalline material (e.g. recrystallized silicates and opacifier).
Therefore the enamels are heterogeneous material and partly glass ceramics[9].
The production of the enamels is believed to be a two-step process: production of the glass and manufacturing of the enamel. The characterization of the enamels leads therefore to information about the glass production technology/workshop and not about the enamel manufacturing workshop. Certain characteristics in the glass have be identified, which allow to distinguish enamel production of certain region e.g. Limoges or the Mosan/Rhenish area.[5,10,11] Further, it had been
demonstrated that the glass matrix of the enamels could also show some heterogeneities at larger scale: i.e. that one enamel field contains glass of different types probably due to the use of grains of crushed glass from different productions fused together.[12] Micro analytical tools, such as Raman
spectroscopy, are highly adapted for the characterisation of such individual glass grains in a non-destructive way and without requiring to introduce the object in an atmosphere of reduced pressure, as it is necessary for electron microscopic studies.
Spectra of typical glass families and their spectral components have been described in
literature.[8,13,14] The compositional differences between glass families are partially related to the
alkaline content that is difficult to detect by elemental analytical methods such as X-ray fluorescence analysis. The wavenumber of the bending and stretching regions, δmax and max as well as the
corresponding band areas, whose ratio (A500/A1000) gives the polymerisation index Ip, were extracted
from the Raman data.[15,16] Beside Raman spectroscopy, energy dispersive x-ray analysis (EDX) by
means of micro-x-ray fluorescence analysis (µ-XRF) and environmental scanning electron microscopy (ESEM) has been applied to a selection of medieval émail champlevé objects from the
Kunstgewerbemuseum, Staatliche Museen zu Berlin - Stiftung Preußischer Kulturbesitz (SMB-SPK). Analytical results of elemental and vibrational analyses from six objects (Figure 1, Table 1) are discussed together to evaluate the advantage of Raman spectroscopy as a method to study compositional differences of the glass matrix of émaux champlevé. The selected objects are
deliberately from different production centres, in order to observe the scale of variation in the glass matrix of the enamels. Most objects are parts of larger liturgical objects, only the incense holder K
4195 is a complete object dating to the 13th c. The incense holder underwent extensive
re-enamelling with enamel from industrial raw materials in the early to mid-19th c. More in depth
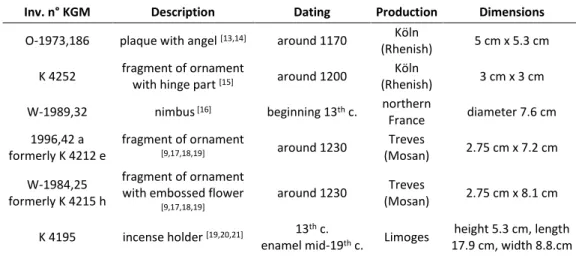
Figure 1: Six studied émail champlevé objects from the Kunstgewerbemuseum SMB-SPK, with their inventory numbers, objects not to scale, dimension are given in Table 1
Table 1: Object information on the six studied émail champlevé objects from the Kunstgewerbemuseum SMB-SPK
Inv. n° KGM Description Dating Production Dimensions
O-1973,186 plaque with angel [13,14] around 1170 Köln
(Rhenish) 5 cm x 5.3 cm K 4252 fragment of ornament
with hinge part [15] around 1200
Köln
(Rhenish) 3 cm x 3 cm W-1989,32 nimbus [16] beginning 13th c. northern
France diameter 7.6 cm 1996,42 a formerly K 4212 e fragment of ornament [9,17,18,19] around 1230 Treves (Mosan) 2.75 cm x 7.2 cm W-1984,25 formerly K 4215 h fragment of ornament with embossed flower
[9,17,18,19]
around 1230 Treves
(Mosan) 2.75 cm x 8.1 cm K 4195 incense holder [19,20,21] 13th c.
enamel mid-19th c. Limoges
height 5.3 cm, length 17.9 cm, width 8.8.cm
Instrumental Methods
A Horiba XploRa Micro-Raman, equipped with a 532 nm, 638 nm and 785 nm laser was used for the investigations. The laser power can be controlled using different filters and the spectral resolution is managed through different gratings. Spectra from the objects were acquired using a 532 nm laser with a maximum power of 15 mW @ sample, 500 µm confocal hole, 100 µm slit, 1800 lines/mm grating. The frequency range of approximately 100 cm-1 to 1700 cm-1 was recorded without
movement of the monochromator. The measuring time and number of accumulations was 5 times 5-25 s for crystalline phases characterization and 5 times 5-25 s for the glass matrix. The spatial
resolution is approximately 4 µm in the plane of the sample surface using the 50x long working distance objective. Wavenumber scale calibration was carried out using a Si standard (520.5 cm−1).
Measurements were performed using two different instrument configurations. Flat artifacts were analysed with traditional microscope Raman arrangement, the samples being allocated under the vertical laser beam. incense holder K 4195 was instead analysed using an horizontal laser beam arrangement that allows measuring large objects that do not fit on the traditional microscope sample stage. [26] All data acquisition spectra analysis, i.e. the background subtraction and peak
fitting, was performed with NGSLabspec Software. The spectra were treated with the “HORIBA ICS” intensity correction, which uses factors determined for our individual spectrometer to correct for variations in detector intensities.
Micro-X-ray fluorescence analysis (µ-XRF) was performed using a Bruker ARTAX spectrometer equipped with a Mo target and SDD detector. Measurements were collected for 100 s life-time and with a tube setting of 45 kV voltage and 500 μA current. No attenuator was used, and the beam path was He fluxed. The X-rays were focussed by a polycapillary to a 70 µm to 100 µm spot, depending on the X-ray energy. The working distance was about 10 mm. The instrument has an XYZ motorized head and a camera-laser system for sample positioning. Processing of the X-ray spectra was performed using WinAxil Software from IAEA [27] and quantitative data was obtained with WinFund
module using reference materials. These references included Corning reference glasses (A, B, C and D), produced to be used in historical glass studies[28,29] , two soda-lime glasses (NSM 610, SGT11) and
two Pb-bearing standards (CRM-CZ-400 and SRM 89). The reference materials to be used in the calibration were carefully chosen to accurately predict matrix effects of the different typologies of glass matrix. Most quantitative data reports are averages of several measurements of the same enamel field or colour. The data given in Table 2 is not normalized to 100 %, but the sum of the results is given. The residue to 100 % can be related to not detectable components such as Na2O.
Further micro-analytical analysis was carried out by environmental scanning electron microscopy (ESEM) with energy dispersive X-ray detection (EDX) using a Quanta 200 from FEI. The electron beam is produced by a wolfram cathode at an acceleration voltage of 25 keV. For the analysis of the objects, the sample chamber was set to an atmosphere of 100 Pa water vapour. The ESEM images shown in this article represent backscattered electrons (BSE) and show electron density distribution of the material. The energy dispersive X-ray analyser X Flash 4010 from Bruker detected the x-rays emitted from the sample. The quantitative calculations were carried out by the Esprit Software V1.9 using a PhiRohZ-Method with additional standards (ASTIMEX mineral standards) for optimization of the analytical results.
Raman spectra analysis
The multi-step procedure to treat the raw spectra and obtain Raman spectral data includes a number of operator-dependant passages. For this reason, in order to produce comparable data, it is
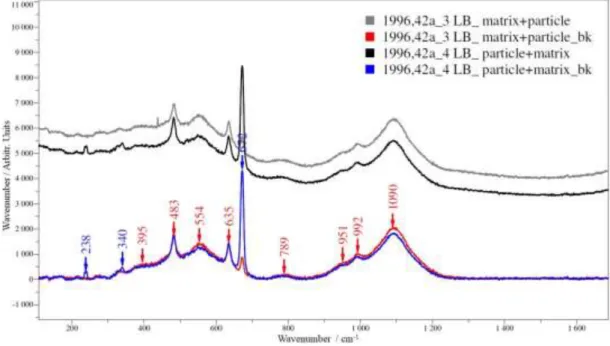
fundamental to follow a standardised spectra processing. All spectra underwent background and Boson peak subtraction using a linear baseline with attach points at about ~200, ~700, ~800/850 and 1300 cm-1 (Figure 2).[30] However, despite the use of a standardised approach, several aspects can
interfere. The most relevant is the shape and intensity of the fluorescence interference signal. Its subtraction, especially when working on a spectrum collected on a glassy matrix, is not a
straightforward passage. We have noticed, that already slight variation in attach points (i.e. first point at 300 cm-1 instead of 200 cm-1) for background subtraction resulted in differences in the
absolute Ip value.[25]The background subtraction can induce a modification of the Ip estimate, thus
literature is suggesting to use this parameter in a relative rather than absolute way.[8,31] Because of
the difficulties, our values for the Ip show some variation from the values reported in the literature.
However, for studying the glass matrix, the spectral contributions of the crystalline phases from opacifying and colouring agents or unreacted raw ingredients are an obstacle. This is particularly difficult in the study of opaque enamels, which namely contain a high amount of opacifier and colorants. These comparably sharp signals of crystalline phases need to be recognised since they superimpose with the Raman signal of the silica network. The spectra used for the decomposition and evaluation of the spectral components are those with the least contribution of the crystalline phases. Some examples for the variance between the spectral contribution of glass matrix and crystalline phases are shown in Figure 2. The decomposition of the stretching and bending massifs followed the model proposed by Robinet et al. for both alkali and lead-alkali glass.[14] Attribution of
crystalline phases was made upon comparison with literature data and on-line databases.[32,33]
Figure 2: Raman spectra various amounts of crystalline components from light blue enamels of object 1996,42 a, in black with strong signals from CaSb2O6 and Ca2Sb2O7 and in grey with less
Results and discussion
The spectral components extracted from the Raman spectra are listed in Table S1. For a first evaluation of the data, the polymerisation index Ip is plotted as function of the wavenumber of the
Si-O stretching signal max (Figure 3) and the data is compared to the glass families reported in the
literature. [8,13,15,34] A large number of data points from the enamels fall into the proximity of so-called
“Na2O+K2O+CaO” glass family. This glass family corresponds to soda lime glass, which has small
amount of K2O. This is the general glass type used for many émail champlevé (see [5] and analytical
values in Table 2). However, our data points have little lower Ip values compared to the literature
data. Most data points from the plaque with angel (O-1973,186), ornament with hinge part (K 4252) and from the two Treves ornaments (1996,42 a and W-1984,25) fall into an area of Ip values lower
than 0.9 and a max value of 1080 and 1100 cm-1. As a reference, we measured the Corning glasses (A
and B), which are made to be similar to antique soda lime glass. Particularly glass B, which is in composition close to Roman glass, historically made with mineral soda, shows Ip and max values
superimposing with this large group of data points obtained from the enamels.
Ip values from Roman glass comparable to ours were reported in the thesis of Ricciardi[34] measured
on Roman mosaic glass, which is very close in composition to the glass of the enamels[35]. Ricciardi
used different Raman spectrometers and observed that, depending on the equipment used, the Ip
value can be different. In her work, the values measured with the Dilor XY2 instrument (406.7 nm, double monochromator filter) gave an average of 0.68 ± 0.12, whereas the results from the Labram Infinity spectrometer (532 nm, notch filter) gave an Ip value average of 1.24 ± 0.25 for the same
samples.
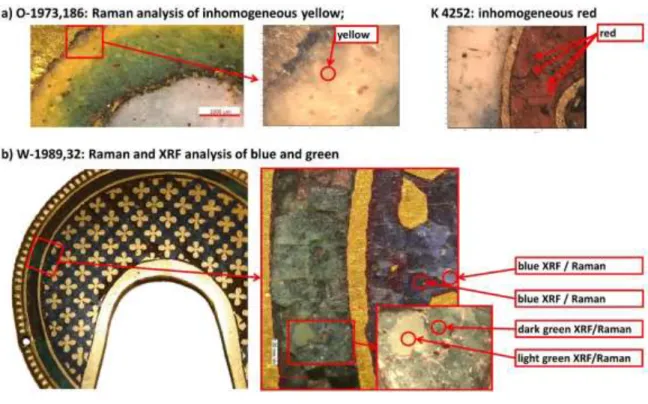
On the plaque with angel (O-1973,186) the enamels (except red) are made of mineral soda lime glass and are opacifyed with antimonate compounds as µ-XRF analysis suggests (Table 2). The Raman data of white and blue falls into the range of the Corning B glass (with the exception of one light blue data point), while green and yellow are at lower Ip values (Figure 3a). The results from green enamel
shows the largest variation, suggesting a heterogeneous composition. Raman identified bindhemite (PbSb2O7) as opacifier in the green and the yellow enamel. It is possible that partially dissolved
bindhemite has locally changed the glass network by increasing the lead content and inducing a lower Ip value. µ-XRF analysis had shown that colours yellow and green are higher in PbO content,
with values of 8.5 % and 3.3 % respectively. The volume investigated with the µ-XRF is significantly larger than the Raman analytical volume, hence the compositional information of µ-XRF includes glass matrix and opacifying particles in different proportions as compared to Raman analysis. The lead content of 8.5 % in the yellow should have affected the Raman spectrum more strongly and data points much closer to the “PbO-Na2O” family, with lower max values, would have been
expected. The selection of the analytical spot for the Raman analysis may play a role in this. In order to collect a spectrum from the glass matrix and avoiding spectral components from crystalline opacifier, transparent zones were selected (see Figure 4a). These zones containing less PbSb2O7 and
might be different in composition from the zones analysed by µ-XRF. The red has a composition with high K2O (16.8 %) and CaO (13.8 %) content (Table 2). This type of red glass used in Rhenish and
Mosan enamels has typically low Na2O content, a value of 1.35 % is given for Rhenish enamels by
Biron and Beauchoux.[1] The composition of the red glass would fit to the glass family “CaO+K 2O”
form the literature, but our values are at somewhat lower in max (at 1056 cm-1to 1068 cm-1 Figure 3).
Data points from the ornament with hinge part (K 4252) form two cluster in the proximity of the “Na2O+K2O-CaO” and “K2O+CaO” families. Red and turquoise fall into both clusters. The red glass has
a lower K2O content compared to the red from the plaque with angel (Table 2). Some reds fall
other reds, turquoise and yellow have lower Ip values, roughly between 0.4 and 0.6. We believe that,
the two clusters of red and turquoise relate to the inhomogeneity of the material. For the red more strongly opaque or transparent areas can be observed (Figure 4a). The colouring mechanism of this red glass is not confirmed,[5] but the red might contain cuprite or metallic copper nano particles or
both. The Cu° nano particles have an effect on the observed IP value and makes the attribution to
glass families unreliable.[36] Some measurements might be more affected by this effect than others,
due to the variation in the content of the colorant. For the turquoise, the compositional information from the µ-XRF did not indicate two types of turquoise, but the presence of 0.6 % SnO2 and 2.0 %
Sb2O3 might indicate some sort of mixed glass. The yellow is again high in PbO (11.7 %) and the falls
in the same area of the lower Ip values.
In the Ip versus max graph (Figure 3c), six (of seven) measurements on green and blue from the
nimbus (W-1989,32) fall in-between the “Na2O+K2O-CaO” and “K2O+CaO” families, and are not
superimposing with the data points from the other enamels. The max stretching values up to 1100
cm-1 are the highest values measured for soda lime glass in our study. The nimbus has lost its enamel
in some areas, indicating difficulties with the preservation state. The visual aspect of the enamels from the nimbus is heterogeneous (Figure 4b). Two measurement of a lighter shade of green gave different results, for Raman as well as µ-XRF. The light green has lower max stretching values. The
elemental analysis indicates that the light green contains more PbO and SnO2. Possibly, the high PbO
content of about 10 % is the reason for the difference in Raman response, which would be consistent with the data point being close to the “PbO” and “Na2O+PbO” families. It is interesting to note, that
other compositions with similar PbO content, do not show the same Raman response.
The data from the Treves ornament (1996,42 a) forms also two clusters similar to K 4252. Blue and light blue are in the area of Corning glass B. The blues are of a soda lime glass composition with only little addition of PbO (blue 1.3 % PbO, light blue 1.5 % PbO). The opacifying components used are mainly antimony-based. This is consistent with the position of the corresponding Raman data points. The other group contains the red, white and turquoise glass. µ-XRF data shows that they are of a different composition. The white and the turquoise are from vegetal soda ash and contain large amount of PbO, between 14 % to 17 %. For both ornament from Treves additional analytical data by ESEM-EDX was obtained for complimentary micro-analytical information (Table S2). The principal inhomogeneity of the enamels relates to the inclusion of the crystalline opacifier. ESEM-EDX and µ-XRF data show that white and turquoise colours are close in composition: with high lead and tin opacifier (overall 15.6 % and 15.6 % PbO, 9.9 % and 8.3 % SnO2 respectively). The visual aspect and
the BSE images of these colours is alike, a homogeneous matrix with opacifier’s inclusions. For both colours, the opacifier is cassiterite (SnO2) as determined by Raman spectroscopy. The EDX analysis of
the opacifier shows high SnO2 values plus some compositional contribution from the glass, including
some PbO (Table S2). The Raman signal from the glass can therefore be attributed to the glass with a PbO content of 14 % to 17 %. The data from these two colours also falls into the proximity of the red, which is of a different composition. For the blue and light blue the back scattered electron images show some minimal differences in contrast of the matrix (Figure 4c). Some of these areas were investigated quantitatively, but only negligible variation in composition for the blue and light blue were found by ESEM-EDX, which do not significantly influence the Raman results. Raman data of the red superimposes with the data of the red from ornament with hinge part (K 4252), but as mentioned above the Ip might be affected by Cu nanoparticles. Also, the compositions given by
µ-XRF are similar and correspond to a mixed alkaline glass with soda and potash.
The data from the second Treves ornament (W-1984,25) formed two clusters as well, very similar to the ornament with the hinge part (K 4252) and the other Treves ornament (1996,42 a). Data points of the colours blue, light blue, green and some points from the turquoise corresponds to soda lime
glass similar to the Corning glass B. This green is the only green falling close to the Corning B. It has 4.4 % PbO and Pb2Sb2O7 had been identified as opacifier, but the µ-XRF also shows SnO2. The second
cluster contains white and turquoise. The evaluation of these enamels by ESEM-EDX indicates that the turquoise enamels were produced by mixing two different types of glass (Figure 4d and Table S2). The first is a soda lime glass with mineral soda and opacified with calcium antimonates, whereas the second is a soda lime glass with PbO, produced with plant ash soda, and opacified with
cassiterite (SnO2). The white enamels are only made of this second glass type.
Finally, the incense holder K 4195 from the 13th c. with its enamel probably dating to the early to
mid-19th c was measured. [25] The high PbO post-medieval glass from K 4195 clearly clusters
separately from the soda lime glass. The data points of the red fall into the region of the high PbO glass family. The colours blue and turquoise from K 4195 with high As2O3 content are affected by the
Figure 3: Polymerisation index as function of wavenumber of main Si-O stretching component; areas of glass families according to literature [8,13,15,34] in grey, area of the Corning glasses A and B in red.
Legend for colour labels R: red, Y: yellow, G: green, LT: light turquoise, T: turquoise, DB: dark blue, B: blue, LB, light blue, W: white, Tr: transparent
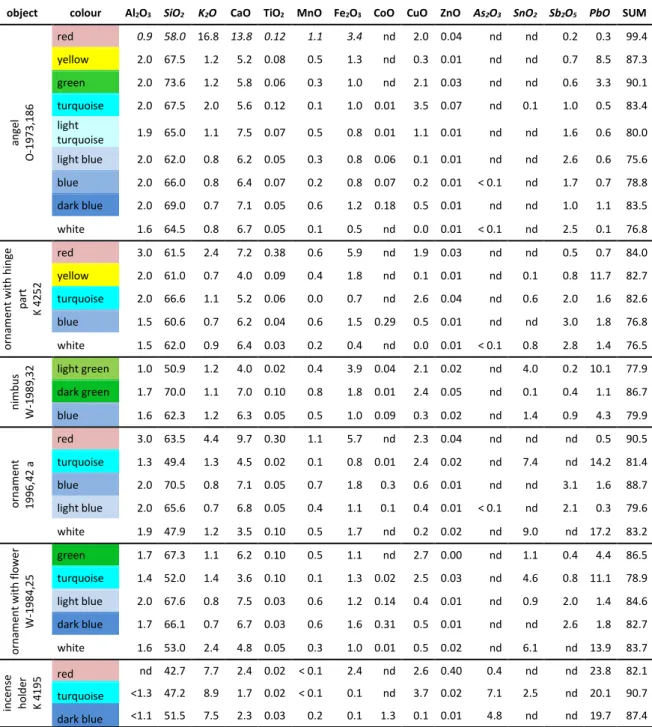
Table 2: µ-XRF compositions of the enamels as analysed by µ-XRF in wt%.
object colour Al2O3 SiO2 K2O CaO TiO2 MnO Fe2O3 CoO CuO ZnO As2O3 SnO2 Sb2O5 PbO SUM
an ge l O -1973 ,186 red 0.9 58.0 16.8 13.8 0.12 1.1 3.4 nd 2.0 0.04 nd nd 0.2 0.3 99.4 yellow 2.0 67.5 1.2 5.2 0.08 0.5 1.3 nd 0.3 0.01 nd nd 0.7 8.5 87.3 green 2.0 73.6 1.2 5.8 0.06 0.3 1.0 nd 2.1 0.03 nd nd 0.6 3.3 90.1 turquoise 2.0 67.5 2.0 5.6 0.12 0.1 1.0 0.01 3.5 0.07 nd 0.1 1.0 0.5 83.4 light turquoise 1.9 65.0 1.1 7.5 0.07 0.5 0.8 0.01 1.1 0.01 nd nd 1.6 0.6 80.0 light blue 2.0 62.0 0.8 6.2 0.05 0.3 0.8 0.06 0.1 0.01 nd nd 2.6 0.6 75.6 blue 2.0 66.0 0.8 6.4 0.07 0.2 0.8 0.07 0.2 0.01 < 0.1 nd 1.7 0.7 78.8 dark blue 2.0 69.0 0.7 7.1 0.05 0.6 1.2 0.18 0.5 0.01 nd nd 1.0 1.1 83.5 white 1.6 64.5 0.8 6.7 0.05 0.1 0.5 nd 0.0 0.01 < 0.1 nd 2.5 0.1 76.8 o rna m ent wi th hi ng e pa rt K 4252 red 3.0 61.5 2.4 7.2 0.38 0.6 5.9 nd 1.9 0.03 nd nd 0.5 0.7 84.0 yellow 2.0 61.0 0.7 4.0 0.09 0.4 1.8 nd 0.1 0.01 nd 0.1 0.8 11.7 82.7 turquoise 2.0 66.6 1.1 5.2 0.06 0.0 0.7 nd 2.6 0.04 nd 0.6 2.0 1.6 82.6 blue 1.5 60.6 0.7 6.2 0.04 0.6 1.5 0.29 0.5 0.01 nd nd 3.0 1.8 76.8 white 1.5 62.0 0.9 6.4 0.03 0.2 0.4 nd 0.0 0.01 < 0.1 0.8 2.8 1.4 76.5 ni m bu s W -1 989, 32 light green 1.0 50.9 1.2 4.0 0.02 0.4 3.9 0.04 2.1 0.02 nd 4.0 0.2 10.1 77.9 dark green 1.7 70.0 1.1 7.0 0.10 0.8 1.8 0.01 2.4 0.05 nd 0.1 0.4 1.1 86.7 blue 1.6 62.3 1.2 6.3 0.05 0.5 1.0 0.09 0.3 0.02 nd 1.4 0.9 4.3 79.9 o rna m ent 1996, 42 a red 3.0 63.5 4.4 9.7 0.30 1.1 5.7 nd 2.3 0.04 nd nd nd 0.5 90.5 turquoise 1.3 49.4 1.3 4.5 0.02 0.1 0.8 0.01 2.4 0.02 nd 7.4 nd 14.2 81.4 blue 2.0 70.5 0.8 7.1 0.05 0.7 1.8 0.3 0.6 0.01 nd nd 3.1 1.6 88.7 light blue 2.0 65.6 0.7 6.8 0.05 0.4 1.1 0.1 0.4 0.01 < 0.1 nd 2.1 0.3 79.6 white 1.9 47.9 1.2 3.5 0.10 0.5 1.7 nd 0.2 0.02 nd 9.0 nd 17.2 83.2 o rna m ent wi th fl o we r W -1 984, 25 green 1.7 67.3 1.1 6.2 0.10 0.5 1.1 nd 2.7 0.00 nd 1.1 0.4 4.4 86.5 turquoise 1.4 52.0 1.4 3.6 0.10 0.1 1.3 0.02 2.5 0.03 nd 4.6 0.8 11.1 78.9 light blue 2.0 67.6 0.8 7.5 0.03 0.6 1.2 0.14 0.4 0.01 nd 0.9 2.0 1.4 84.6 dark blue 1.7 66.1 0.7 6.7 0.03 0.6 1.6 0.31 0.5 0.01 nd nd 2.6 1.8 82.7 white 1.6 53.0 2.4 4.8 0.05 0.3 1.0 0.01 0.5 0.02 nd 6.1 nd 13.9 83.7 inc ens e ho lde r K 4195 red nd 42.7 7.7 2.4 0.02 < 0.1 2.4 nd 2.6 0.40 0.4 nd nd 23.8 82.1 turquoise <1.3 47.2 8.9 1.7 0.02 < 0.1 0.1 nd 3.7 0.02 7.1 2.5 nd 20.1 90.7 dark blue <1.1 51.5 7.5 2.3 0.03 0.2 0.1 1.3 0.1 0.01 4.8 nd nd 19.7 87.4
Figure 4: a) Raman spots analysed on the fragment with angel O-1973,186 and ornament with hinge K
4252 b) nimbus W-1989,32 by µ-XRF and Raman, c) Treves ornament 1996,42 a by ESEM-EDX and d)
Most Raman results from the enamels could be related to compositional groups using the plot of Ip as
function of Si-O stretching max. Enamels made of soda lime glass with mineral soda, with up to 10 %
PbO and antimony opacifier were comparable to the Raman response of Corning B glass (approximately Ip value 0.7 to 0.9 and a max value of 1080 and 1100 cm-1). Soda lime glass enamels
with higher PbO content (> 11 %) and opacified with SnO2 have lower Ip values, but do not fall close to
the PbO-rich glass family. This type of glass made by soda lime glass from plant soda ash was present in the turquoise and white enamels from the two Treves ornaments (1996,42 a, and W-1984,25). The yellow enamel of the ornament with hinge part (K 4252) belongs to this group with high PbO, although it is antimony opacified mineral soda lime glass. These materials gave all similar Raman responses with data in the zone of an Ip value approximately 0.3 to 0.6 and a max value of 1070 cm-1 to 1080 cm-1.
Some measurements of the turquoise of the ornament (K 4252, antimony opacified mineral soda lime glass) fall into this group too, despite a low PbO content obtained by µ-XRF, probably because of material inhomogeneity.
The green enamels showed the larges variation in results. The Raman data points from green on the plaque with angel (O-1973,186) and the nimbus (W-1989,32) are spreading further compared to other colours, including Raman responses of Pb-rich glass. This is interesting to note, because Raman data from other enamel colours with similar composition, including composition with PbO contents as high as 17 % PbO, seem to cluster in two groups mentioned above. This indicates that possibly other parameters, such as thermal history, preservation state of the glass or finely dispersed colorants and opacifier might influence the spectral components.
To further investigate the most recurrent type of matrix, namely the group of the soda lime glass, the Si-O stretching max was plotted against Si-O bending δmax. An overview is given in the Figure 5a with
data on glass families from[13,31,37–39]. Lead containing glass, potassium rich glass, soda lime glass and
mixed alkaline glass can easily be distinguished. The red enamel of the angel is of a potassium rich glass. PbO-rich glass had been detected in the red of the incense holder and the green of the nimbus. The colours blue and turquoise from K 4195 with high As2O3 content plot similar to data reported from
the high As2O3 glass from glass beads.[37]
In Figure 5b only the results from the soda lime glass and mixed alkaline glass are shown. In the upper half of the graph (max >1088 cm-1) cluster the majority of soda lime glasses with PbO < 5 %. In this
zone are also the two Corning glasses A & B. Most of these enamels are opacified by antimony compounds but some are with SnO2 or contain both. The soda lime glass with higher PbO content
clusters at lower max values. It is worth noting, that this group includes also composition with up to
17 % PbO. The red mixed alkaline glass (mixed alkaline Cu), which superimposed with the soda lime glass with added PbO (soda lime+PbO) in Figure 3 can here be differentiated by higher Si-O bending δmax wavenumbers.
A differentiation of the soda lime glass from mineral soda or vegetal soda is not possible,[40] despite
the observed difference between Corning A (vegetal soda ash) and Corning B (mineral soda). Plant ash soda glass with low PbO had been identified from the Treves ornament W-1984,25 turquoise “zone 1” by ESEM-EDX (data points of soda lime Sn labelled as “zone 1” in Figure 5b, with 4.2 % K2O,
4.4 % PbO opacified with mainly 1.9 % SnO2 and antimony compounds 1.4 % Sb2O3). The data from
this glass is not separating from the other glasses made by mineral soda (data points labelled soda lime Sb).
Figure 5: Maximum wavenumber of Si-O stretching as function of Si-O bending a) all experimental data from Table S1, ovals indicate glass families from the literature [13,31,37–39] , soda lime glass with a PbO content above 5 % is labelled with “+PbO”; b) detailed plot of soda lime and mixed alkaline glass, the elements Cu, Sn or Sb indicate the opacifier
Conclusions
The analysis of medieval enamels by Raman spectroscopy is a non-destructive method
complimentary to other non-destructive methods such as x-ray analytical methods. Raman gives information that allows identification of compositional differences in the matrix such as PbO content and alkaline components.
The spectral components used for glass matrix identification are not only affected by the composition but also by several other factors, such as crystalline components, background subtraction and the analytical instrument. These factors might interfere with the extraction of spectral data, in particular the Ip. Additionally, the matrices observed in enamels are complex glass
ceramics and their data is not always imposable to the compositional glass families indicated in the literature. To ensure the comparability of the results, a reliable and reproducible methodology for background subtraction for determination of the peak areas is required, and reference materials such as the Corning glass should be linked to glass families in order to ensure the comparability of the results between laboratories using different equipment.
Differentiation of the two historically important glass types plant ash and mineral soda lime glass is not possible. For the analysis of the champlevé enamel from various production sides the possibility to differentiate certain glass types is of interest. Both plots, the Ip vs. max and max vs. δmax are worth
to be exploited. Soda lime glass with SnO2 and addition of more than 5 % PbO can be differentiated
from the low PbO soda lime glass by a significant difference in Ip. The plot max vs. δmax allows a
differentiation of the principal glass families: PbO-rich, potassium-rich and lead arsenate in high PbO, although the data points from the enamels are not perfectly matching the literature data (Figure 5a). Within the cluster of soda lime and mixed alkaline glass further separations are possible (Figure 5b). The mixed alkaline and soda lime glass with higher PbO (5 % to 17 % PbO) content cluster at lower
max values and can themselves be discriminated by their difference in δmax. This soda lime glass with
high PbO content does not fall into the area of the PbO-rich glass family.
The observed occasional outliers from the expected pattern of the glass families may be partially related to the heterogeneity of the enamels. The heterogeneity may affect the comparability of compositional data on enamels by µ-XRF to the Raman results, since the µ-XRF gives the average over a larger area (e.g. including the crystalline opacifier) whereas the Raman analyses for identification of the glass matrix aim to sample small areas of pure glass matrix with only minimal crystalline components. This heterogeneity detected by Raman spectroscopy can potentially be used to further characterise the enamels material to identify patters which can be related to workshop practice of mixing or processing the different glass material. An aspect introducing some uncertainty is the effect of colorants, impurities or components from the opacifier, dissolved into the glass matrix on the Raman spectra. Further work on the glass families and investigations on how a heavily charged glass ceramic influences the spectral components is needed to make full use of the
sensitivity of Raman spectroscopy for the investigation of the glass matrix of enamels.
Acknowledgements
We owe thanks to M. Torge and I. Feldmann from the Fachbereich 4.2 of the Bundesanstalt für Materialforschung und -prüfung, Berlin for the use of their reference materials. We are also most grateful to A. Agostino for providing WinAxil software and for his support and recommendations in producing µ-XRF quantitative data. We thank the Förderkreis des Rathgen-Forschungslabors e.V. for the financial support through the Rathgen Heritage Scholarship 2015. Finally, we would like to thank
the IPERION-CH project funded by the European Commission, H2020-INFRAIA-2014-2015, under Grant No. 654028 for providing an additional possibility to consult analytical data via the access platform ARCHLAB.
![Figure 3: Polymerisation index as function of wavenumber of main Si-O stretching component; areas of glass families according to literature [8,13,15,34] in grey, area of the Corning glasses A and B in red](https://thumb-eu.123doks.com/thumbv2/123doknet/7766564.256062/9.892.146.434.115.637/polymerisation-function-wavenumber-stretching-component-families-according-literature.webp)
![Figure 5: Maximum wavenumber of Si-O stretching as function of Si-O bending a) all experimental data from Table S1, ovals indicate glass families from the literature [13,31,37–39 ] , soda lime glass with a PbO content above 5 % is labelled with “+PbO”;](https://thumb-eu.123doks.com/thumbv2/123doknet/7766564.256062/13.892.154.722.128.554/maximum-wavenumber-stretching-function-experimental-indicate-families-literature.webp)
