HAL Id: hal-00546296
https://hal.archives-ouvertes.fr/hal-00546296
Preprint submitted on 14 Dec 2010
HAL is a multi-disciplinary open access
archive for the deposit and dissemination of sci-entific research documents, whether they are pub-lished or not. The documents may come from teaching and research institutions in France or abroad, or from public or private research centers.
L’archive ouverte pluridisciplinaire HAL, est destinée au dépôt et à la diffusion de documents scientifiques de niveau recherche, publiés ou non, émanant des établissements d’enseignement et de recherche français ou étrangers, des laboratoires publics ou privés.
Albania: Do remittances matter?
Laetitia Duval, François-Charles Wolff
To cite this version:
Laetitia Duval, François-Charles Wolff. Longitudinal evidence on financial expectations in Albania: Do remittances matter?. 2010. �hal-00546296�
EA 4272
Longitudinal evidence on financial
expectations in Albania:
Do remittances matter?
Laetitia Duval (*)
François-Charles Wolff (**)
2010/31
(*) GERCIE – Université de Tours (**) LEMNA - Université de Nantes
Laboratoire d’Economie et de Management Nantes-Atlantique Université de Nantes
Chemin de la Censive du Tertre – BP 52231 44322 Nantes cedex 3 – France
www.univ-nantes.fr/iemn-iae/recherche Tél. +33 (0)2 40 14 17 19 – Fax +33 (0)2 40 14 17 49
D
o
cu
m
en
t
d
e
T
ra
va
il
W
o
rk
in
g
P
ap
er
Longitudinal evidence on financial expectations in
Albania: Do remittances matter?
#Laetitia Duval
*François-Charles Wolff
**October 2010
Abstract: This paper focuses on the role of remittances on financial expectations in Albania
using longitudinal data covering the period 2002-2004. To study the dynamics of income satisfaction at the household level, we use subjective data on past, current and future financial situations and estimate random and fixed effect ordered Probit models. We find that households are more optimistic about the future when they have experienced an improvement in their financial situation in the past and when they have received private transfers from foreign countries.
JEL Classification: D10, I32, 015
Keywords: Albania, income expectations, longitudinal data, remittances
#
We are indebted to José de Sousa, Frédéric Docquier, Yao Lu, Andrea Mitrut, El Mouhoub Mouhoud, Henry Ohlsson, Claudia Senik, Sy Spilerman, Fabien Tripier for their very helpful comments and numerous suggestions on a previous draft. We have also benefited from the comments of participants at the 25ème Journée de Microéconomie Appliquée (La Réunion), the GRD Economie du Développement et de la Transition (CERDI, Clermont-Ferrand), the LEMNA seminar (Nantes), the DIAL seminar (Paris), the Center for the Study of Wealth and Inequality seminar at Columbia University and the seminar in Public Economics at Uppsala University. Any remaining errors are ours.
*
GERCIE, Université de Tours, France. E-mail: laetitia.duval@univ-tours.fr
**
Corresponding author. LEMNA, Université de Nantes; CNAV and INED, Paris, France. E-mail: francois.wolff@univ-nantes.fr http://www.sc-eco.univ-nantes.fr/~fcwolff
1. Introduction
Financial expectations of households play a central role in many economic fields. They are expected to influence decisions on consumption, savings, portfolio choice, labor supply, education or fertility, amongst others. For instance, wage offer distribution expectations are likely to influence labor supply decisions (Dominitz, 1998). Elicitation of income expectations is needed to better understand choices to invest in human capital since expectations will affect returns to schooling (Dominitz and Manski, 1996). Life-cycle models which explore intertemporal consumption and savings behavior are also driven by future income expectations.
Since expectations matter in many fields of economics, one would expect economists working on household behaviors to have widely documented the formation of expectations. This information appears extremely useful for policy makers as the latter could better account for the impact of various economic policies on consumption or savings. Are particular groups of individuals subject to more optimistic or pessimistic expectations with respect to their financial situation in the future ? Are their predictions relevant when comparing them to realizations ? Curiously, the corresponding empirical literature remains scarce.
In developed countries, very few studies have attempted to explore the determining factors of individual expectations or to understand their formation, Brown and Taylor (2006) for the United Kingdom and Das and van Soest (1997, 1999) for the Netherlands being insightful exceptions. In developing and transitional countries where economic uncertainty may have more harmful consequences since people face very low standards of livings, the topic has also been little explored. In both cases, an explanation of the lack of empirical evidence is undoubtedly related to the scarcity of microeconomic data measuring individual expectations1. Previous micro-econometric studies which have attempted to investigate the formation of expectations among households have essentially focused on the two following aspects.
On the one hand, some authors have investigated how individuals formed their income expectations. While it is commonly assumed that they are rational, Das and van Soest (1999) focus on expectation formation by comparing expected and realized changes in financial situation using panel data on Dutch households. They show that the hypothesis of rational expectations is rejected in the Netherlands. On the other hand, a few studies have examined the impact of financial expectations on individual decisions. In Italy, Guiso et alii (1996) find
1
As pointed in Dominitz and Manski (1997), another difficulty is that economists tend to be skeptical about the use of survey data to study expectations through subjective questions.
that future borrowing constraint expectations induce individuals to keep a lower proportion of their wealth in the form of risky assets.
In this paper, we use subjective information about past, current and future financial situations in Albania using longitudinal data to study the dynamics of income changes. Our study then draws on the influential contributions of Das and van Soest (1997, 1999), whose primary aim was to understand household income growth in the Netherlands using subjective information2. With respect to these authors, we focus more closely on the role of the composition of household resources and especially remittances on financial expectations. In the context of a less-developed country where incomes are much lower, it seems worthwhile to know more about the influence of past changes on financial expectations and the role of private transfers from abroad.
For various reasons, the case of Albania is very relevant on a priori grounds. Albania is characterized by a high uncertainty in terms of income due to the transformation from the communist system into a market economy. The particularities of Albania are a combination of extreme poverty and lack of job opportunities with high rate of emigration. According to the World Bank (2008), Albania is currently in the top-10 emigration countries as a percentage of population in the world. In that context, remittances are crucial resources for households (Duval and Wolff, 2010). They have, for instance, a positive impact on economic indicators like satisfaction with current situation, adequateness of food consumption and number of affordable expenditures. These private transfers from abroad are then expected to strongly influence financial expectations, and in turn economic decisions like consumption, education or fertility among others.
To the best of our knowledge, our study is the first one to account for the potential role of remittances on financial expectations. We also contribute to the scarce literature on household financial perceptions in developing or transition countries, in particular Ravallion and Lokshin (2002) and Senik (2004) in Russia, Kingdon and Knight (2007) in South Africa and Gunatilaka and Knight (2007) in China.
For our empirical analysis, we use the Living Standard Measurement Study (LSMS hereafter) conducted by the World Bank in Albania from 2002 to 2004. The high quality of these longitudinal data is unprecedented for this country. It includes numerous questions on
2
Using the Dutch Socio-Economic panel, Das and van Soest (1997, 1999) provide estimates of expected changes in income and estimates of a dynamic panel model on income growth. Their main results are that i) respondents are more likely to expect an income decrease than an income increase, ii) realizaions are substantially better than expectations, and iii) income change expectations strongly depend on income changes in the past. For further evidence, see Dominitz and Manski (1997).
objective variables like education, employment, migration or remittances and on subjective perceptions of financial situations. For the three waves, respondents indicate their satisfaction with respect to their current situation and also expectations and realized changes in their financial situation. The LSMS survey offers a unique opportunity to study the influence of remittances on the financial satisfaction dynamics in Albania.
Using subjective information about financial changes requires some explanation as such data have been the subject of controversial debates. Until recently, many economists were skeptical about the empirical content of subjective data, with problems concerning psychological mechanisms, interactions with the surveyor or question formulation, amongst other things3. The situation is different nowadays, with a rapid growth in subjective data use. Many studies have shown that subjective questions were reliable and useful (Frey and Stutzer, 2002, Di Tella and MacCulloch, 2006).
When looking at the data, we investigate household characteristics that influence financial expectations over time, with particular emphasis on past changes experienced by respondents and on the receipt of remittances. The use of panel data allows us to control for unobserved heterogeneity at the individual level in our econometric analysis. We turn to random and fixed effects ordered Probit models to explain self-reported financial satisfaction. Our main findings are that financial expectations are strongly affected by realized changes in the past and that the receipt of remittances matters. Those who have benefited from private transfers from abroad have, on average, better financial expectations.
The remainder of this paper is organized as follows. In Section 2, we provide background on the economic and migratory situations in Albania and present the LSMS data. In Section 3, we provide descriptive statistics on current, past and future financial situations and discuss the role of remittances. In Section 4, we present our econometric strategy and investigate the role of individual characteristics on expected financial situation changes. We give our conclusion in Section 5.
2. Data
2.1. The Albanian context
We shall begin with a description of the context of this ex-communist country along with the challenges faced during the transition to a market economy. Following the collapse of communism, Albania has pursued strong reforms. After a period of erratic growth in the early 1990’s, linked to several financial and political crises, the gross domestic product (GDP) has
3
increased by 5.7% on average between 2000 and 2005. However, the GDP per inhabitant remains low (USD 2400 in 2003). Living standards remain really among the lowest in Europe, and one in four Albanians lives below the poverty line (less than USD 2 per day). The Human Development Index (HDI) (0.784) is inferior to the average of Eastern Europe (0.802) and the rate of unemployment (17.0% in 2004) and inflation (2.3% in 2004) are high4.
However, the proximity of attractive neighboring countries like Greece and Italy offers some opportunities. After a half-century of isolation, Albanians’ desire to emigrate has been increasing rapidly. Recent events, like the fall in national income, high unemployment and poverty, combined with episodes of political instability, have greatly increased emigration (King et alii, 2005). Albania is now, as a portion of the population, the country with the fourth highest number of emigrants in the world5. According to the OECD database on immigrants and expatriates (2005), around 64.4% of Albanian migrants live in Greece and 25.4% in Italy.
These international migrants play an important part in supporting the Albanian economy since a large proportion of their incomes is transferred back home (Korovilas, 1999). Remittances represent an important source of foreign exchange. According to the World Bank (2008), these transfers outpace exports, foreign direct investments, and official development assistance. Remittances represent about 15.0% of the GDP in Albania and they are increasing over time, from USD 152 million in 1992 to USD 1,071 million in 2007. Since a significant share of remittances is sent through informal channels, the true amount of remittances to Albania is in fact much larger. By significantly increasing the resources of Albanian households, remittances sent back to the country of origin strongly alleviate poverty.
2.2. The LSMS Albanian data
Given their importance, remittances are expected to have a significant influence on financial expectations. We test this assumption using the first three waves of the LSMS Albanian data covering the 2002-2004 period6. Conducted by the Albanian Institute of Statistics with the assistance of the World Bank, the first wave includes a nationally representative sample of households and individuals and is representative of both urban and rural areas. The sample is composed of 3,600 households, on the basis of 450 Primary
4
According to the United Nations (2002), the HDI rank for Albania is 73 out of 177 countries.
5
According to the World Bank (2008), the stock of emigrants expressed as a percentage of population is estimated at 27.5%, i.e. 860,485 people.
6
The LSMS project is an international effort supported by the World Bank in order to improve the quality of household survey data for policy needs. It is thus a crucial tool in measuring poverty in developing countries. For further information on the LSMS project and the Albanian data in particular, see the documentation available on the World Bank website at the following location: http://www.worldbank.org/lsms/index.htm.
Sampling Units (PSU) and eight households in each PSU. Four questionnaires were used in order to collect information in 2002: a household questionnaire, a diary recording household consumption, a community questionnaire, and a price questionnaire.
The focus in the following waves was only on the first instrument, i.e. the household questionnaire7. The core questionnaire was divided into two main parts. In the first one, data concern the household roster, dwelling, education, health, labor, migration, transfers and social assistance, other income sources, consumption and anthropometrics. In the second part, additional information is collected on fertility, subjective poverty, agricultural and non-farm activities. It should be note that significant efforts have been made to maintain comparability of the different variables over time.
The sizes of the Albanian samples are respectively 1,782 households in 2002 (7,973 individuals), 2,155 households in 2003 (8,110 individuals) and 1,797 households in 2004 (8,025 individuals). In what follows, we focus on changes over time in subjective information on financial expectations and remittances at the household level. For that purpose, we construct a sample where we follow the head of each household over the three waves. This leads to an unbalanced panel comprising 5,618 observations for the period 2002-2004, corresponding to 1,937 households.
Let us now describe in more detail the key questions of our study. In the three waves, we rely on the following subjective questions, respectively related to satisfaction with current, past and future financial situations:
A. “How satisfied are you with your current financial situation?” Possible answers are “fully satisfied”, “rather satisfied”, “less than satisfied”, “not at all satisfied”, “don’t know” or “refuse to answer”.
B. “Do you feel that your financial situation in the past 12 months has…?” Possible answers are “improved a lot”, “somewhat improved”, “remained the same”, “somewhat deteriorated”, “deteriorated a lot”, “don’t know” or “refuse to answer”8.
C. “Do you think that in the next 12 months your financial situation will be…?” Possible answers are similar to those of question B.
7
The diary for household consumption, the community questionnaire and the price questionnaire were not repeated in 2003 and 2004. Significant efforts have been made to reduce the length and complexity of the 2002 LSMS round. The second and third waves of the panel are a reduced version of the 2002 LSMS round, with some additional elements required for the panel, like details of people moving into and out of the household.
8
The question in 2002 is about realized changes since last three years, while answers are about realized changes since last 12 months in 2003 and 2004.
As they stand, these questions are easy for respondents to understand. They are also clear and well formulated, and respondents are likely to have the same concepts in mind while answering questions A, B, and C. Since these questions have been asked at each wave of the survey, it is possible to study changes in financial situation over time. Unfortunately, detailed information on incomes remains scarce and we only know the current level of monthly household income for 2002. When considering the three waves, we choose to use a proxy variable for income, which is given by the self-reported position of the respondent on a 10-step ladder. The poorest people stand at the bottom (10-step 1), while the richest stand on the highest step (step 10).
Concerning remittances, data are available in the transfers and social assistance module for 2002. Information on transfers includes remittances and transfers of family living in Albania. We know who the donor related to the head of the household is (spouse, child, sibling, etc.) and also where the donor lives (Albania or Greece, Italy, United States, etc.). Transfers are then remittances when the donor lives abroad. The amounts of these flows (both for cash and in-kind transfers) are also given. For 2003, information is in the migration module, which includes an additional sub-section about children living away from home. We then have data on transfers received (but not on remittance amounts) from all the children, nephews, parents, and siblings. Finally, a module on remittances and other incomes is again in the 2004 questionnaire, with similar information to 2002.
3. Descriptive statistics on financial satisfaction and remittances
3.1. The pattern of financial satisfaction
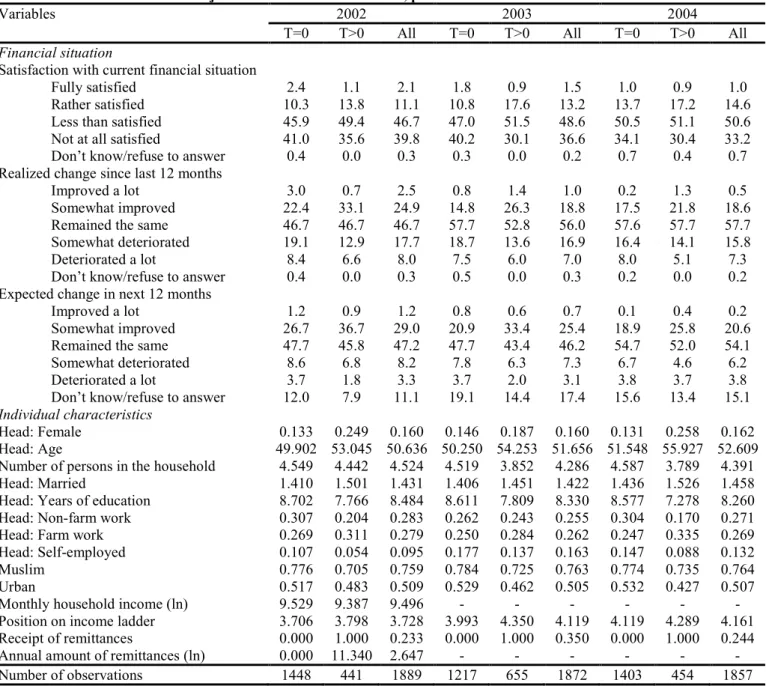
Let us first describe the pattern of current financial situation satisfaction among Albanian households. According to Table 1, we find that around 85% of the respondents feel not really satisfied (either “less than satisfied” or “not satisfied at all”)9. This proportion decreases slightly over the period. It was equal to 86.5% in 2002, 85.2% in 2003 and 83.8% in 2004. At the same time, we can observe a change in dissatisfaction intensity over the period. Among unsatisfied respondents, 46% of them were not at all satisfied in 2002, 43% in 2003, and 39.6% in 2004. Conversely, the percentage of respondents being rather or fully satisfied increases over the period, from 13.2% in 2002 to 15.6% in 2004. A plausible explanation is related to economic growth, since annual GDP growth increases from 3% to 6% between 2002 and 2004 according to the World Bank (2008).
9
We also indicate the proportion of individuals who do not answer to the question about their current financial situation. This proportion remains very low over the three years.
Insert Table 1 here
This pattern seems quite consistent with answers given to realized changes over the last 12 months. Over the period, respondents more frequently reported that their financial situation remained the same. This proportion increases over the period: 46.7% in 2002, but 56.0% in 2003 and 57.7% in 200410. In 2003 and 2004, around 20.0% of respondents claimed that their situation has been either “somewhat improved” or “improved” a lot since last years. At the same time, the percentage of respondents reporting that their situation has deteriorated (either “somewhat” or “a lot”) is slightly higher, 23.9% in 2003 and 23.1% in 2004. On average, the situation has deteriorated a lot for about 7.0% of respondents.
We also investigate the pattern of expected changes in financial situations over the next 12 months. As shown in Table 1, many respondents expected that their financial situation would remain unchanged: 47.2% in 2002, 46.2% in 2003 and 54.1% in 2004. In addition, respondents seemed rather optimistic about the future. In 2002 and 2003, more than 30% of them believed that their financial situation would be improved, either “somewhat” or “a lot”, but this proportion was lower in 2004 (20.8%). In comparison, about 10% of respondents believed that their situation would deteriorate in next 12 months (most often “somewhat deteriorated”). Another comment is that 14.4% of respondents did not give any answer about their future situation (11.1% in 2002, 17.4% in 2003 and 15.1% in 2004).
Since we attempt to explain financial situation expectations, we choose to discard these observations. As this could lead to possible selection effects, we study the characteristics of these households that did not express any view about their future situation further. When comparing the characteristics of those who reported their expectations and those who did not, we find a few differences between the two groups of respondents. In particular, people without ideas about their future situation have on average more people in their household, they are less likely to have a farm job, they more often than not live in an urban area and they are less likely to have experienced an improvement in their financial situation during the last year. At the same time, remittances play no significant role in the probability of not reporting expectations.
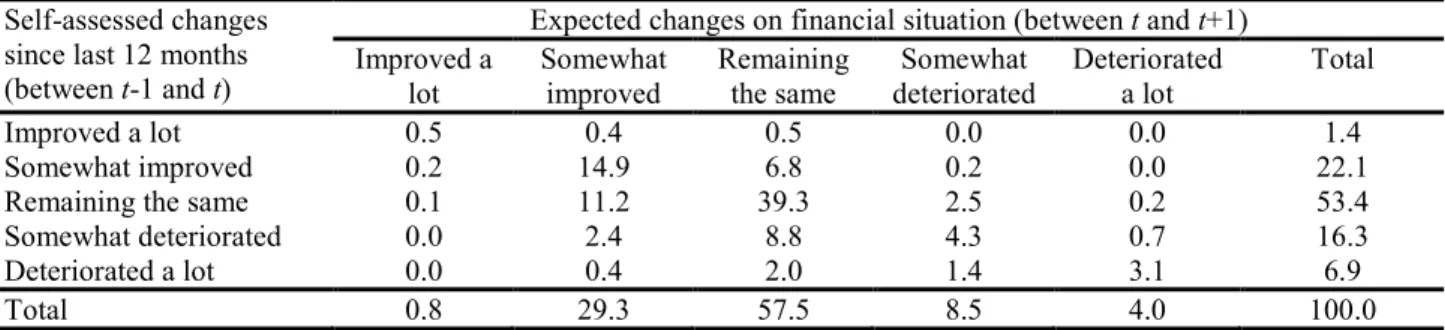
Since people having experienced negative shocks over the last year may be more pessimistic about their future situation, we describe in Table 2 expected financial situations over the next 12 months conditioned by realized changes over the last 12 months. According to the data, the percentage of respondents claiming that their situation had not changed over
10
In 2002, the question is about realized changes over the last three years. This may be an explanation of the differences observed between 2002 and 2003/2004.
the last 12 months and that their situation will remain the same during the 12 next months are roughly similar, respectively 53.4% and 57.5%. Interestingly, many respondents give similar answers to realized and expected changes (62.1%). This means that expectations most often reproduce experienced changes. For instance, among those who expect their situation not to change at t+1, 68.3% of them report no change in their financial situation between t-1 and t11.
Insert Table 2 here
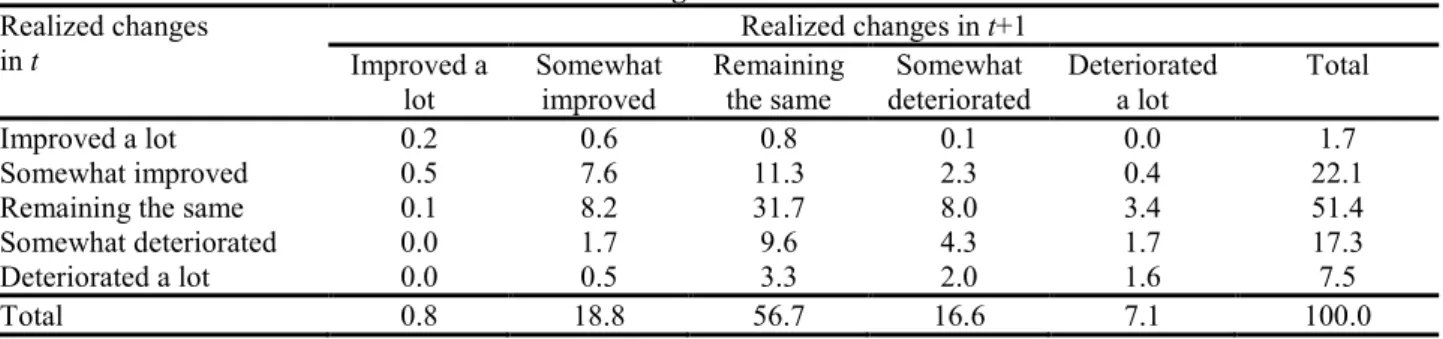
Another result is that respondents are rather confident about the future with respect to realized changes. While 11.3% of them have expectations that are worse than realized changes, 26.6% have expected changes that are better than realized changes12. We compare realized financial situation changes in period t+1 with realized changes in period t in Table 3. Less than one half of respondents (45.4%) give a similar answer to realized changes in t and in t+1. Among those who indicate a somewhat improved situation in t+1 (18.8% of the sample), 40.4% of them had the same feeling about the realized changes in t, but 43.6% claimed that their situation had remained the same.
Insert Table 3 here 3.2. Remittances and financial satisfaction
Several explanations may come to mind to explain why private transfers from abroad should influence financial situation expectations. The first one is a pure income effect. People receiving remittances would be more optimistic because the prospect for income growth is higher abroad than in Albania, so respondents who receive a share of an emigrant’s revenue naturally expect that this source of income will grow. Several authors have shown that private transfers from abroad were invested in local activities like business or small enterprises (Woodruff and Zenteno, 2007). Clearly, these investments are expected to generate additional resources in the future. Also, in a context characterized by a high uncertainty in terms of income during the transition period, remittances may be perceived by their recipients as more secure resources than local labor earnings.
A second explanation is that people who send their children and relatives abroad are more optimistic. As a consequence, they would naturally receive remittances later and this would lead to a positive correlation between private transfers from abroad and expectations. This would correspond to a pure selection effect. Another mechanism is that households
11
Among those whose situation was expected to deteriorate a lot in next 12 months, 76.9% of them claimed that their situation had deteriorated a lot over the last 12 months.
12
Among this group of more optimistic respondents, 11.4% reported an unchanged level of satisfaction from the previous year and an expectation for a somewhat improved situation.
receiving remittances are more optimistic because they realize that they are integrated into a dynamic social network (network effect). This could explain why migration and remittances sent back to the country of origin stimulate chain migration. In various developing and transition countries, van Dalen et alii (2005) and Dimova and Wolff (2009) have found a positive effect of remittances on the migration prospects of potential migrants. This is likely to be the case in Albania where international migration is an almost ordinary phenomenon13.
One therefore expects a positive correlation between the receipt of financial transfers and financial situation. Results reported in Table 1 show that remittances play an influential role. For the various years, respondents are more likely to be “rather” of “fully” satisfied when they benefit from remittances: 14.9% instead of 12.7% in 2002, 18.5% instead of 12.6% in 2003, and 18.1% instead of 14.7% in 2004. At the same time, the proportion of respondents being not satisfied at all is strongly reduced among recipients. This pattern was expected as remittances bring additional resources to households.
It is also not surprising to observe that remittances have a positive effect on realized changes over the last 12 months. Improved realized changes (either “somewhat” or “a lot”) are much more frequent among recipients than among non-recipients: 33.8% instead of 25.4% in 2002, 27.7% instead of 15.6% in 2003, and 23.1% instead of 17.7% in 2004. Finally, we observe a positive correlation between the receipt of transfers and expectations. Respondents who have received money from other family members living in foreign countries are on average more optimistic about their financial situation in the future. For instance, in 2004, 26.2% of transfer recipients were expecting their financial situation to improve a lot or somewhat in the next 12 months, but this proportion was only 19% among non-recipients.
A crucial issue is that the LSMS Albanian data are not really helpful in understanding the reasons leading to the positive effect of remittances on expectations. Firstly, since information on income remains poor (except in 2002), it is somewhat difficult to have a clear view of the magnitude of the income effect. Secondly, assessing the relevance of the selection mechanism would require data on household subjective financial situation perceptions before departure of migrants. By definition, we studied the effect of remittances received during the various waves and did not have prior information on the optimism of the selected households. Finally, we do not have the detailed characteristics of the money senders and thus cannot have a clear view of the strength of the migration networks.
13
Using a survey of 1500 individuals living in Albania, Kule et alii (2002) find that over 43.0% of respondents have already migrated between two and three times in 2002.
In the following section, we investigate whether remittances have a significant influence or not on financial expectations once we control for household characteristics. Before turning to the econometric analysis, we briefly describe the different explanatory variables that we will introduce in our regressions.
A look at individual characteristics shows that there are many more male (84.0%) than female (16.0%) respondents and the mean number of people per household is around 4.414. The mean age for the head of the household is slightly above 50 years of age. On average, the head of the household has completed more than eight years in education. Concerning employment status, the proportion of farm workers slightly decreases over the period, from 27.9% in 2002 to about 26.9% in 2003 and 2004. Substantial variations are found among the self-employed (9.5% in 2002, 16.3% in 2003 and 13.2% in 2004). In the sample, respondents are more often Muslim (76.2%) and about one-half of them live in an urban area (50.7%). The self-reported position on the income ladder increases over the period 2002-2004, from 3.7 to 4.2.
We can see in Table 1 that the proportion of households receiving remittances is much higher in 2003 (35.0%) than in 2002 and 2004 (24.0%). This is undoubtedly due to the different way of measuring remittances in the survey for that year, with more detailed questions15. Interestingly, we note some significant differences between recipients and non-recipients. In particular, remittances are more frequently reported by women and married respondents, while the reverse pattern holds true for education and non-farm workers. This is due to the fact that highly educated individuals are more likely to emigrate, which increases the probability of the head of the household still living in Albania being helped.
4. Econometric analysis of expected changes
4.1. Econometric specification
Let S be the subjective measure of expectations. We have S 1 when the financial situation over the next 12 months will be “deteriorated a lot”, S 2 when “somewhat deteriorated”, S 3 when “remaining the same”, and S 4 when “somewhat improved” or “improved a lot”. We chose to group these two last answers together as very few households believed that their situation would improve a lot (0.7% in our sample).
Let S be a latent variable associated to these financial expectations. Given the *
different outcomes, we assume that S* 1 when S 1, 1 S* 2 when S 2,
14
Note that we work at the household level and consider information related to the head of the household.
15
3 *
2 S when S 3, and
*
3 S when S 4. The latent indicator
*
S is expected to
depend on a set of individual characteristics X , a vector of coefficients and an error term. Since we have repeated information on financial expectations for each household, we control for unobserved heterogeneity at the household level in the following way:
it i it it X
S* ' (1)
where i and t as subscripts refer respectively to the head of the household and to the year of survey. In (1), i is an unobserved individual effect. These individual disturbances are
supposed to be normally distributed, with mean 0 and variance 2. The error terms it are also supposed to follow normal distribution with mean 0 and unitary variance. Under the assumption that the covariates are uncorrelated with the individual effects, the corresponding model is a random effect ordered Probit model and the different threshold levels j have to be estimated jointly with the vector of coefficients .
The contribution to the likelihood function of a household i observed during the three periods can be expressed as:
i i it j it j i i i S S X X d S , , ) ( ' ) ( ' ) ( ) Pr( 02 03 04 1 (2)
where ( i) is the density of (0, 2)
i
N . The likelihood function for the above model involves multivariate normal integrals. The random effect ordered Probit model is hence estimated using numerical approximations and Gaussian quadrature techniques16.
4.2. Income and ordered Probit estimates
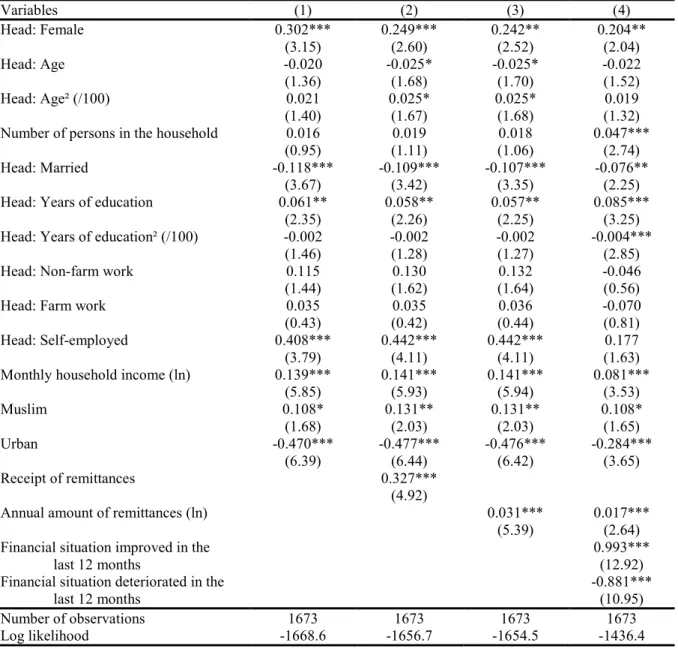
As highlighted in sub-section 3.2, remittances may influence expectations through a pure income effect. Since there is only detailed information on income and remittance amounts in the 2002 wave, we rely on a cross-sectional analysis and estimate a standard ordered Probit regression for that year. The sample is then restricted to 1,673 households and our estimates are shown in Table 417. The regression includes the following characteristics concerning the head of the household: gender, age, number of people in household, marital situation, years in education, dummy variables related to occupation, religion (a dummy when
16
For further details, see Butler and Moffitt (1982).
17
Among the 1889 selected respondents in 2002, 1678 of them provided information on their financial expectations (we excluded the respondents who had no idea about their financial situation in the future) and there are five observations with missing income.
the head is Muslim) and rural-urban status. We also control for the log of the monthly household income.
Insert Table 4 here
As shown in column (1), women have higher financial expectations than men (at the 1% level). Married respondents have lower expectations, while the number of people in the household is not a significant covariate. Head of household age is characterized by a U-shaped profile, with a minimum at 50 years. We observe a positive impact of years in education on expectations. Education is highly correlated with permanent wealth and high educated respondents will benefit from more income opportunities in the future. Muslim households are, on average, more optimistic about their financial expectations (at the 10% level), while living in urban areas negatively influences expectations18.
We also introduce explanatory variables related to the economic situation of the head of the household. First, we add three controls indicating the current labor market status: non-farm work, non-farm work and self-employed (not working being the reference category). While having a non-farm job or a farm job does not influence the subjective outcome, we find that being self-employed makes individuals much more optimistic about their financial expectations. Not surprisingly, we find a positive impact of current household income on expectations. Those who are richer today are significantly more optimistic about their future.
Let us now investigate whether remittances influence or not expectations. In column (2), we introduce a dummy variable equal to one when the household has received remittances during the past year. Since we control for household income in the regression, this means that the transfer variable does not pick up a pure income effect. According to the LSMS Albanian data, we find that the composition of family resources has an effect on financial expectations. Having received remittances makes respondents significantly more optimistic about their future financial situation (at the 1% level)19. In column (3), we replace the remittance dummy with the annual amount of remittances and again find a positive and significant coefficient. Respondents are more optimistic about the future when they receive large amounts of transfers from abroad.
Finally, in column (4), we add the subjective answers to realized changes. We introduce two dummy variables in the regression, respectively for improved situation and deteriorated situation over the last 12 months. We observe that past changes strongly matter in
18
This result is a little bit surprising since poverty is essentially rural in Albania. At the same time, those living in urban areas may rely on rural-urban migration to improve their economic situation in the future.
19
We also note that controlling for remittances reduces the magnitude of the gender coefficient. An explanation is that the head of the household is more likely to be a woman when her husband has migrated.
understanding expectations20. On the one hand, those who have experienced an improvement in their financial situation over the last year expected an improved financial situation over the next 12 months. On the other hand, households whose financial situation had deteriorated were quite pessimistic and more often they reported that their financial situation would deteriorate in the future. The magnitude of the corresponding estimates is substantial, which suggests a strong inertia between past changes and expectations among households in Albania21.
With respect to our study, an important result from column (4) is that including past changes in the regression does not affect the positive influence of remittances on expectations. Nevertheless, we note that the magnitude of the log amount of transfer coefficient is about twice as low once controlling for past changes (0.017 instead of 0.031). A similar result holds with the regression including the remittance dummy coefficient (results not reported), which decreases from 0.327 to 0.179 when adding changes over the last 12 months to the regression. A simple explanation is that remittances received during last year have certainly improved realized changes, so that part of the income effect associated to remittances is itself picked up by realizations22. At the same time, the transfer variable remains significant in our regression (with t=2.48), which suggests factors of influence other than a pure income effect (for instance prospects for migration opportunities).
4.3. Unobserved heterogeneity and random effect Probit estimates
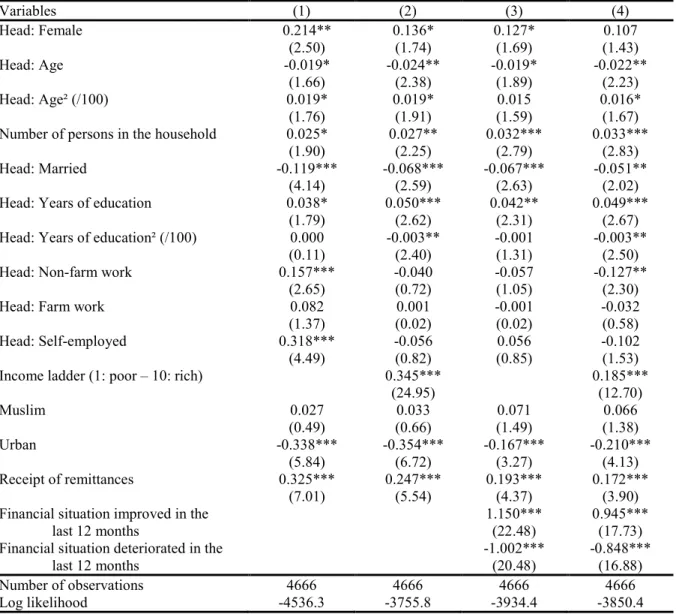
We then extend our analysis using the three waves of the survey (4666 observations, 1844 households)23. We estimate random effect ordered Probit models in order to control for unobserved heterogeneity at the household level. Note that we were unable to include the level of household income and the amount of remittances in our regressions since both covariates were only available in the 2002 wave. We consider as a proxy for resources the self-reported position on income ladder. As shown in Table 5, we note that the random effect specification does not really affect our previous findings based on the 2002 wave.
Insert Table 5 here
20
We also note that the other estimates in column (4) are not really affected when accounting for past changes.
21
The fact that those who had experienced an improvement of their situation were more optimistic about their expected changes while those who had experienced a decrease were pessimistic is very similar to the results reported in Das and van Soest (1997). These authors also highlight a strong influence of realized changes on expectations in the Netherlands.
22
We observe such positive correlation between remittances and improvement in financial situation during the last year.
23
Again, we excluded from our analysis respondents who did not have a clear view of their financial situation in the future.
In column (1), we choose as a preliminary step to exclude the subjective control for household income. Hence, the remittance dummy variable should pick up both an income effect and possible other factors of influence (selection effect, network effect). On average, a female-headed household has higher expectations (at the 5% level), which could be linked to the fact that her husband has migrated. More educated heads, both self-employed and those who live in a rural area, are more often optimistic about their financial situation over the next 12 months. We find that the receipt of remittances has a significant influence on expectations (at the 1% level). Respondents have a much more optimistic view on their future financial situation when they benefit from private transfers from abroad.
In column (2), we add in the list of covariates our proxy for household resources. “Richer” households have on average much better expectations. Interestingly, the coefficient associated to remittances remains positive and highly significant, but its value is now about one-third lower (0.247 instead of 0.325). This result tends to support to our interpretation that the remittance dummy coefficient in column (1) is also absorbing an income influence. An additional result is that occupation is no longer statistically significant when household resources are controlled for.
Finally, in columns (3) and (4), we add answers to realized changes, which have a strong influence on expectations. Again, households whose financial situation has improved during the last 12 months are more likely to be optimistic, while deterioration in the last 12 months makes respondents more pessimistic about their future. Furthermore, both the self-reported position on the income ladder and receipt of remittances are positively correlated with financial expectations. The magnitude of the remittance coefficient is slightly lower with the inclusion of both income and realized changes in the regression (0.172 instead of 0.193), but the remittance effect remains significant at the 1% level. Thus our findings from the LSMS Albanian data clearly indicate that the composition of household income matters when understanding financial situation expectations.
4.4. Random versus fixed effects
With respect to our empirical analysis, a valid question is to know whether the dummy associated to the receipt of remittances can really be considered as exogenous in the previous regressions. It is well known that endogeneity may be due to (at least) one of the following
explanations: i) simultaneity, ii) measurement errors, and iii) omitted variables (unobserved heterogeneity) 24.
Let us first consider the possibility of simultaneity. Since remittances are an additional source of resources for households in Albania, they are likely to greatly improve financial situation expectations. Conversely, it is hard to conceive that expectations should directly influence remittances. Note that this holds true only because we included transfers from abroad received during the last 12 months in the regression. Indeed, more optimistic respondents could be tempted to take more risk and send more family members to foreign countries, which would in turn increase future (but not current) remittances.
The second issue deals with measurement errors. While we acknowledge that there may be some errors in the way households perceive their future financial situation, we also believe that very similar difficulties are likely to affect all previous studies that have dealt with subjective questions about well-being and expectations. A potentially more serious problem, which is specific to our study, lies in the difficulty in measuring private transfers received from people living in foreign countries. As shown in Table 1, the proportion of households receiving remittances is almost the same in 2002 and 2004 (around 24%), but it is much higher in 2003 with a transfer rate of 36% because more detailed questions on transfers were included in the 2003 wave (see Duval and Wolff, 2010).
To assess the sensitivity of our results to the definition of remittances, we decide to exclude the 2003 wave from our longitudinal data. We estimate the same specification as in column (4) of Table 5. According to our random effect ordered estimates, we still highlight a positive correlation between remittances and expectations (with a t-value of 2.78)25. The magnitude of the transfer coefficient amounts to 0.150, which is slightly lower than the value of 0.172 reported in Table 5. We have also estimated the same specification using the 2003 wave only and get a larger coefficient (0.181) for the remittance receipt variable. This is not really surprising since transfers have an influence on expectations, the impact on the future financial situation should be more important when there are more remittances. However, we clearly show that our conclusions are not blurred by changes in the definition of remittances.
The last concern is about omitted variables. Although we control for unobserved heterogeneity with our random effect estimates, this specification would be inappropriate if the household specific effects were correlated with the explanatory variables. It therefore
24
A difficulty could stem from a state dependence on the provision of remittances over time. If remittances in t depend on transfers made in t-1, then past remittances could influence current expectations.
25
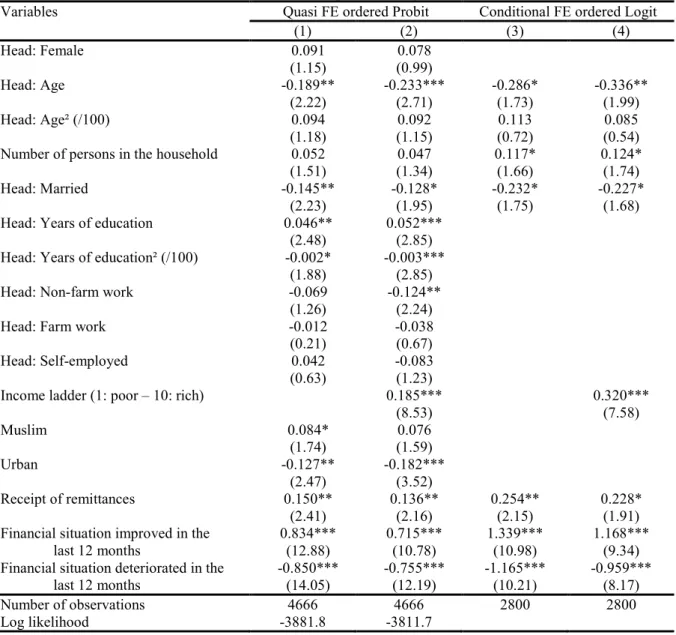
seems important to estimate a fixed effects regression in an appropriate way. As a preliminary step and following the suggestion of anonymous reviewer, we turn to a quasi fixed effect ordered Probit specification by simply adding the means over time of the time variant regressors as additional explanatory variables (respectively age, number of persons in the household, marital status, income ladder, financial situation improved in the last 12 months, financial situation deteriorated in the last 12 months). The corresponding estimates are in columns 1 and 2 of Table 6.
Insert Table 6 here
Turning to a quasi fixed effect specification does not affect our previous conclusions. On the one hand, we evidence a positive correlation between remittances and expectations. Nevertheless, the magnitude of the transfer coefficient is slightly lower with the fixed effect framework than with the random effect regression. Adding a control for household resources further reduces the effect of the transfer dummy (0.136 instead of 0.150), but the latter still have a significant influence at the 5% level. On the other hand, respondents are more optimistic when their financial situation has improved in the past, while they are more pessimistic about the future when they have already experienced negative shocks.
We rely on a Hausman test to assess the appropriateness of the fixed effect estimator. Without controlling for income, we find a statistic equal to 104.8 for the Hausman test without income control and to 79.2 when the regression includes the position on income ladder. In both cases, the statistic is highly significant and the hypothesis that the individual effects are uncorrelated with the covariates has to be rejected. We then choose to further study the fixed effect framework and implement the conditional estimator proposed in Das and Van Soest (1999)26. We proceed in the following way.
Firstly, we estimate a set of conditional Logit models by grouping together adjacent outcomes related to financial expectations. We define three dependent variables Soj such that
1
1
So if S 1 and So1 0 otherwise, So2 1 if S 2 and So2 0 otherwise, and 1
3
So if S 3 and So3 0 otherwise. For each Soj, we get a consistent estimate j of using the conditional Logit estimator proposed by Chamberlain (1980). In the second stage, we apply a classical minimum distance estimator. To get a restricted estimator of from 1
,
26
Ferrer-i-Carbonnel and Frijters (2004) also propose a conditional estimator for the fixed effects ordered model. Their results show that their own estimator and the Das-van Soest estimator lead to very similar coefficients (2004, p. 653). The main advantage of the Das-van Soest estimator is that it uses more information. However, this estimator needs stronger regularity assumptions. See Appendices C and D in Ferrer-i-Carbonnel and Frijters (2004) for a detailed comparison between the two estimators.
2
and 3, we solve min ˆ H 'Vˆ 1 ˆ H , with Vˆ a weighting positive definite matrix and the unrestricted vector ( 1', 2', 3')'. The mapping from to is linear, with H . The solution ˆ is given by ˆ H'Vˆ 1H 1 H'Vˆ 1ˆ and the asymptotic
covariance matrix is V ˆ H'Vˆ 1H 1.
Results from the conditional fixed effect estimator are in columns (3) and (4) of Table 6. By definition, all the covariates that are time invariant at the household level (gender, education, religion, etc) are excluded from the regression27. Without a control for household resources, we find that respondents are more optimistic about the future when they have received remittances over the last year (t=2.15, column 3). The remittance coefficient is slightly lower when the subjective position of the household on an income ladder is introduced into the regression (0.228 instead of 0.254). Furthermore, it is only significant at the 6% level (column 4). Finally, past changes in financial situation strongly influence expectations.
Since the effect of remittances remains robust to (subjective) control for household resources within the fixed effect framework, our results are in favor of an effect of remittances on expectations that goes beyond the strict income channel. They suggest that migration opportunities may have a specific role on how households appreciate their financial situation in the future.
5. Conclusion
While economic theories related to the study of household behavior assign a central role to financial expectations, empirical evidence on this issue remains rather scarce, especially in the context of less developed countries where household resources are usually subject to uncertainty. This contribution adds empirical evidence about financial expectations in Albania using subjective data on past, current and future financial situations over the period 2002-2004, with a focus on the role of remittances.
Our main conclusions are as follows. First, financial situation expectations in Albania are affected by past changes. Secondly, the composition of household income matters. We find that the receipt of remittances has a positive influence on the subjective perception of households about their future financial situation. This positive relationship still holds true when controlling for unobserved household heterogeneity using either random or fixed effect
27
ordered regressions. However, we are not able to shed light on the mechanisms leading to better expectations among households receiving remittances with the data at hand. Among the various factors discussed in our analysis (income effect, selection effect, network effect), our results suggest that the remittance dummy does not only pick up an income effect. Unfortunately, we do not have the relevant information to further study the relevance of the selection and network hypotheses.
As they stand, our results have strong macroeconomic implications. From an empirical viewpoint, it would be of interest to further analyze the complex interplay between economic growth in Albania and the fact that households are on average optimistic about their future financial situation. We leave this issue for future research.
References
Brown S., Taylor K., (2006), “Financial expectations, consumption and saving: A microeconomic analysis”, Fiscal Studies, vol. 27, pp. 313-338.
Butler J.S., Moffitt R., (1982), “A computationally efficient quadrature procedure for the one-factor multinomial probit model”, Econometrica, vol. 50, pp. 761–764.
Chamberlain G., (1980), “Analysis of covariance with qualitative data”, Review of Economic
Studies, vol. 47, pp. 225-238.
Das M., van Soest A., (1997), “Expected and realized income changes: Evidence from the Dutch socio-economic panel”, Journal of Economic Behavior and Organization, vol. 32, pp. 137-154.
Das M., van Soest A., (1999), “A panel data model for subjective information on household income growth, Journal of Economic Behavior and Organization, vol. 40, pp. 409-426. Dimova R., Wolff F.C., (2009), “Remittances and chain migration: Longitudinal evidence
from Bosnia and Herzegovina”, IZA Discussion Papers, n° 4083, Institute for the Study of Labor.
Di Tella R., MacCulloch R., (2006), “Some uses of happiness data in economics”, Journal of
Economic Perspectives, vol. 20, pp. 25-46.
Dominitz J., (1998), “Earnings expectations, revisions, and realizations”, Review of
Economics and Statistics, vol. 80, pp. 389-398.
Dominitz J., Manski C., (1996), “Eliciting student expectations of the returns to schooling”,
Journal of Human Resources, vol. 31, pp. 1-26.
Dominitz J., Manski C., (1997), “Using expectations data to study subjective income expectations”, Journal of the American Statistical Association, vol. 92, pp. 855-867. Duval L., Wolff F.C., (2010), “Remittances matter: Longitudinal Evidence from Albania”,
Post-Communist Economies, vol. 22, pp. 75-99.
Ferrer-i-Carbonell A., Frijters P., (2004), “How important is methodology for the estimates of the determinants of happiness”, Economic Journal, vol. 114, pp. 641-659.
Frey B.S., Stutzer A., (2002), “What can economists learn from happiness research?”, Journal
of Economic Literature, vol. 40, pp. 402-435.
Greene W., (2004), “The behavior of the fixed effects estimator in nonlinear models”,
Econometrics Journal, vol. 7, pp. 98-119.
Greene W., Hensher D.A., (2010), Modeling ordered choices. A primer, Cambridge University Press, Cambridge.
Guiso L., Jappelli T., Terlizzese D., (1996), “Income risk, borrowing constraints and portfolio choice”, American Economic Review, vol. 86, pp. 158-172.
Gunatilaka R., Knight J., (2007), “Great expectations? The subjective well-being of rural-urban migrants in China”, mimeo, University of Oxford.
King R., Mai N., Schwandner-Sievers S., (2005), The new Albanian migration, Sussex Academic Press.
Kingdon G., Knight J., (2007), “Community, comparisons and subjective well-being in a divided society”, Journal of Economic Behavior and Organization, vol. 64, pp. 69-90.
Korovilas J., (1999), “The Albanian economy in transition: The role of remittances and pyramid investment schemes”, Post-Communist Economies, vol. 11, pp. 399-415.
Kule D., Mançellari A., Papapanagos H., Qirici S., Sanfey P., (2002), “The causes and consequences of Albanian emigration during transition: Evidence from micro-data”,
International Migration Review, vol. 36, pp. 229-239.
Ravallion M., Lokshin M., (2002), “Self-rated economic welfare in Russia”, European
Economic Review, vol. 46, pp. 1453-1473.
Senik C., (2004), “When information dominates comparison. Learning from Russian subjective panel data”, Journal of Public Economics, vol. 88, pp. 2099-2133.
Senik C., (2005), “What can we learn from subjective data? The case of income and well- being”, Journal of Economic Surveys, vol. 19, pp. 43-63.
van Dalen H., Groenewold G., Fokkema T., (2005), “The effect of remittances on emigration intentions in Egypt, Morocco and Turkey”, Population Studies, vol. 59, pp. 375-392. Woodruff C., Zenteno R., (2007), “Migration networks and microenterprises in Mexico”,
Table 1. Subjective information on current, past and future financial situation
Variables 2002 2003 2004
T=0 T>0 All T=0 T>0 All T=0 T>0 All
Financial situation
Satisfaction with current financial situation
Fully satisfied 2.4 1.1 2.1 1.8 0.9 1.5 1.0 0.9 1.0
Rather satisfied 10.3 13.8 11.1 10.8 17.6 13.2 13.7 17.2 14.6
Less than satisfied 45.9 49.4 46.7 47.0 51.5 48.6 50.5 51.1 50.6
Not at all satisfied 41.0 35.6 39.8 40.2 30.1 36.6 34.1 30.4 33.2
Don’t know/refuse to answer 0.4 0.0 0.3 0.3 0.0 0.2 0.7 0.4 0.7
Realized change since last 12 months
Improved a lot 3.0 0.7 2.5 0.8 1.4 1.0 0.2 1.3 0.5
Somewhat improved 22.4 33.1 24.9 14.8 26.3 18.8 17.5 21.8 18.6
Remained the same 46.7 46.7 46.7 57.7 52.8 56.0 57.6 57.7 57.7
Somewhat deteriorated 19.1 12.9 17.7 18.7 13.6 16.9 16.4 14.1 15.8
Deteriorated a lot 8.4 6.6 8.0 7.5 6.0 7.0 8.0 5.1 7.3
Don’t know/refuse to answer 0.4 0.0 0.3 0.5 0.0 0.3 0.2 0.0 0.2
Expected change in next 12 months
Improved a lot 1.2 0.9 1.2 0.8 0.6 0.7 0.1 0.4 0.2
Somewhat improved 26.7 36.7 29.0 20.9 33.4 25.4 18.9 25.8 20.6
Remained the same 47.7 45.8 47.2 47.7 43.4 46.2 54.7 52.0 54.1
Somewhat deteriorated 8.6 6.8 8.2 7.8 6.3 7.3 6.7 4.6 6.2
Deteriorated a lot 3.7 1.8 3.3 3.7 2.0 3.1 3.8 3.7 3.8
Don’t know/refuse to answer 12.0 7.9 11.1 19.1 14.4 17.4 15.6 13.4 15.1
Individual characteristics
Head: Female 0.133 0.249 0.160 0.146 0.187 0.160 0.131 0.258 0.162
Head: Age 49.902 53.045 50.636 50.250 54.253 51.656 51.548 55.927 52.609
Number of persons in the household 4.549 4.442 4.524 4.519 3.852 4.286 4.587 3.789 4.391
Head: Married 1.410 1.501 1.431 1.406 1.451 1.422 1.436 1.526 1.458
Head: Years of education 8.702 7.766 8.484 8.611 7.809 8.330 8.577 7.278 8.260
Head: Non-farm work 0.307 0.204 0.283 0.262 0.243 0.255 0.304 0.170 0.271
Head: Farm work 0.269 0.311 0.279 0.250 0.284 0.262 0.247 0.335 0.269
Head: Self-employed 0.107 0.054 0.095 0.177 0.137 0.163 0.147 0.088 0.132
Muslim 0.776 0.705 0.759 0.784 0.725 0.763 0.774 0.735 0.764
Urban 0.517 0.483 0.509 0.529 0.462 0.505 0.532 0.427 0.507
Monthly household income (ln) 9.529 9.387 9.496 - - - -
Position on income ladder 3.706 3.798 3.728 3.993 4.350 4.119 4.119 4.289 4.161
Receipt of remittances 0.000 1.000 0.233 0.000 1.000 0.350 0.000 1.000 0.244
Annual amount of remittances (ln) 0.000 11.340 2.647 - - - -
Number of observations 1448 441 1889 1217 655 1872 1403 454 1857
Table 2. Expected financial situation conditional on realized changes
Self-assessed changes since last 12 months (between t-1 and t)
Expected changes on financial situation (between t and t+1) Improved a lot Somewhat improved Remaining the same Somewhat deteriorated Deteriorated a lot Total Improved a lot 0.5 0.4 0.5 0.0 0.0 1.4 Somewhat improved 0.2 14.9 6.8 0.2 0.0 22.1
Remaining the same 0.1 11.2 39.3 2.5 0.2 53.4
Somewhat deteriorated 0.0 2.4 8.8 4.3 0.7 16.3
Deteriorated a lot 0.0 0.4 2.0 1.4 3.1 6.9
Total 0.8 29.3 57.5 8.5 4.0 100.0
Table 3. Realized changes in financial situation Realized changes in t Realized changes in t+1 Improved a lot Somewhat improved Remaining the same Somewhat deteriorated Deteriorated a lot Total Improved a lot 0.2 0.6 0.8 0.1 0.0 1.7 Somewhat improved 0.5 7.6 11.3 2.3 0.4 22.1
Remaining the same 0.1 8.2 31.7 8.0 3.4 51.4
Somewhat deteriorated 0.0 1.7 9.6 4.3 1.7 17.3
Deteriorated a lot 0.0 0.5 3.3 2.0 1.6 7.5
Total 0.8 18.8 56.7 16.6 7.1 100.0
Table 4. Ordered Probit estimates of expected changes in financial situation in 2002 Variables (1) (2) (3) (4) Head: Female 0.302*** 0.249*** 0.242** 0.204** (3.15) (2.60) (2.52) (2.04) Head: Age -0.020 -0.025* -0.025* -0.022 (1.36) (1.68) (1.70) (1.52) Head: Age² (/100) 0.021 0.025* 0.025* 0.019 (1.40) (1.67) (1.68) (1.32)
Number of persons in the household 0.016 0.019 0.018 0.047***
(0.95) (1.11) (1.06) (2.74)
Head: Married -0.118*** -0.109*** -0.107*** -0.076**
(3.67) (3.42) (3.35) (2.25)
Head: Years of education 0.061** 0.058** 0.057** 0.085***
(2.35) (2.26) (2.25) (3.25)
Head: Years of education² (/100) -0.002 -0.002 -0.002 -0.004***
(1.46) (1.28) (1.27) (2.85)
Head: Non-farm work 0.115 0.130 0.132 -0.046
(1.44) (1.62) (1.64) (0.56)
Head: Farm work 0.035 0.035 0.036 -0.070
(0.43) (0.42) (0.44) (0.81)
Head: Self-employed 0.408*** 0.442*** 0.442*** 0.177
(3.79) (4.11) (4.11) (1.63)
Monthly household income (ln) 0.139*** 0.141*** 0.141*** 0.081***
(5.85) (5.93) (5.94) (3.53) Muslim 0.108* 0.131** 0.131** 0.108* (1.68) (2.03) (2.03) (1.65) Urban -0.470*** -0.477*** -0.476*** -0.284*** (6.39) (6.44) (6.42) (3.65) Receipt of remittances 0.327*** (4.92)
Annual amount of remittances (ln) 0.031*** 0.017***
(5.39) (2.64)
Financial situation improved in the last 12 months
0.993*** (12.92) Financial situation deteriorated in the
last 12 months -0.881*** (10.95) Number of observations 1673 1673 1673 1673 Log likelihood -1668.6 -1656.7 -1654.5 -1436.4 Source: LSMS Albania 2002.
Note: Ordered Probit estimates, with robust standard errors. Absolute values of t statistics are in parentheses, significance levels being equal to 1% (***), 5% (**) and 10% (*). Each ordered regression also includes a set of threshold parameters.
Table 5. Random ordered Probit estimates of expected changes in financial situation Variables (1) (2) (3) (4) Head: Female 0.214** 0.136* 0.127* 0.107 (2.50) (1.74) (1.69) (1.43) Head: Age -0.019* -0.024** -0.019* -0.022** (1.66) (2.38) (1.89) (2.23) Head: Age² (/100) 0.019* 0.019* 0.015 0.016* (1.76) (1.91) (1.59) (1.67)
Number of persons in the household 0.025* 0.027** 0.032*** 0.033***
(1.90) (2.25) (2.79) (2.83)
Head: Married -0.119*** -0.068*** -0.067*** -0.051**
(4.14) (2.59) (2.63) (2.02)
Head: Years of education 0.038* 0.050*** 0.042** 0.049***
(1.79) (2.62) (2.31) (2.67)
Head: Years of education² (/100) 0.000 -0.003** -0.001 -0.003**
(0.11) (2.40) (1.31) (2.50)
Head: Non-farm work 0.157*** -0.040 -0.057 -0.127**
(2.65) (0.72) (1.05) (2.30)
Head: Farm work 0.082 0.001 -0.001 -0.032
(1.37) (0.02) (0.02) (0.58)
Head: Self-employed 0.318*** -0.056 0.056 -0.102
(4.49) (0.82) (0.85) (1.53)
Income ladder (1: poor – 10: rich) 0.345*** 0.185***
(24.95) (12.70) Muslim 0.027 0.033 0.071 0.066 (0.49) (0.66) (1.49) (1.38) Urban -0.338*** -0.354*** -0.167*** -0.210*** (5.84) (6.72) (3.27) (4.13) Receipt of remittances 0.325*** 0.247*** 0.193*** 0.172*** (7.01) (5.54) (4.37) (3.90)
Financial situation improved in the last 12 months
1.150*** 0.945***
(22.48) (17.73)
Financial situation deteriorated in the last 12 months -1.002*** -0.848*** (20.48) (16.88) Number of observations 4666 4666 4666 4666 Log likelihood -4536.3 -3755.8 -3934.4 -3850.4 Source: LSMS Albania 2002-2004.
Note: Random effects Ordered Probit estimates. Absolute values of t statistics are in parentheses, significance levels being equal to 1% (***), 5% (**) and 10% (*). Each ordered regression also includes a set of threshold parameters.
Table 6. Fixed effects estimates of expected changes in financial situation
Variables Quasi FE ordered Probit Conditional FE ordered Logit
(1) (2) (3) (4) Head: Female 0.091 0.078 (1.15) (0.99) Head: Age -0.189** -0.233*** -0.286* -0.336** (2.22) (2.71) (1.73) (1.99) Head: Age² (/100) 0.094 0.092 0.113 0.085 (1.18) (1.15) (0.72) (0.54)
Number of persons in the household 0.052 0.047 0.117* 0.124*
(1.51) (1.34) (1.66) (1.74)
Head: Married -0.145** -0.128* -0.232* -0.227*
(2.23) (1.95) (1.75) (1.68)
Head: Years of education 0.046** 0.052***
(2.48) (2.85)
Head: Years of education² (/100) -0.002* -0.003***
(1.88) (2.85)
Head: Non-farm work -0.069 -0.124**
(1.26) (2.24)
Head: Farm work -0.012 -0.038
(0.21) (0.67)
Head: Self-employed 0.042 -0.083
(0.63) (1.23)
Income ladder (1: poor – 10: rich) 0.185*** 0.320***
(8.53) (7.58) Muslim 0.084* 0.076 (1.74) (1.59) Urban -0.127** -0.182*** (2.47) (3.52) Receipt of remittances 0.150** 0.136** 0.254** 0.228* (2.41) (2.16) (2.15) (1.91)
Financial situation improved in the last 12 months
0.834*** 0.715*** 1.339*** 1.168***
(12.88) (10.78) (10.98) (9.34)
Financial situation deteriorated in the last 12 months -0.850*** -0.755*** -1.165*** -0.959*** (14.05) (12.19) (10.21) (8.17) Number of observations 4666 4666 2800 2800 Log likelihood -3881.8 -3811.7 Source: LSMS Albania 2002-2004.
Note: (1) and (2) are fixed effect quasi ordered Probit estimates, (3) and (4) are conditional fixed effect ordered Logit estimates. Absolute values of t statistics are in parentheses, significance levels being equal to 1% (***), 5% (**) and 10% (*).The quasi ordered regressions also include the means over time of the time variant regressors, respectively age, number of persons in the household, marital status, financial situation improved in the last 12 months, financial situation deteriorated in the last 12 months and income ladder in column (2).