HAL Id: hal-00422502
https://hal.archives-ouvertes.fr/hal-00422502
Preprint submitted on 7 Oct 2009
HAL is a multi-disciplinary open access archive for the deposit and dissemination of sci-entific research documents, whether they are pub-lished or not. The documents may come from teaching and research institutions in France or abroad, or from public or private research centers.
L’archive ouverte pluridisciplinaire HAL, est destinée au dépôt et à la diffusion de documents scientifiques de niveau recherche, publiés ou non, émanant des établissements d’enseignement et de recherche français ou étrangers, des laboratoires publics ou privés.
Large shocks in U.S. macroeconomic time series:
1860–1988
Olivier Darné, Amélie Charles
To cite this version:
Olivier Darné, Amélie Charles. Large shocks in U.S. macroeconomic time series: 1860–1988. 2009. �hal-00422502�
EA 4272
Large shocks in U.S.
macroeconomic time series:
1860–1988
Olivier DARNE (*)
Amélie CHARLES (**)
2009/24
(*) LEMNA, Université de Nantes (**) Audencia Nantes, School of Management
Laboratoire d’Economie et de Management Nantes-Atlantique Université de Nantes
Chemin de la Censive du Tertre – BP 52231 44322 Nantes cedex 3 – France
D
o
cu
m
en
t
d
e
T
ra
va
il
W
o
rk
in
g
P
ap
er
Large shocks in U.S. macroeconomic
time series: 1860–1988
Olivier DARNÉ∗ and Amélie CHARLES†
Abstract
In this paper we examine the large shocks due to major economic or financial events that affected U.S. macroeconomic time series on the pe-riod 1860–1988, using outlier methodology. We show that these shocks can have temporary or permanent effects on the series and that most of them can be explained by the Great Depression, World War II and reces-sions as well as by monetary policy for the interest rate data. We also find that macroeconomic time series do not seem inconsistent with a stochastic trend once we adjusted the data of these shocks.
Keywords: Macroeconomic time series; unit root; outliers. JEL Classification: C22; N1.
∗LEMNA, University of Nantes. Corresponding author: LEMNA, University of Nantes,
IEMN–IAE, Chemin de la Censive du Tertre, BP 52231, 44322 Nantes, France. Email: [email protected].
1
Introduction
Since the influential paper of Nelson and Plosser (1982), much attention has been devoted to examining whether macroeconomic time series are trend or difference stationary. Indeed, if the series is trend stationary, and is thus characterized by stationary movements around a deterministic trend, a shock has temporary effect and the series returns to its steady trend after the shock. On the other hand, if the series is difference stationary (or has a unit root), and is therefore characterized by a random walk (possibly with a drift), a shock has persistent effect. As a result, the series does not return to its former path following a random disturbance, and the level of the series shifts permanently.
Applying the unit root tests developed by Dickey and Fuller (1979) on a wide variety of U.S. macroeconomic time series, Nelson and Plosser (1982) found that the null hypothesis of a unit root could be rejected for only one out of the fourteen macroeconomic time series in their data set, i.e. the unemployment rate. Their finding had a profound impact on the way economic series have been viewed and treated subsequently (Banerjee and Urga, 2005), especially if the series were indeed integrated, random shocks would have a permanent effect on the economy.
However, several authors pointed out that the tests employed by Nelson and Plosser have relatively low power against relevant trend-stationary alternatives (e.g., DeJong et al., 1992; Rudebush, 1992, 1993). Some studies then re-investigated the Nelson-Plosser findings by employing more powerful unit root tests (e.g., NcNown and Puttitanun; 2002)1. Nevertheless, another drawback of
these unit root tests is the presence of breaks. Perron (1989) and Rappoport and Reichlin (1989) demonstrated that unit root tests could not be used to distinguish between a segmented or changing deterministic trend and an unit root process. Indeed, they showed that if structural breaks were present in the data generating process but not allowed for in the specification of an econometric model, the analysis would be biased towards erroneous non-rejection of the unit root hypothesis2. They argued that the majority of shocks to the key economic
1
The Nelson-Plosser data set have been also examined from Bayesian approach (e.g., see DeJong and Whiteman, 1991, and the special 1991 issue of Journal of Applied Econometrics 6(4). A number of papers have subsequently used the analysis of the Nelson-Plosser data set in order to illustrate the use of new econometric tools.
2
More precisely, Perron (1989) and Rappoport and Reichlin (1989) demonstrated that unit root tests fail to reject the unit root null hypothesis when there is a break under the
trend-variables of any economy would be transitory and that only few (rare) events would have any permanent effect. A number of tests has been then developed to take into account a structural change in which the date of the break is a priori unknown3. Indeed, Zivot and Andrews (1992), among others, pointed out that
the specification and the choice of breakpoint in Perron (1989) was influenced by a prior examination of the data (exogenous structural break), and thus can lead to fallacious rejection of the unit root hypothesis. They therefore argued in favor of the need to view break points as endogenous and to develop procedures which took this endogeneity into account. In this way, many researchers revisited the Nelson-Plosser empirical results from using unit root tests with structural breaks, allowing for one (e.g., Zivot and Andrews, 1992; Li, 1995; Perron, 1997; Sen, 2004; Montañés et al., 2005) or two (Lumsdaine and Papell, 1997; Lee and Strazicich, 2003; Papell and Prodan, 2007) structural changes. Most of these studies tended to contradict the findings of Nelson-Plosser, i.e. there was less evidence in favor of the unit root hypothesis.
Nevertheless, the unit root tests with structural breaks impose a number of structural breaks without prior knowledge of their number what may strongly bias the results of the tests and the estimation of the dates of the structural changes. Indeed, Kim et al. (2000) showed that these tests, allowing for one break, can be biased when a second break is present but not taken in account. It can also be observed that these tests generally propose three models according to the type of breaks (changes in the intercept of the trend function, changes in the slope of the trend function, or changes in the intercept and the slope of the trend function) but do not select them. This can give different results depending on the model chosen (Sen, 2003). Recently, Montañés et al. (2005) used well-known information criteria to select the type of break and found that the results (unit root, model and break time) can vary according to selected information criteria. Furthermore, these endogenous break unit root tests tended to estimate the structural break incorrectly, leading to spurious rejection of the unit root null hypothesis (Lee and Strazicich, 2001)4.
Moreover, it has been shown that unit root tests can be disturbed by the
stationary alternative. Furthermore, Montañés and Reyes (1998), Leybourne et al. (1998) and Sen (2008) found that unit root tests spuriously reject the unit root null when there is a break under the null hypothesis.
3
See the special 1992 issue of Journal of Business an Economic Statistics 10(3).
4
See Appendix for selected studies on the estimated break dates in the Nelson-Plosser data set.
presence of outliers (Franses and Haldrup, 1994; Lucas, 1995; Shin et al., 1996; Yin and Maddala, 1997), especially additive outliers which affect only a single observation at some points in time series and not its future values. Indeed, the presence of additive outliers induces in the errors a negative moving-average component which causes the unit root tests to exhibit substantial size distortions towards rejecting the null hypothesis too often (Vogelsang, 1999)5.
For these reasons, we re-analyze the Nelson-Plosser data set from a new perspective. Firstly, we consider that the major economic events represent major shocks that occur infrequently (low-frequency shocks) but the time of their arrival is random. This approach results from the fact that there are numerous examples of random, heterogeneous and infrequent events that have a dramatic impact on the economy, especially for long-term economic series (e.g., oil crises, wars, financial slumps, changes of political regime, natural catastrophes, etc.). Therefore, we seek the presence of these shocks, which can have a permanent or temporary effect, in the form of outliers, providing a certain amount of information about the nature and magnitude of the economic shocks in the U.S. We also compare the estimated break dates obtained in some previous studies on Nelson-Plosser data set (Zivot and Andrews, 1992; Perron, 1997; Volgelsang, 1997; Lumsdaine and Papell, 1997; Hsu and Kuan, 2001; Lee and Strazicich, 2003; Papell and Prodan, 2007) with our detected outliers. Secondly, we seek the deterministic or stochastic nature of the trend in the Nelson-Plosser macroeconomic time series by applying efficient unit root tests – developed by Elliott, Rothenberg and Stock (1996) and Ng and Perron (2001)6–
on the series corrected by previously detected outliers. This approach allows to distinguish between frequent small shocks due to period-by-period permanent innovations (as in the case of a stochastic trend) and infrequent large shocks due to significant economic and financial events. Our results point out the presence of a unit root for thirteen out of the fourteen series in the Nelson-Plosser data set, and therefore confirm the findings of Nelson and Plosser (1982), namely U.S. macroeconomic time series do not seem inconsistent with a stochastic trend.
The outline of the paper is as follows. In Section 2, the methodology for detecting outliers is described, and the detected outliers which can be associated
5
Vogelsang (1999), Perron and Rodriguez (2003b) and Haldrup and Sansó (2008) suggested procedures for detecting multiple additive outliers in nonstationary time series.
6
Perron and Rodriguez (2003a) extended the unit root tests developed by Elliott et al. (1996) and Ng and Perron (2001) to the case where a change in the trend function is allowed to occur at unknown time. However, their tests take into account only one structural change.
to some major economic or financial events are discussed in Section 3. Section 4 presents the unit root tests and interprets the results. Section 5 concludes.
2
Outlier Methodology
The search for outliers considers an unobserved components model in which there are two components: a regular component and an outlier component. This outlier component reflects extraordinary, infrequently occurring events or shocks that have important effects on macroeconomic time series. The model is given by zt= yt+ f (t) (1) where yt= θ(L) α(L)φ(L)at at∼ N (0, σ 2 a) (2)
yt is an ARIMA(p, d, q) process and f(t) contains exogenous disturbances or
outliers. Following Chen and Liu (1993), we will consider four types of outliers: additive outlier (AO), innovation outlier (IO), level shift (LS), and temporary change (TC). The models for different f(t) are as follows
AO: f (t)AO = ωAOIt(τ )
LS: f (t)LS = [1/(1 − L)]ωLSIt(τ )
IO: f (t)IO= [θ(L)/α(L)φ(L)]ωIOIt(τ )
TC: f (t)T C = [1/(1 − δL)]ωT CIt(τ ) (3)
where ωi, i = AO, IO, LS, TC, denotes the magnitudes of the outlier, and It(τ )
is an indicator function with the value of 1 at time t = τ and 0 otherwise, with τ the date of outlier occurring.
These outliers affect the observations differently: AO causes an immediate and one-shot effect on the observed series; LS produces an abrupt and permanent step change in the series (permanent shock); TC produces an initial effect, and this effect dies out gradually with time, where the parameter δ is designed to model the pace of the dynamic dampening effect (0 < δ < 1); the effect of IO is more intricate than the effects of the others types of outliers7. IO will produce
7
Indeed, except for the case of IO, the effects of outliers on the observed series are independent of the model.
a temporary effect for a stationary series whereas it will produce a permanent level shift for a nonstationary series (see Chen and Liu, 1993).
It is considered that AOs and IOs are outliers which are related to an exogenous and endogenous change in the series, respectively, and that TCs and LSs are more in the nature of structural changes. TCs represent ephemeral shifts in a series whereas LSs are more the reflection of permanent shocks. However, IOs will have a relatively persistent effect on the level of the series. Note that level shifts and (nonstationary) innovative outliers detected in level of the time series correspond to additive or innovative outliers in first-difference, i.e. in growth rates (Balke and Fomby, 1991; Maddala and Kim, 2000).
The methods are well-developed in the field of outlier detection based on intervention analysis as originally proposed by Box and Tiao (1975). This ap-proach requires iterations between stages of outlier detection and estimation of an intervention model. Procedures considered by Chang et al. (1988) and Tsay (1988) are quite effective in detecting the locations and estimating the effects of large isolated outliers. However, these procedures display some drawbacks: (i) the presence of outliers may result in an inappropriate model; (ii) even if the model is appropriately specified, outliers in a time series may still produce bias in parameter estimates and hence may affect the efficiency of outlier de-tection; and (iii) some outliers can not be identified due to a masking effect. To overcome these problems, Chen and Liu (1993) proposed an iterative outlier detection and adjustment procedure to obtain joint estimates of model param-eters and outlier effects. In their procedure the types and effects of outliers are obtained based on less contaminated estimates of model parameters, the outlier effects are estimated simultaneously using multiple regression, and the model parameters and the outlier effects (ωi) are estimated jointly8. Here we use the
Chen-Liu method modified by Gómez and Maravall (1997)9. This procedure is
described below.
8
From a simulation study, Chen and Liu (1993) showed that their procedure performs well in terms of detecting outliers and obtaining unbiased parameter estimates.
9
Gómez and Maravall (1997) implemented this method in the computer program TRAMO. Franses and Haldrup (1994), Tolvi (2001) and Darné and Diebolt (2004) also used this method to detect and correct outliers in macroeconomic series whereas Balke and Fomby (1991, 1994) and Bradley and Jansen (1995) applied that of Tsay (1988).
An ARIMA model is fitted to yt in (2) and the residuals are obtained
ˆ
at= π(B)zt (4)
where π(B) = α(B)φ(B)/θ(B) = 1 − π1B − π2B2− . . . .
For the four types of outliers in (1), the equation (4) becomes AO: ˆat= at+ ωAOπ(B)It(τ )
IO: ˆat= at+ ωIOIt(τ )
LS: ˆat= at+ ωLS[π(B)/(1 − B)]It(τ )
TC: ˆat= at+ ωT C[π(B)/(1 − δB)]It(τ )
These expressions can be viewed as a regression model for ˆat, i.e.,
ˆ
at= ωixi,t+ at i = AO, IO, LS, TC,
with xi,t = 0 for all i and t < τ , xi,t = 1 for all i and t = τ , and for t > τ and
k ≥ 1, xAO,t+k= −πk (AO), xIO,t+k= 0 (IO), xLS,t+k = 1 −Pkj=1πj (LS) and
xT C,t+k = δk−Pk−1j=1δk−jπj− πk (TC).
The detection of the outliers is based on likelihood ratio [LR] statistics, given by AO: τˆAO(τ ) = [ˆωAO(τ )/ˆσa]/ ¡ n X t=τ x2AO,t¢1/2 IO: τˆIO(τ ) = ˆωIO(τ )/ˆσa LS: τˆLS(τ ) = [ˆωLS(τ )/ˆσa]/ ¡ n X t=τ x2 LS,t ¢1/2 TC: τˆT C(τ ) = [ˆωT C(τ )/ˆσa]/¡ n X t=τ x2 T C,t ¢1/2 with ωˆi(τ ) = n X t=τ ˆ atxi,t/ n X t=τ x2
i,t for i = AO, LS, TC,
and ωˆIO(τ ) = ˆaτ
where ˆωi(τ ) (i = AO, IO, LS, TC) denotes the estimation of the outlier impact
at time t = τ , and ˆσa is an estimate of the variance of the residual process
(Chang et al., 1988).
Outliers are identified through running a sequential detection procedure, consisting of an outer and an inner iterations. In the outer iteration, assuming that there are no outliers, an initial ARIMA(p, d, q) model is estimated and the
residuals are obtained (ˆat). The results from the outer iteration are then used in
the inner iteration to identify outliers. The LR test statistics for the four types of outliers are calculated for each observations. The largest absolute value of these test statistics
ˆ
τmax = max|ˆτi(τ )| i = AO, IO, LS, TC and τ = 1, . . . , T
is compared to a critical value, and if the test statistic is larger, an outlier is found at time t = τ1 and its type is selected (i∗). When an outlier is detected,
the effect of the outlier is removed from the data as follows: the observation zt
is adjusted at time t = τ1 to obtain the corrected ytvia (1) using the estimated
magnitude ˆωi∗ and the appropriate structure of outlier f(t)i∗ as in (3), i.e.
yt= zt− f (t)i∗
Then, we compare the second largest absolute value of the LR statistics for the four types of outliers to the critical value, i.e. ˆτmax = max|ˆτi(τ )| with
τ 6= τ1, and so on. This process is repeated until no more outliers can be found.
Next, return to the outer iteration in which another ARIMA(p, d, q) model is re-estimated from the outlier-corrected data, and start the inner iteration again. This procedure is repeated until no outlier is found. Finally, a multiple regression is performed on the various outliers detected to identify (possible) spurious outliers10.
Note that estimating the initial ARIMA(p, d, q) model can lead to misidentify level shifts as innovational outliers or not detect them. To better determine whether the outliers can be considered as permanent or not, an outlier search will be conducted using the series in levels, i.e. from an ARIMA(p, 0, q) (Balke and Fomby, 1991; Balke, 1993).
3
Infrequent Large Shocks and Nelson-Plosser data
set
We study the 14 annual U.S. macroeconomic data set used by Nelson and Plosser (1982): Real GNP, nominal GNP, real per capita GNP industrial production, employment, unemployment, GNP deflator, consumer price, nominal wages, real wages, money stock, velocity, interest rate, and stock price. The data consists
10
of annual observations which begins between 1860 and 1909. In this paper we consider an extension of the Nelson-Plosser data set to include the observations up to 1988. This extension was compiled by Schotman and van Dijk (1991). The logarithmic transformation is applied on the data, except for the interest rate.
3.1 Descriptive Statistics
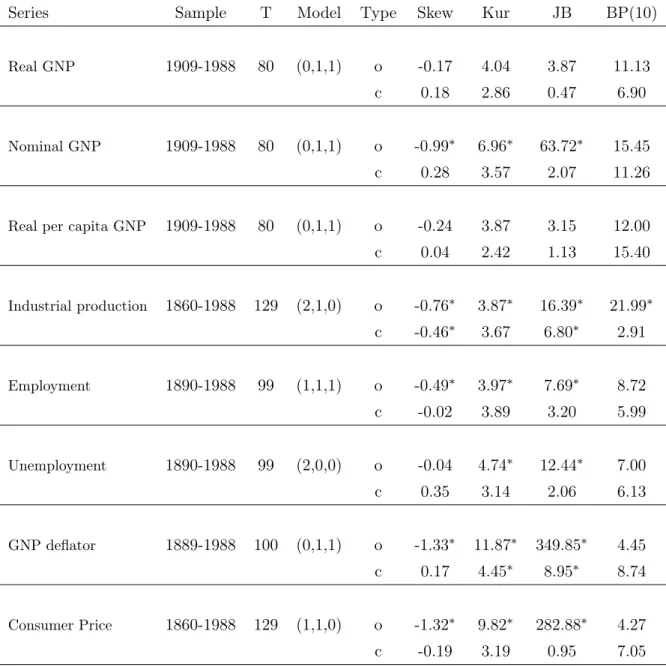
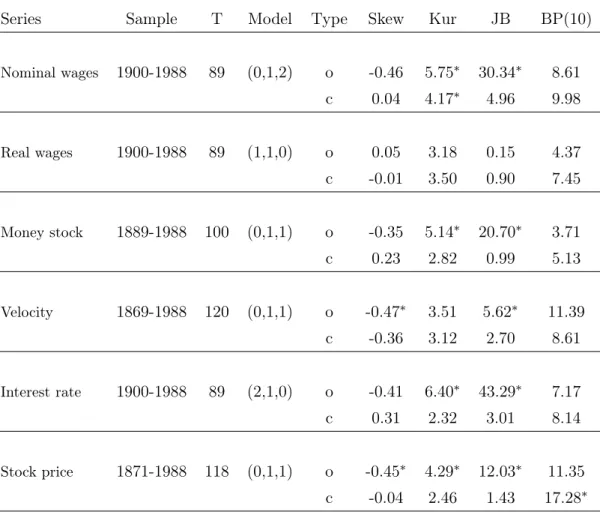
Tables 1 and 2 display the ARIMA specifications for all the variables. As suggested by Andreou and Spanos (2003), we also report some descriptive statistics from ARIMA models to assess statistical adequacy11: normality,
non-autocorrelation, homoskedasticity and linearity (Tables 3 and 4). The normality coefficients used are skewness, kurtosis and Jarque-Bera. We employ the Box-Pierce [BP] test for the non-autocorrelation, the Lagrange Multiplier [LM] test for the homoskedasticity (Engle, 1982) and the BDS test statistic for the non-linearity (Brock, Dechert and Scheinkman, 1987).
Most of the original series indicate significant skewness and excess kurtosis implying that the assumption of gaussian errors is not appropriate. As shown by Balke and Fomby (1994), outliers may cause significant skewness and excess kurtosis in macroeconomic time series. Indeed, these measures of non-normality decrease, sometimes quite dramatically, after correcting outliers. Evidence of excess skewness and excess kurtosis disappears for all the series, except for the industrial production, the GNP deflator and the nominal wages.
The BP statistics are not significant for all (outlier unadjusted and adjusted) series. This means that there is no serial linear correlation, except in the stock price which displays a BP test significant when the data are corrected of outliers. This autocorrelation can be due to the presence of heteroscedasticity. In this context, we apply the Box-Pierce test corrected of conditional heteroscedasticity. This statistic appears insignificant, implying that there is no serial linear correlation in the stock price.
The data does not seem contain conditional heteroscedasticity since the LM tests are not significant for most of series. Moreover, the interest rate, the stock price, the nominal GNP and the industrial production display a significant LM
11
Andreou and Spanos (2003) showed that several estimated models by Nelson and Plosser (1982) could be misspecified, thus potentially biasing the performance of the unit root tests. Based on estimated models which are statistically adequate, they obtained different conclusions on the unit root hypothesis.
test when the data are not corrected of outliers. Nevertheless, when these series are cleaned of outliers, the test become insignificant. This result confirms that of van Dijk et al. (2002) who showed that if outliers are neglected, the LM test rejects the null hypothesis of conditional homoscedasticity too often when it is true. The exception is the velocity which seems to present conditional heteroscedasticity even if the data are corrected of outliers.
Finally, to test for general non-linearity we apply the most widely used test: the BDS test. From Tables 3 and 4, we observe that all the uncorrected data, except the real wages and the stock prices, display non-linearity. However, the BDS test becomes insignificant when the outliers are removed for most of them. This result is consistent with that of Balke and Fomby (1994). Indeed, these authors showed that after fitting the outlier model and controlling for the effects of the outliers, the evidence of non-linearity in fifteen post-World War II macroeconomic time series is substantially weaker. The nominal GNP and wages, the industrial production and the velocity have strong evidence of non-linearity even after removing the effect of outliers12.
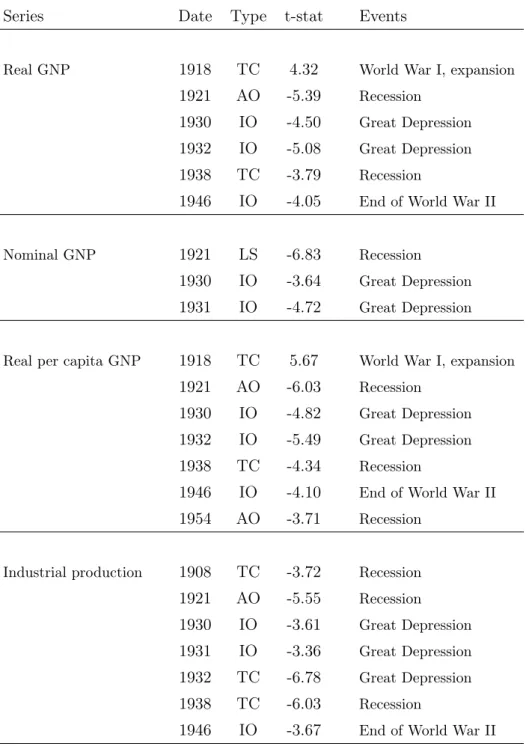
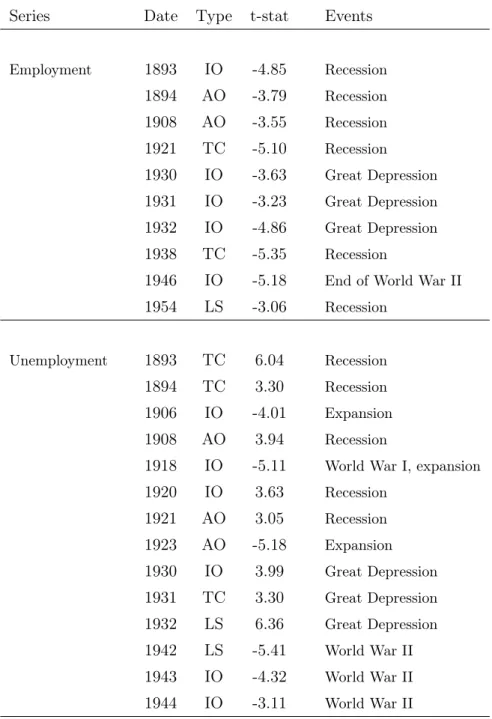
3.2 Infrequent Large Shocks
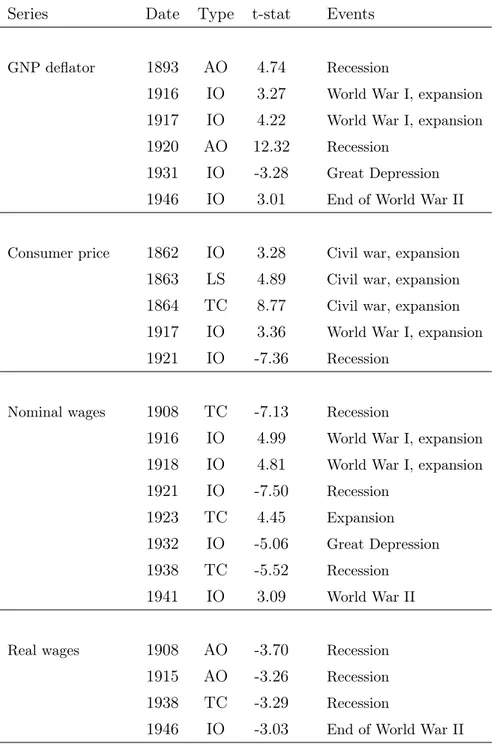
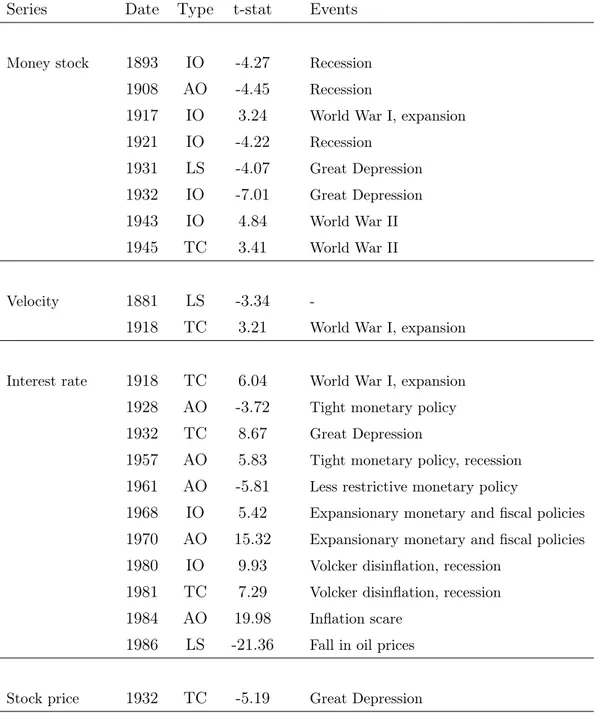
In Tables 5-8, all detected outliers are given by series, with their type, timing and t-statistics. In addition, we also try to associate the date of each outlier to a specific event that occurred near that date.
As expected, outliers are detected in all the series, giving strong proof of infrequent large shocks. Most of the shocks have a temporary effect but seven out of fourteen series experience a permanent shock13. As suggested by Balke
and Fomby (1994) and Darné and Diebolt (2004), it can also be noted that most of the series experienced an infrequent large shock due to the Great Depression, World War II and recessions14. Below we examine further the detected outliers
that are linked with identifiable economic events for all the series. Since there is a clustering of outliers across series, i.e. an event can cause infrequent large shocks in different series, we describe chronologically the economic events which
12
The non-linearity displays by the velocity can be explained by the presence of conditional heteroscedasticity.
13
Note that using the ARIMA(0,1,0) model to improve the power of level shift detection, no level shift is misidentified as innovative outliers.
14
Blanchard and Simon (2001) argued that “recessions are largely the result of infrequent large shocks - indeed, sufficiently large and identifiable that they often have names: the first and second oil shocks, the Volcker disinflation, and so on”.
could affect the series.
The expansion of 1862-1864 during the U.S. civil war can explain the positive shocks experienced by the consumer price. The shocks in 1893 and 1894 can be caused by the recession of 1893-1894. In 1893, some railroad companies were placed in receivership, heralding the panic of 1893. Indeed, the stock prices declined sharply, involving hundreds of business failures and bank closings15.
The negative shock in 1906 can be explained by the expansion of 1905-1906 which was characterized by the growth of the productive system, in particular the construction of railroads. The negative shock detected in 1908 can be due to the short, but extremely severe, recession of 1907-1908. Indeed, in 1906 the Bank of England decided to discriminate against American finance bills and, along with other European central banks, to raise interest rates. These actions attracted gold import and sharply reduced the flow of gold to the U.S. and thus involved the financial and banking panic of 190716.
The shocks in 1916, 1917 and 1918 can be caused by World War I and the expansion of 1915-1918. This period was characterized by high inflation which reflected massive gold imports from the European belligerents buying war materiel as well as inflationary finance once the U.S. entered the war in 1917 (Bordo and Haubrich, 2004). The recession of 1920-1921 can explain the negative shocks identified in 1920 and 1921. This recession can be caused by the inflationary financing during World War I which involved the U.S. to lead a deflationary policy. The shocks in 1923 can be due to the rapid recovery which followed the recession.
The shock in 1928 can be attributed to the tight monetary policy led by the Fed to contain developing stock market bubble, which was perceived as a threat to the continued progress and stability of the economy (Orphanides, 2003). This tight policy led into the stock market crash of October 1929 and the beginning of the Great Depression. All the series, except the consumer price, the real wages and the velocity, experienced large shocks detected in 1930, 1931 and 1932 which can be caused by the Great Depression during the 1930s in U.S. following the stock market crash in 1929. Indeed, the period 1929-1933
15
Carlson (2005) suggested that real economic shocks were important determinants of the nationwide scope of the panic of 1893, however at the local level, liquidity concerns are found to be a more important trigger of bank panics.
16
Odell and Weidenmier (2004) analyzed links between the 1906 San Francisco earthquake and the panic of 1907. Note that this panic led to an important change in American financial architecture: the creation of the Federal Reserve System that was established in 1913.
consisted of a decline in economic activity, characterized by repeated failures of the new Federal Reserve System to offset the monetary collapse triggered by several waves of banking panics (Friedman and Schwartz, 1963). The recession of 1937-1938 can explain the negative shocks in 1938. This recession can be explained by a decline of economic activity and the reduction of the finance public deficit. Friedman and Schwartz (1963) attributed this downturn to a monetary contraction resulting from an increase in reserve requirements.
World War II had a strong impact on the period 1942-44 due to the large rise in military spending as soon as the U.S. had entered in war. During World War II, government expenditures were financed primarily by issuing debt. The U.S. economy was strongly affected in 1946 by the end of World War II due to the readjustments in the economy after the wartime economy.
The post-WWII infrequent large shocks are only experienced by the interest rate series, except the employment and the real per capita GDP in 1954. The negative shocks in 1954 can be explained by the short recession of 1953-1954 which was due to the readjustments in the expenditures after the end of the Korean war.
The shock in 1957 can be attributed to the fear of inflation which led the Fed to tight monetary policy17. The less restrictive monetary policy led by the Fed,
especially to avoid the aggravation of payments balance deficit, can explain the shock in 1961. The shocks in 1968 and 1970 can be caused by U.S. expansionary monetary and fiscal policies to finance social programs and the Vietnam War from 1968 which implied the recession of 1970. The shocks in 1980 and 1981 can be due to the Volcker aggressive disinflationary policy to stabilize the inflation and the economy which was accompanied by a severe recession. The shock in 1984 can be explained by the preemptive interest rate policy actions led by the Fed in 1983-84 to contain the inflation scare (Goodfriend, 2005) or can be ow-ing to the substantial federal budget deficit that began in 1981 (Campbell and Clarida, 1987). Finally, the shock in 1986 can be owing to an oil price decline as well as the importance of the strong dollar (Poole, 1988).
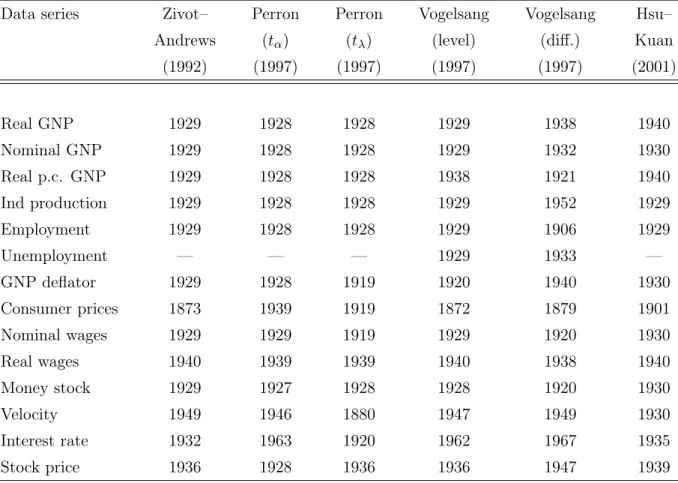
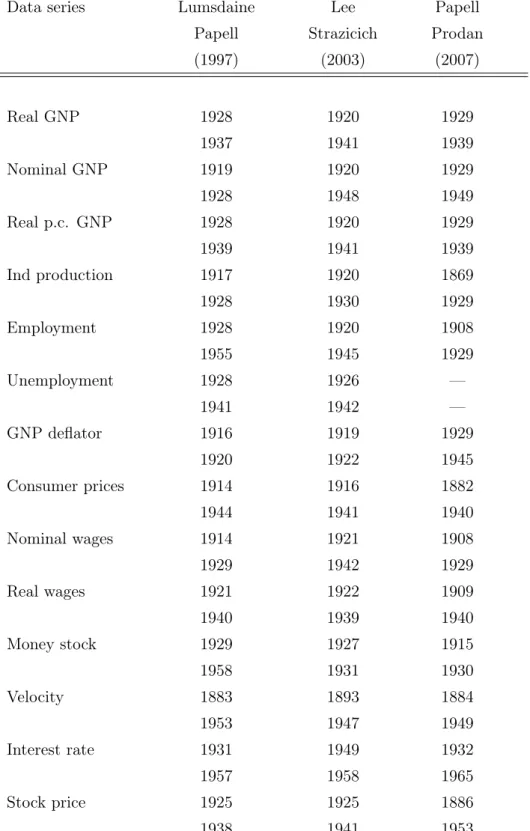
We compare the estimated break dates obtained in some previous studies on Nelson-Plosser data set with our detected outliers (see Tables 10-11 in Appendix). The selected studies are the tests for detecting breaks proposed
17
See Friedman and Schwartz (1963), Romer and Romer (1989) and Taylor (1998), inter alia, for a discussion on U.S. monetary history and policy.
by Volgelsang (1997) (from level [V1] and first-difference [V2] statistics) and Hsu and Kuan (2001) [HK] as well as the unit root tests with one structural break suggested by Zivot and Andrews (1992) [ZA] and Perron (1997) (from two different statistics, [P1] and [P2]) and with two structural breaks proposed by Lumsdaine and Papell (1997) [LP], Lee and Strazicich (2003) [LS] and Papell and Prodan (2007) [PP]. Note that the estimated break dates from these studies are sometimes very different.
Most of the estimated break dates are close to the detected outliers with the higher t-statistics for all the series except for the stock price18. If T
B is the
location of outliers, the corresponding estimated breaks are often located at TB ± 1 or ±2. This result confirms that obtained by Lee and Strazicich
(2001) who argued that the endogenous break unit root tests tend to incorrectly estimate the structural break.
Much breaks are estimated in the beginning of the 1920s and the 1930s as well as the end of the 1930s by the various tests. The shocks identified in 1920 and 1921 are generally located in 1919 and 1920 for the real (LS) and nominal GNP (LP, LS), the GNP deflator (P2, V1, LP), the consumer prices (P2), the nominal wages (P2, V2) and the money stock (V2). LS found these breaks for most of the series whereas ZA, P1, HK and PP did not identify shocks due to the recession of 1920-1921. The outliers identified in the beginning of the 1930s are estimated in 1928 or 1929 for the GNP series as well as for the industrial production, the employment, the nominal wages and the money stock by the various tests, and in 1930 for some series by HK. The recession in 1938 is estimated in 1937, 1938, 1939 and 1940 for the real (p.c.) GNP and the real wages according to the different tests.
Some estimated breaks correspond to detected outliers but only for a few of tests. For the GNP deflator, the shock in 1917 is located in 1916 by LP and the shock in 1946 is estimated in 1945 by PP. The shock in 1917 for the consumer prices is identified in 1916 by LS. For the wages series, the shock in 1908 is located in 1908 (nominal) and 1909 (real) by PP, whereas the shocks in 1916 and in 1941 are estimated in 1914 by LP and in 1942 by LS, respectively. For the employment, the shock in 1908 is located in 1906 by V2 and in 1908 by PP, whereas the shock in 1954 is estimated in 1955 by LP and that of 1946 in 1945 by LS. The shock in 1917 for the money stock is estimated in 1915 by PP. For
18
The outliers with the higher t-statistics for the interest rate are not located by the various tests as they investigated the Nelson-Plosser data set until 1970.
the interest rate, the shock in 1957 is located in 1957 and in 1958 by LP and LS, respectively; the shock in 1961 is estimated in 1962 and in 1963 by V1 and P1, respectively; and the shock in 1968 is identified in 1967 by V2. The shock in 1881 for the velocity is estimated in 1880 by P2, in 1883 by LP and in 1884 by PP.
Finally, the locations of the estimated breaks for the consumer prices, the velocity and the stock prices are very different than those of the detected outliers.
4
Application of Unit Root Tests
Since the outliers can seriously affect the unit root tests (e.g., Franses and Haldrup, 1994; Lucas, 1995), we apply two efficient unit root tests proposed by Elliott, Rothenberg and Stock (1996) [ERS] and Ng and Perron (2001) [NP] on the outlier-adjusted Nelson-Plosser data set19.
ERS (1996) developed a unit root test based on a quasi-difference detrending of the series in order to increase power of Dickey-Fuller (1979) tests. They suggested the Dickey-Fuller generalized least squares (DF-GLS) test using the following regression ∆ydt = β0ydt−1+ k X j=1 βj∆yt−jd + εt where yd
t is the locally detrended series yt. The DF-GLS t-test is performed by
testing the null hypothesis β0 = 0 against the alternative β0 < 0. The local
detrending series is defined by
ydt = yt− ˆψ′zt
where zt equals to 1 for the constant mean case, and (1, t) for the linear trend
case, and ˆψ is the GLS estimator obtained by regressing ¯y on ¯z where ¯
y = (y1, (1 − ¯αB)y2, . . . , (1 − ¯αB)yT)′
¯
z = (z1, (1 − ¯αB)z2, . . . , (1 − ¯αB)zT)′
19
Darné and Diebolt (2004) studied the sensitivity of the unit root tests to the two-steps tests (correcting outliers and testing unit roots on outlier-adjusted data) from simulation experiments. They showed that this procedure does not affect the presence of unit roots in time series. Osborn, Heravi and Birchenhall (1999) also used this procedure for testing seasonal unit roots.
and ¯α = 1 + ¯c/T . ERS advise ¯c = −7 for the constant mean case and ¯c = −13.5 for the linear trend case.
Ng and Perron (2001) proposed modifications of the Phillips and Perron (1988) test, which is a non-parametric approach to correct residual autocor-relation by modifying the Dickey-Fuller test statistics, first, to correct the size distortions (as suggested by Perron and Ng, 1996), second, to improve the power (as suggested by ERS, 1996). The NP test is based on the following regression
∆˜yt= (ˆδ − 1)˜yt−1+ k X j=1 ˆ φj∆˜yt−j+ ˆεt
where ˜yt is the locally detrended series yt. Under the unit root null hypothesis,
ˆ
δ = 1; thus the NP test statistics, called M-GLS tests, are
M Zt = ¡T−1y˜T2 − s 2¢ Ã 4s2T−2 T X t=1 ˜ y2t−1 !−1/2 M Za = ¡T−1y˜T2 − s2 ¢ Ã 2T−2 T X t=1 ˜ y2 t−1 !−1
where s is the autoregressive spectral density estimator of the long-term variance.
Furthermore, Ng and Perron (2001) showed that the popular Akaike and Schwarz information criteria are not sufficiently flexible for unit root tests, mainly when there are negative moving-average errors, to select the appropriate number of lags k20in the regression. They therefore suggested the use of
Mod-ified Information Criteria (MIC) that gives better results when an appropriate value for lags k is chosen for the DF-GLS and M-GLS tests.
The results of unit root test are displayed in Table 9. The lag order k in the regression is selected by using the MIC. The efficient unit root tests for all the variables do not reject the unit root null hypothesis at the 5% level21, except for
20
Ng and Perron (2001) argued that the Akaike and Schwarz information criteria tend to select values of k that are generally too small for unit root tests to have good sizes.
21
Since the nominal GNP, the industrial production, the nominal wages and the velocity present some non-linearity we also used the nonlinear unit root test proposed by Kapetanios et al. (2003). The unit root test developed by Seo (1999) is also applied on the velocity in which conditional heteroscedasticity has been detected. The results obtained from these unit root tests are identical with those from the efficient unit root tests.
the unemployment. Contrary to the recent studies on the Nelson-Plosser data set, this result confirms the findings of Nelson and Plosser (1982), namely 13 of the 14 macroeconomic time series of interest have a stochastic trend22. These
differences may result from (i) the presence of non-linearity, (ii) the presence of outliers, (iii) the imposing of a maximum of one or two breaks in the series, and (iv) the choice of model studied according to the type of break.
5
Conclusion
This paper examined the presence of large, but infrequent shocks due to major economic or financial events on U.S. macroeconomic time series, using outlier methodology. We showed that these shocks can have temporary or permanent effects on the series and that most of them can be explained by the Great Depression, World War II and recessions as well as by monetary policy for the interest rate data. Furthermore, once we adjusted the data of these outliers, our results pointed out the presence of a unit root for 13 of the 14 Nelson-Plosser macroeconomic time series. This result contradicts the recent studies on the Nelson-Plosser data set in which they found less evidence in favor of the unit root hypothesis. Therefore, as suggested by Nelson and Plosser (1982), macroeconomic time series do not seem inconsistent with a stochastic trend.
22
From unit root tests with two structural breaks, at the 5% significance level, the null of unit root is rejected for six series – real (p.c.) and nominal GNP, industrial production, employment and unemployment – with the Lumsdaine-Papell test; for four series – industrial production, unemployment, real wage and money stock – with the Lee-Strazicich test; and for three series – real (p.c.) GNP and employment – with the Papell-Prodan test when considering model A in all series and model C for the real wages and the stock prices. Note that Papell and Prodan (2007) did not study the unemployment.
References
[1] Andreou, E., Spanos, A., 2003. Statistical adequacy and the testing of trend versus difference stationarity and comments. Econometric Reviews 22, 217-267.
[2] Balke, N.S., 1993. Detecting level shifts in time series. Journal of Business and Economic Statistics 11, 81-92.
[3] Balke, N.S., Fomby, T.B., 1991. Shifting trends, segmented trends, and infrequent permanent shocks. Journal of Monetary Economics 28, 61-85. [4] Balke, N.S., Fomby, T.B., 1994. Large shocks, small shocks, and economic
fluctuations: Outliers in macroeconomic time series. Journal of Applied Econometrics 9, 181-200.
[5] Banerjee, A., Urga, G., 2005. Modelling structural breaks, long memory and stock market volatility: An overview. Journal of Econometrics 129, 1-34.
[6] Blanchard, O., Simon, J., 2001. The long and large decline in U.S. output volatility. Brookings Papers on Economic Activity, 1:2001, 135-174. [7] Bordo, M.D., Haubrich, J.G., 2004. The yield curve, recessions, and the
credibility of the monetary regime: Long-run evidence, 1875-1997. Working Paper No 04-02, Federal Reserve Bank of Cleveland.
[8] Box, G.E.P., Tiao, G.C., 1975. Intervention analysis with applications to economic and environmental problems. Journal of the American Statistical Association 70, 70-79.
[9] Bradley, M.D., Jansen, D.W., 1995. Unit roots and infrequent large shocks: New international evidence on output growth. Journal of Money, Credit, and Banking 27, 876-893.
[10] Brock, W.A., Dechert, W.D., Scheinkman, J.A., 1987. A test for independence based on the correlation dimension. Econometric Reviews„ 15, 197-235.
[11] Campbell, J.Y., Clarida, R.H., 1987. The dollar and real interest rates. NBER Working Paper No 2151.
[12] Carlson, M., 2005. Causes of bank suspensions in the panic of 1893. Explorations in Economic History 42, 56-80.
[13] Chang, I., Tiao, G.C., Chen, C., 1988. Estimation of time series parameters in the presence of outliers. Technometrics 30, 193-204.
[14] Chen, C., Liu, L.M., 1993. Joint estimation of model parameters and outlier effects in time series. Journal of the American Statistical Association 88, 284-297.
[15] Chen, C., Tiao, G.C., 1990. Random level-shift time series model, ARIMA approximations, and level-shift detection. Journal of Business and Economic Statistics 8, 83-97.
[16] Darné, O., Diebolt, C., 2004. Unit roots and infrequent large shocks: New international evidence on output. Journal of Monetary Economics 51, 1449-1465.
[17] DeJong, D.N., Nankervis, J.C., Savin, N.E., Whiteman, C.H., 1992. The power problems of unit root tests in time series with autoregressive errors. Journal of Econometrics 53, 323-343.
[18] DeJong, D.N., Whiteman, C.H., 1991. Reconsidering "Trends and random walks in macroeconomic time series". Journal of Monetary Economics 28, 221-254.
[19] Durbin, J., Koopman, S.J., 2001. Time Series Analysis by State Space Methods. Oxford University Press, Oxford.
[20] Elliott, G., Rothenberg, T.J., Stock, J.H., 1996. Efficient tests for an autoregressive unit root. Econometrica 64, 813-836.
[21] Engle, R.F., 1982. Autoregressive conditional heteroscedasticity with estimates of the variance of United Kingdom inflations. Econometrica 50, 987-1007.
[22] Franses, P.H., Haldrup, N., 1994. The effects of additive outliers on tests for unit roots and cointegration. Journal of Business and Economic Statistics 12, 471-478.
[23] Friedman, M., Schwartz, A.J., 1963. A Monetary History of the United States, 1867-1960. Princeton University Press, Princeton.
[24] Gómez, V., Maravall, A., 1997. Programs TRAMO and SEATS: Instruc-tions for the user (Beta version: June 1997). Working paper No 97001, Ministerio de Economía y Hacienda, Dirección General de Análisis y Pro-gramación Presupuestaria.
[25] Goodfriend, M., 2005. The monetary policy debate since October 1979: Lessons for theory and practice. Federal Reserve Bank of St. Louis Review (march/april 2005), 243-262.
[26] Haldrup, N., Sanó, A. , 2008. A note on the Vogelsang test for additive outliers. Statistics and Probability Letters 78, 296-300.
[27] Hsu, C-C., Kuan, C-M., 2001. Distinguishing between trend-break models: Method and empirical evidence. Econometrics Journal 4, 171-190.
[28] Kapetanios, G., Shin, Y., Snell, A., 2003. Testing for a unit root in the nonlinear STAR framework. Journal of Econometrics 112, 359-379.
[29] Kim, T-H., Leybourne, S.J., Newbold, P., 2000. Spurious rejections by Perron tests in the presence of a break, Oxford Bulletin of Economics and Statistics 62, 433-444.
[30] Lee J., Strazicich, M.C., 2003. Break point estimation and spurious rejections with endogenous unit root tests. Oxford Bulletin of Economics and Statistics 68, 535-558.
[31] Lee J., Strazicich, M.C., 2003. Minimum Lagrange multiplier unit root test with two structural break. The Review of Economics and Statistics 85, 1082-1089.
[32] Leybourne, S.J., Mills, T.C., Newbold, P., 1998. Spurious rejections by Dickey-Fuller tests in the presence of a break under the null, Journal of Econometrics 87, 191-203.
[33] Li, H., 1995. A re-examination of the Nelson-Plosser data set using recursive and sequential tests. Empirical Economics 20, 501-518.
[34] Lucas, A., 1995. An outlier robust unit root test with an application to the extended Nelson-Plosser data. Journal of Econometrics 66, 153-173. [35] Lumsdaine, R.L., Papell, D.H., 1997. Multiple trend breaks and the
[36] Maddala, G.S., Kim, I-M., 2000. Unit Roots, Cointegration and Structural Change. Cambridge University Press, Cambridge.
[37] Montañés, A., Reyes, M., 1998. Effect of a shift in the trend function on Dickey-Fuller unit root tests, Econometric Theory 14, 355-363.
[38] Montañés, A., Olloqui, I., Calvo, E., 2005. Selection of the break in the Perron-type tests. Journal of Econometrics 129, 41-64.
[39] Murray, C.J., Nelson, C.R., Zivot, E., 2003. Why are Beveridge-Nelson and unobserved component decomposition of GDP so different. Review of Economics and Statistics 85, 235-243.
[40] Nelson, C.R., Plosser, C.I., 1982. Trends and random walks in macroeco-nomic time series. Journal of Monetary Ecomacroeco-nomics 10, 139-162.
[41] NcNown, R., Puttitanun, T., 2002. New unit root tests of the Nelson-Plosser data. Applied Economics Letters 9, 9-11.
[42] Ng, S., Perron, P., 2001. Lag length selection and the construction of unit root tests with good size and power. Econometrica 69, 1519-1554.
[43] Odell, K.A., Weidenmier, M.D., 2004. Real shock, monetary aftershock: The 1906 San Francisco earthquake and the panic of 1907. Journal of Economic History 64, 1002-1027.
[44] Orphanides, A., 2003. Historical monetary policy analysis and the Taylor rule. Journal of Monetary Economics 50, 983-1022.
[45] Osborn, D.R., Heravi, S., Birchenhall, C.R., 1999. Seasonal unit roots and forecasts of two-digit European industrial production. International Journal of Forecasting 15, 27-47.
[46] Papell, D.H., Prodan, R., 2007. Restricted structural change and the unit root hypothesis. Economic Inquiry 45, 834-853.
[47] Perron, P., 1989. The great crash, the oil price shock, and the unit root hypothesis. Econometrica 57, 1361-1401.
[48] Perron, P., 1997. Further evidence on breaking trend functions in macroeconomic variables. Journal of Econometrics 80, 355-385.
[49] Perron, P., Ng, S., 1996. Useful modifications to unit root tests with dependent errors and their local asymptotic properties. Review of Economic Studies 63, 435-465.
[50] Perron, P., Rodriguez, G., 2003a. GLS detrending, efficient unit root tests and structural change. Journal of Econometrics 115, 1-27.
[51] Perron, P., Rodriguez, G., 2003b. Searching for additive outliers in nonstationary time series. Journal of Time Series Analisis 24, 193Ű220. [52] Phillips, P.C.B., Perron, P., 1988. Testing for unit root in time series
regression. Biometrika 75, 347-353.
[53] Poole, W., 1988. Monetary policy lessons of recent inflation and disinflation. Journal of Economic Perspectives 2, 73-100.
[54] Romer, C., Romer, D., 1989. Does monetary policy matter? A new test in the spirit of Friedman and Schwartz. NBER Working Paper No 2966. [55] Rappoport, P., Reichlin, L., 1989. Segmented trends and non-stationary
time series. The Economic Journal 99, 168-177.
[56] Rudebusch, G., 1992. Trends and random walk in macroeconomic time series: A re-examination. International Economic Review 33, 661-680. [57] Rudebusch, G., 1993. The uncertain unit root in real GNP. American
Economic Review 83, 264-272.
[58] Schotman, P., van Dijk, H.K., 1991. On Bayesian routes to unit roots. Journal of Applied Econometrics 6, 387-401.
[59] Sen, A., 2003. On unit-root tests when the alternative is a trend-break stationary process. Journal of Business and Economic Statistics 21, 174-184.
[60] Sen, A., 2004. Are U.S. macroeconomic series difference stationary or trend-break stationary? Applied Economics 36, 2025-2029.
[61] Sen, A., 2008. Behaviour of DickeyŰFuller tests when there is a break under the unit root null hypothesis. Statistics and Probability Letters 78, 622Ű628.
[62] Seo, B., 1999. Distribution theory for unit root tests with conditional heteroskedasticity. Journal of Econometric 91, 113-144.
[63] Shin, D.W., Sarkar, S., Lee, J.H., 1996. Unit root tests for time series with outliers. Statistics and Probability Letters 30, 189-197.
[64] Taylor, J.B., 1998. An historical analysis of monetary policy rules. NBER Working Paper No 6768.
[65] Tolvi, J., 2001. Outliers in eleven finnish macroeconomic time series. Finnish Economic Papers 14, 14-32.
[66] Tsay, R.S., 1988. Outliers, level shifts, and variance changes in time series. Journal of Forecasting 7, 1-20.
[67] van Dijk, D., Franses, P.H., Lucas, A., 2002. Testing for ARCH in the presence of additive outliers. Journal of Applied Econometrics 14, 539-562. [68] Vogelsang, T.J., 1997. Wald-type tests for detecting breaks in the trend
function of a dynamic time series. Econometric Theory 13, 818-849. [69] Vogelsang, T.J., 1999. Two simple procedures for testing for a unit root
when there are additive outliers. Journal of Time Series Analysis 20, 237-252.
[70] Yin, Y., Maddala, G.S., 1997. The effects of different types of outliers on unit root tests. In Fomby and Hill (eds), Advances in Econometrics, Vol. 13, JAI Press, Greenwich, Conn.
[71] Zivot, E., Andrews, D.W.K., 1992. Further evidence on the great crash, the oil price shock and the unit root hypothesis. Journal of Business and Economic Statistics 10, 251-270.
Table 1: Descriptive Statistics from ARIMA Models.
Series Sample T Model Type Skew Kur JB BP(10)
Real GNP 1909-1988 80 (0,1,1) o -0.17 4.04 3.87 11.13
c 0.18 2.86 0.47 6.90
Nominal GNP 1909-1988 80 (0,1,1) o -0.99∗ 6.96∗ 63.72∗ 15.45
c 0.28 3.57 2.07 11.26
Real per capita GNP 1909-1988 80 (0,1,1) o -0.24 3.87 3.15 12.00
c 0.04 2.42 1.13 15.40 Industrial production 1860-1988 129 (2,1,0) o -0.76∗ 3.87∗ 16.39∗ 21.99∗ c -0.46∗ 3.67 6.80∗ 2.91 Employment 1890-1988 99 (1,1,1) o -0.49∗ 3.97∗ 7.69∗ 8.72 c -0.02 3.89 3.20 5.99 Unemployment 1890-1988 99 (2,0,0) o -0.04 4.74∗ 12.44∗ 7.00 c 0.35 3.14 2.06 6.13 GNP deflator 1889-1988 100 (0,1,1) o -1.33∗ 11.87∗ 349.85∗ 4.45 c 0.17 4.45∗ 8.95∗ 8.74 Consumer Price 1860-1988 129 (1,1,0) o -1.32∗ 9.82∗ 282.88∗ 4.27 c -0.19 3.19 0.95 7.05
o: original series, c: corrected-outliers series. ∗Significant at the 5% level. The BP test follow a χ2
distribution with 10 − p − q degrees of freedom under the null hypothesis of no serial linear correlation (with p and q the AR and MA orders, respectively).
Table 2: Descriptive Statistics from ARIMA Models (continue).
Series Sample T Model Type Skew Kur JB BP(10)
Nominal wages 1900-1988 89 (0,1,2) o -0.46 5.75∗ 30.34∗ 8.61 c 0.04 4.17∗ 4.96 9.98 Real wages 1900-1988 89 (1,1,0) o 0.05 3.18 0.15 4.37 c -0.01 3.50 0.90 7.45 Money stock 1889-1988 100 (0,1,1) o -0.35 5.14∗ 20.70∗ 3.71 c 0.23 2.82 0.99 5.13 Velocity 1869-1988 120 (0,1,1) o -0.47∗ 3.51 5.62∗ 11.39 c -0.36 3.12 2.70 8.61 Interest rate 1900-1988 89 (2,1,0) o -0.41 6.40∗ 43.29∗ 7.17 c 0.31 2.32 3.01 8.14 Stock price 1871-1988 118 (0,1,1) o -0.45∗ 4.29∗ 12.03∗ 11.35 c -0.04 2.46 1.43 17.28∗
o: original series, c: corrected-outliers series. ∗Significant at the 5% level. The BP test follow a χ2
distribution with 10 − p − q degrees of freedom under the null hypothesis of no serial linear correlation (with p and q the AR and MA orders, respectively).
T able 3: T ests fo r AR CH and No n-line arit y. Series T yp e LM(1) LM(4 ) BDS(0 .5 ,2 ) BDS(0 .5,3 ) BDS(0.5 ,4) BDS(1 ,2 ) BDS(1 ,3 ) BDS(1 ,4) Real GNP o 0.0 7 6.1 4 1.7 9 4.1 0 ∗ 4.7 0 ∗ 2.30 ∗ 4.4 9 ∗ 5.1 7 ∗ c 1.1 0 − 5 2.8 2 ∗ 1.9 4 1.2 2 2.17 ∗ 0.40 0.6 1 0.2 5 Nominal GNP o 8.7 7 ∗ 12 .7 8 ∗ 5.2 7 ∗ 7.7 3 ∗ 10.8 3 ∗ 3.32 ∗ 4.4 0 ∗ 5.7 3 ∗ c 0.4 8 6.6 0 3.0 4 ∗ 5.0 1 ∗ 6.2 0 ∗ 3.02 ∗ 4.1 4 ∗ 5.3 5 ∗ Real p er capita GNP o 0.5 5 8.3 1 2.6 4 ∗ 4.5 6 ∗ 5.0 7 ∗ 2.35 ∗ 4.5 7 ∗ 5.4 7 ∗ c 0.2 5 3.0 2 ∗ 2.0 6 ∗ 2.1 0 ∗ 0.01 1.53 1.01 0.6 2 Industrial pro duction o 13 .7 9 ∗ 16 .0 1 ∗ 4.6 5 ∗ 5.6 0 ∗ 5.6 3 ∗ 4.37 ∗ 5.1 0 ∗ 5.4 7 ∗ c 0.8 6 2.6 6 2.3 3 ∗ 3.3 7 ∗ 3.5 9 ∗ 0.73 1.2 0 1.4 2 Emplo ymen t o 2.9 4 7.6 3 2.9 2 ∗ 4.9 5 ∗ 5.8 7 ∗ 3.23 ∗ 4.2 6 ∗ 4.9 1 ∗ c 0.5 1 1.3 9 0.2 9 1.3 2 1.8 2 0.3 8 0.40 0.58 Unemplo ymen t o 0.1 0 2.0 2 3.3 9 ∗ 4.3 1 ∗ 4.9 5 ∗ 3.69 ∗ 4.6 3 ∗ 5.1 3 ∗ c 2.0 9 3.4 1 -1 .0 1 -1 .4 9 -1 .3 9 -2 .4 3 -2 .1 6 -1 .83 GNP deflator o 2.7 0 8.5 4 3.6 6 ∗ 6.4 7 ∗ 9.4 2 ∗ 3.68 ∗ 4.7 5 ∗ 5.5 6 ∗ c 0.5 7 0.8 7 1.5 7 1.4 8 3.1 7 ∗ 0.52 1.6 1 1.7 0 o: original series, c: corrected-outliers series. ∗ Significan t at the 5% lev el. W e examine the BDS statistic for em b edding dimensions m =2,3, and 4 and epsilon =0.5 and 1 as suggested b y Bro ck, Dec hert and Sc heinkman (1996). The BDS test follo ws a standard normal distribution under the n ull h yp othesis.
T able 4: T ests for AR CH and No n-linea rit y (con tin ue). Series T yp e LM(1 ) LM(4) BDS(0 .5 ,2 ) BDS(0 .5 ,3 ) BDS(0.5 ,4 ) BDS(1,2) BDS(1,3) BDS(1,4 ) Consumer price o 13 .27 ∗ 6.6 3 4.6 4 ∗ 4.86 ∗ 6.08 ∗ 5.02 ∗ 4.67 ∗ 4.2 8 ∗ c 0.0 6 3.9 0 1.5 9 3.0 2 ∗ 5.80 ∗ 0.1 0 0.8 2 1.5 0 Nominal w ages o 0.7 1 6.2 8 3.6 3 ∗ 5.08 ∗ 5.72 ∗ 3.09 ∗ 4.72 ∗ 5.6 5 ∗ c 1.4 6 2.2 9 4.16 ∗ 4.14 ∗ 3.48 ∗ 2.98 ∗ 3.60 ∗ 3.8 9 ∗ Real w ages o 0.1 2 4.5 6 -0.5 7 -0.2 2 -0 .6 7 0.65 2.2 6 ∗ 2.5 8 ∗ c 0.0 2 1.8 6 -0 .1 4 -0 .3 0 -1 .0 6 -1 .0 6 -0 .32 -0.1 6 Money sto ck o 0.1 0 3.2 1 3.6 3 ∗ 4.49 ∗ 5.03 ∗ 2.49 ∗ 3.02 ∗ 4.1 9 ∗ c 1.6 9 5.5 0 1.2 2 0.4 1 0.6 4 1.2 3 0.62 0.65 V elo cit y o 3.5 6 11 .1 3 ∗ 1.4 2 3.6 9 ∗ 5.51 ∗ 2.15 ∗ 4.53 ∗ 5.6 4 ∗ c 10 .4 6 ∗ 14 .4 2 ∗ 4.0 2 ∗ 5.62 ∗ 7.30 ∗ 4.45 ∗ 6.04 ∗ 6.9 6 ∗ In terest rate o 15 .59 ∗ 19 .7 4 ∗ 4.0 8 ∗ 5.95 ∗ 7.10 ∗ 4.47 ∗ 5.51 ∗ 5.6 2 ∗ c 4.0 2 5.5 0 0.8 0 0.4 8 0.74 2.32 ∗ 1.07 1.5 7 Sto ck price o 21 .57 ∗ 23 .6 7 ∗ 0.5 4 1.5 2 0.6 3 0.8 2 1.6 8 1.5 8 c 1.6 4 5.1 6 -2 .7 3 -3.2 1 -5 .6 3 -1 .66 -0.4 9 -0 .8 0 o: original series, c: corrected-outliers series. ∗ Significan t at the 5% lev el. W e examine the BDS statistic for em b edding dimensions m =2,3, and 4 and epsilon =0.5 and 1 as suggested b y Bro ck, Dec hert and Sc heinkman (1996). The BDS test follo ws a standard normal distribution under the n ull h yp othesis.
Table 5: Outliers detection.
Series Date Type t-stat Events
Real GNP 1918 TC 4.32 World War I, expansion
1921 AO -5.39 Recession
1930 IO -4.50 Great Depression
1932 IO -5.08 Great Depression
1938 TC -3.79 Recession
1946 IO -4.05 End of World War II
Nominal GNP 1921 LS -6.83 Recession
1930 IO -3.64 Great Depression
1931 IO -4.72 Great Depression
Real per capita GNP 1918 TC 5.67 World War I, expansion
1921 AO -6.03 Recession
1930 IO -4.82 Great Depression
1932 IO -5.49 Great Depression
1938 TC -4.34 Recession
1946 IO -4.10 End of World War II
1954 AO -3.71 Recession
Industrial production 1908 TC -3.72 Recession
1921 AO -5.55 Recession
1930 IO -3.61 Great Depression
1931 IO -3.36 Great Depression
1932 TC -6.78 Great Depression
1938 TC -6.03 Recession
Table 6: Outliers detection (continue).
Series Date Type t-stat Events
Employment 1893 IO -4.85 Recession 1894 AO -3.79 Recession 1908 AO -3.55 Recession 1921 TC -5.10 Recession 1930 IO -3.63 Great Depression 1931 IO -3.23 Great Depression 1932 IO -4.86 Great Depression 1938 TC -5.35 Recession
1946 IO -5.18 End of World War II
1954 LS -3.06 Recession
Unemployment 1893 TC 6.04 Recession
1894 TC 3.30 Recession
1906 IO -4.01 Expansion
1908 AO 3.94 Recession
1918 IO -5.11 World War I, expansion
1920 IO 3.63 Recession 1921 AO 3.05 Recession 1923 AO -5.18 Expansion 1930 IO 3.99 Great Depression 1931 TC 3.30 Great Depression 1932 LS 6.36 Great Depression 1942 LS -5.41 World War II 1943 IO -4.32 World War II 1944 IO -3.11 World War II
Table 7: Outliers detection (continue).
Series Date Type t-stat Events
GNP deflator 1893 AO 4.74 Recession
1916 IO 3.27 World War I, expansion
1917 IO 4.22 World War I, expansion
1920 AO 12.32 Recession
1931 IO -3.28 Great Depression
1946 IO 3.01 End of World War II
Consumer price 1862 IO 3.28 Civil war, expansion
1863 LS 4.89 Civil war, expansion
1864 TC 8.77 Civil war, expansion
1917 IO 3.36 World War I, expansion
1921 IO -7.36 Recession
Nominal wages 1908 TC -7.13 Recession
1916 IO 4.99 World War I, expansion
1918 IO 4.81 World War I, expansion
1921 IO -7.50 Recession
1923 TC 4.45 Expansion
1932 IO -5.06 Great Depression
1938 TC -5.52 Recession
1941 IO 3.09 World War II
Real wages 1908 AO -3.70 Recession
1915 AO -3.26 Recession
1938 TC -3.29 Recession
Table 8: Outliers detection (continue).
Series Date Type t-stat Events
Money stock 1893 IO -4.27 Recession
1908 AO -4.45 Recession
1917 IO 3.24 World War I, expansion
1921 IO -4.22 Recession 1931 LS -4.07 Great Depression 1932 IO -7.01 Great Depression 1943 IO 4.84 World War II 1945 TC 3.41 World War II Velocity 1881 LS -3.34
-1918 TC 3.21 World War I, expansion
Interest rate 1918 TC 6.04 World War I, expansion
1928 AO -3.72 Tight monetary policy
1932 TC 8.67 Great Depression
1957 AO 5.83 Tight monetary policy, recession
1961 AO -5.81 Less restrictive monetary policy
1968 IO 5.42 Expansionary monetary and fiscal policies
1970 AO 15.32 Expansionary monetary and fiscal policies
1980 IO 9.93 Volcker disinflation, recession
1981 TC 7.29 Volcker disinflation, recession
1984 AO 19.98 Inflation scare
1986 LS -21.36 Fall in oil prices
Table 9: Results of Efficient Unit Root Tests.
Data series DF-GLS M Za M Zt k
Real GNP -0.85 -1.68 -0.82 0
Nominal GNP -2.01 -7.37 -1.91 0
Real per capita GNP -0.80 -1.42 -0.76 0
Industrial production -1.36 -10.87 -1.29 0 Employment -1.37 -3.78 -1.28 0 Unemployment -4.39∗ -26.90∗ -3.67∗ 0 GNP deflator -1.44 -10.98 -2.15 5 Consumer prices -1.89 -8.14 -1.81 0 Nominal wages -0.28 -0.24 -0.15 0 Real wages -0.65 -1.51 -0.64 0 Money stock -2.01 -8.43 -2.01 2 Velocity -0.58 -1.51 -0.66 6 Interest rate -0.21 -0.41 -0.19 0 Stock price -1.00 -3.12 -1.02 5
∗Significant at 5% level. Critical values at the 5% level are -2.91 for DF-GLS and M Z
t, and -17.3
for M Za. k represents the lag order for efficient unit root tests, and is selected by using the modified
Appendix
Table 10: Estimated break dates in the Nelson-Plosser data – one break.
Data series Zivot– Perron Perron Vogelsang Vogelsang Hsu–
Andrews (tα) (tλ) (level) (diff.) Kuan
(1992) (1997) (1997) (1997) (1997) (2001) Real GNP 1929 1928 1928 1929 1938 1940 Nominal GNP 1929 1928 1928 1929 1932 1930 Real p.c. GNP 1929 1928 1928 1938 1921 1940 Ind production 1929 1928 1928 1929 1952 1929 Employment 1929 1928 1928 1929 1906 1929 Unemployment — — — 1929 1933 — GNP deflator 1929 1928 1919 1920 1940 1930 Consumer prices 1873 1939 1919 1872 1879 1901 Nominal wages 1929 1929 1919 1929 1920 1930 Real wages 1940 1939 1939 1940 1938 1940 Money stock 1929 1927 1928 1928 1920 1930 Velocity 1949 1946 1880 1947 1949 1930 Interest rate 1932 1963 1920 1962 1967 1935 Stock price 1936 1928 1936 1936 1947 1939
Zivot and Andrews (1992) and Perron (1997) proposed unit root tests with one structural break whereas Volgelsang (1997) and Hsu and Kuan (2001) suggested tests for detecting breaks. Perron
(tα) and (tλ) denote two different inf-t statistics of Perron (1997). Vogelsang (level) and (diff.)
Table 11: Estimated break dates in the Nelson-Plosser data – two breaks.
Data series Lumsdaine Lee Papell
Papell Strazicich Prodan
(1997) (2003) (2007) Real GNP 1928 1920 1929 1937 1941 1939 Nominal GNP 1919 1920 1929 1928 1948 1949 Real p.c. GNP 1928 1920 1929 1939 1941 1939 Ind production 1917 1920 1869 1928 1930 1929 Employment 1928 1920 1908 1955 1945 1929 Unemployment 1928 1926 — 1941 1942 — GNP deflator 1916 1919 1929 1920 1922 1945 Consumer prices 1914 1916 1882 1944 1941 1940 Nominal wages 1914 1921 1908 1929 1942 1929 Real wages 1921 1922 1909 1940 1939 1940 Money stock 1929 1927 1915 1958 1931 1930 Velocity 1883 1893 1884 1953 1947 1949 Interest rate 1931 1949 1932 1957 1958 1965 Stock price 1925 1925 1886 1938 1941 1953
Lumsdaine and Papell (1997), Lee and Strazicich (2003) and Papell and Prodan (2007) proposed unit root tests with two structural breaks. As suggested by Perron (1989) and Zivot and Andrews
(1992), among others, the estimated break dates are only reported for model A – that allows for changes in the intercept of the trend function – in all series except for the real wages and the stock