Since 1960, global livestock productivity (includ-ing carcass weight of meat- produc(includ-ing species, milk yield of dairy cows and egg production) has increased by 20–30% as a result of advances in nutrition, dis-ease control and genetics1. Genetic improvement has
accrued through breed substitution, cross- breeding and within- breed selection. In contrast to the one- off measures of breed substitution and cross- breeding, within- breed selection drives sustained, cumulative genetic progress. It has increasingly relied on sophisticated statistical methods, including mixed model methodology, to pro-vide ever more accurate individual estimated breed-ing values (EBVs)2. Spectacular genetic improvements
have been achieved in several species by combining within- breed selection with reproductive technologies (such as artificial insemination and embryo transfer) to more effectively disseminate elite genomes. For example, average annual milk yield per cow in the United States increased from 1,890 kg in 1924 to 9,682 kg in 2011, and more than 50% of this progress was attributed to improved genetics1. Between 1957 and 2001, the time
for broiler chickens to reach market weight decreased threefold despite a decrease in feed consumption3,4.
Typically, within- breed selection is expected to result in annual genetic gains of ~1–3%1.
Currently, the most effective route to minimize the detrimental environmental impact of livestock is to increase productivity: the carbon footprint of 1 kg of milk produced in the United States in 2007 was 37% of that in 1944, and the carbon footprint of the total US dairy industry was reduced by 41% over the same period despite the 250% increase in total milk produc-tion5. However, exclusive emphasis on production has
led to detrimental correlated responses in other traits, particularly those associated with fitness. For example,
although selection for milk production in dairy cat-tle was extremely successful, there was a substantial undesired decline in fertility over the same period6.
Thus, selection schemes now increasingly attempt to balance animal health, fertility, production and environmental impact.
The emergence of genomics as a discipline in the 1980s led to the concept of marker- assisted selection (MAS), in which genetic variants and genes that influ-ence agriculturally important traits would be identified and used to further increase genetic response. A global chase for quantitative trait loci (QTL) ensued in all live-stock species. QTL with large effects on economically important traits were indeed mapped, first by linkage analyses and then by genome- wide association studies (GWAS), but these did not account for a large enough proportion of the heritability to render them useful selection tools on their own7. MAS met with limited
enthusiasm from the breeding industry until a land-mark paper proposed genomic selection (GS)8. In its
simplest form, GS makes the same assumption as standard EBV selection: the genetic variance for the traits of interest reflects the additive effects of thou-sands of variants with very small (and, unlike QTL, unmappable) effects that are uniformly scattered throughout the genome2,9. As soon as genome- wide
single- nucleotide polymorphism arrays (SNP arrays) became an affordable reality, GS was tested and was soon widely adopted by the dairy cattle breeding industry as an effective and easily implemented alter-native to the time- consuming and costly standard progeny testing (PT). Since 2008, more than 3 million dairy animals have been genotyped worldwide, and GS has become an essential tool for breeding com-panies that is expected to double genetic progress10. Within- breed selection
A process by which sires and dams that have above average breeding values are selected as parents to produce the next generation of animals. Genetic gains Differences in the average breeding values of the population before and after selection. Genetic gain is a function of the amount of genetic variance, the accuracy of selection, the intensity of selection and the generation interval.
Harnessing genomic information
for livestock improvement
Michel Georges
1,2*, Carole Charlier
1,2and Ben Hayes
3Abstract | The world demand for animal- based food products is anticipated to increase by
70% by 2050. Meeting this demand in a way that has a minimal impact on the environment will
require the implementation of advanced technologies, and methods to improve the genetic
quality of livestock are expected to play a large part. Over the past 10 years, genomic selection
has been introduced in several major livestock species and has more than doubled genetic
progress in some. However, additional improvements are required. Genomic information of
increasing complexity (including genomic, epigenomic, transcriptomic and microbiome data),
combined with technological advances for its cost- effective collection and use, will make a
major contribution.
1Unit of Animal Genomics,
GIGA Institute, University of Liège, Liège, Belgium.
2Faculty of Veterinary
Medicine, University of Liège, Liège, Belgium.
3Queensland Alliance for
Agriculture and Food Innovation (QAAFI), Queensland Bioscience Precinct, The University of Queensland, Brisbane, Queensland, Australia. *e- mail: michel.georges@ uliege.be
https://doi.org/10.1038/ s41576-018-0082-2
GS is increasingly being adopted by other livestock industries and in plant breeding11,12. Similar
meth-ods are now also used in human genetics to study the genetic architecture of common complex diseases and to predict individual disease risk13–15. Although GS as
implemented today is expected to enable genetic pro-gress of up to twofold in dairy cattle and layer hens, with more modest gains in other species, it is unlikely to be sufficient to meet the expected 70% increase in the world demand of animal products by 2050 (ref.16).
Further improvements and additions to GS will be needed to meet this target.
In this Review, we examine the status of genomic resources available in the major livestock species (that is, cattle, sheep, goat, pig, poultry and salmon) and how these are being used to accelerate the discovery and management of defect- causing genes, to improve the accuracy and extend the scope of GS, to orient genome editing strategies and to develop new applications that take advantage of the genomic information that is becoming widely available.
Genomic resources for livestock species
New scaffolding methods have dramatically improved livestock reference genomes. Following the lead of the human and mouse genome projects, the animal genom-ics community generated draft reference genomes for the major livestock species (poultry17, cattle18, pig19, goat20,
sheep21 and salmon22), first using Sanger sequencing with
hybrid (clone- by-clone and whole genome) shotgun approaches23, increasingly complemented with massively
parallel generation of short reads. These efforts provided initial insights into the evolution of the gene repertoire underlying adaptive features (such as plumage and beak formation, rumination and lactation, wool growth, and smell and taste specification) and into changes resulting from whole- genome duplication in salmon. They also contributed to the identification of evolutionary con-served elements24. However, the quality of most of these
reference genomes has remained a source of concern. They were highly fragmented and littered with assembly errors, which affect positional cloning efforts and impu-tation accuracy, among other uses25. Critical mass and
funding have long been missing to upgrade their status from highly fragmented drafts to high- quality finished genomes. However, the development of new scaffold-ing approaches, includscaffold-ing long- read sequences (such as PacBio), optical mapping (such as Bionano Genomics)
and chromatin conformation capture now provides an affordable path to high- quality reference genomes for all species26. The integrated use of these methods
has recently enabled spectacular improvements in the quality of reference genomes for goat27 and other
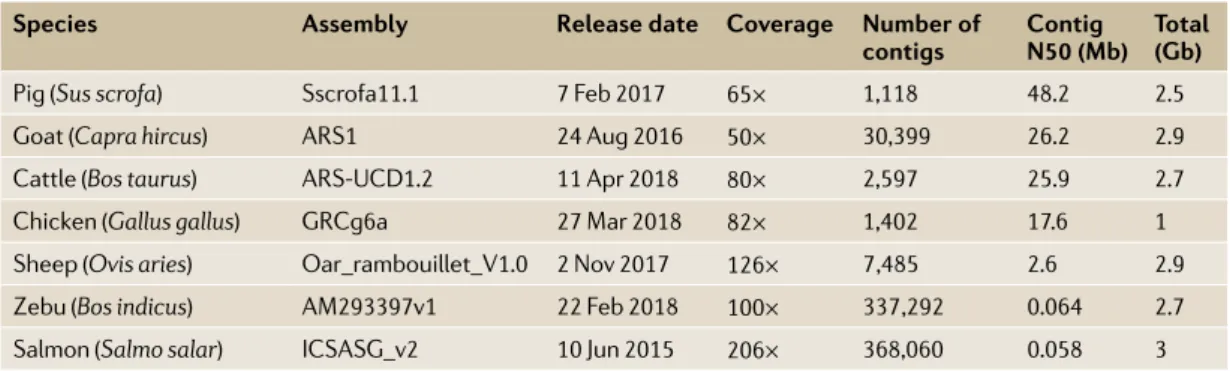
live-stock species (TAble 1) (genome assemblies are available through the NCBI Genome database).
Genome- wide SNP arrays are available for the main livestock species. Draft reference genomes were typically accompanied by shallow (1–2-fold depth) sequencing of tens to hundreds of individuals representing distinct breeds and populations in order to characterize genetic variation and infer demographic history (see, for exam-ple, refs19,28,29). These efforts have uncovered millions
of genetic variants for all the main livestock species and profoundly changed our understanding of the domesti-cation process (box 1). Databases of available SNPs (such as dbSNP) have been used to develop a large number of arrays that allow cost- effective genotyping of tens of thousands to hundreds of thousands of variants in the major livestock species (Supplementary Table 1). These arrays are extensively used to conduct GWAS, as well as GS. It is estimated that at least 3 million cattle and possibly millions of pigs and poultry have been genotyped using genome- wide SNP arrays10,11.
Population- based resequencing for imputation- based GWAS and GS. As sequencing costs continue to decrease, livestock geneticists are resequencing the genomes of a growing number of animals. More than 2,500 cattle have had their whole genome rese-quenced, while the corresponding numbers are at least in the hundreds for pig, poultry, sheep and goats (M. Groenen, R. Hawken and G. Tosser- Klopp, personal communications). The best- known large- scale rese-quencing initiative in livestock genetics is the 1,000 Bull Genomes Project25, but other large sequencing
projects are being conducted by academic groups and breeding companies30. These efforts are largely inspired
by the human 1,000 Genomes Project31 and hope to
achieve deep characterization of the genetic varia-tion between and within populavaria-tions. Importantly, sequencing the whole genomes of a reference popula-tion of hundreds of animals enables genotype imputation at millions of common variants in the much larger number of animals that have been genotyped with genome- wide SNP arrays. This approach can be Table 1 | current status of the reference genomes for the most important livestock species
species Assembly Release date coverage number of
contigs contig n50 (Mb) total (Gb)
Pig (Sus scrofa) Sscrofa11.1 7 Feb 2017 65× 1,118 48.2 2.5
Goat (Capra hircus) ARS1 24 Aug 2016 50× 30,399 26.2 2.9
Cattle (Bos taurus) ARS- UCD1.2 11 Apr 2018 80× 2,597 25.9 2.7
Chicken (Gallus gallus) GRCg6a 27 Mar 2018 82× 1,402 17.6 1
Sheep (Ovis aries) Oar_rambouillet_V1.0 2 Nov 2017 126× 7 ,485 2.6 2.9
Zebu (Bos indicus) AM293397v1 22 Feb 2018 100× 337 ,292 0.064 2.7
Salmon (Salmo salar) ICSASG_v2 10 Jun 2015 206× 368,060 0.058 3
Quantitative trait loci (QTl). regions in the genome that encompass genetic variants with an effect on a quantitative trait of interest. Genome- wide association studies
(GWAs). scan of the entire genome to identify genetic variants for which variation in genotype is associated with variation for one or more phenotypes of interest. Genomic selection (Gs). An ensemble of methods to estimate the breeding values of individual animals on the basis of genome- wide single- nucleotide polymorphism genotype information. Single- nucleotide polymorphism arrays (sNP arrays). Microarrays used to determine the genotype of individuals for hundreds to millions of sNPs at once. Progeny testing
(PT). An approach by which the breeding value of an animal is estimated from phenotypic measures made on its progeny. Genetic architecture The description of the number, location and effects of the genetic variants that affect a phenotype of interest.
implemented using pyramidal schemes in which a top layer of a few (possibly hundreds) highly influen-tial animals are sequenced, an intermediate layer of ‘multiplier’ animals are genotyped with high- density SNP arrays and the most populated bottom layer of animals are genotyped with low- density SNP arrays. Sequence information is then projected from the upper two layers onto the animals of the bottom layer using a two- step imputation strategy32. Livestock represent a
unique opportunity to implement this approach because samples from key ancestors of the population are often available in the form of semen straws or ampules. In the 1,000 Bull Genomes Project, bulls born in the 1960s are included in the set of sequenced animals. The availability of whole- genome sequence information for tens to hundreds of animals from specific breeds has proved extremely useful to pin-point the causative mutations underlying monogenic defects25,33. Imputation of sequence information on
large cohorts of phenotyped animals greatly accelerates fine- mapping and identification of causative variants for QTL detected by GWAS25,34. It is also anticipated
that imputed sequence information could increase the accuracy of GS (see Increasing the accuracy of GS using whole- genome sequence imputation).
Epigenome maps and eQTL data sets enable functional follow- up of GWAS hits. It is increasingly recognized that regulatory (rather than coding) variants account for the majority of the genetic variation underlying complex traits, such as common complex diseases in humans or economically important traits in plants and animals35,36.
Most of these regulatory variants are expected to affect components of gene switches, that is, proximal pro-moters and more distant enhancers and silencers. To aid in the identification of such regulatory variants and the genes whose expression they affect, the animal genomics community has begun to generate epigenome maps, mainly using ChIP- seq (chromatin immunopre-cipitation followed by sequencing), DNase- seq (DNase I hypersensitive site sequencing) and ATAC- seq (assay for transposase- accessible chromatin using sequenc-ing), which will provide exhaustive catalogues of gene regulatory elements in livestock. Most of these efforts are coordinated through the international Functional Annotation of Animal Genomes (FAANG) project37,38.
Liver- specific comparative enhancer maps based on his-tone modification data have already been generated for 20 mammals, including cow, pig and rabbit39. In
addi-tion, bovine DNA methylation maps have been gener-ated for ten somatic tissues using reduced representation bisulfite sequencing40.
Epigenome maps are complemented by multi- tissue transcriptome data sets for the analysis of expression quantitative trait loci (eQTL). In cattle, such data sets have been generated for mammary gland, liver, blood and adrenal gland and have been used to identify causative genes underlying GWAS- identified QTL41–45.
In pigs, eQTL studies have been conducted in skeletal muscle, lung, adipose tissue and liver46–57. In poultry,
genome- wide eQTL analyses have been reported for liver, bone, adrenal gland and hypothalamus58–61. The
time seems right for the animal genomics community to take advantage of working with livestock species to col-laboratively generate large, multi- omic, multi- tissue data sets similar to the human Genotype- Tissue Expression (GTEx) data set62. This approach would provide
inval-uable comparative information about genome function and greatly facilitate follow- up studies of GWAS and GS hits in these species.
Important Mendelian traits in livestock
The early 20th century saw a heated debate between Mendelists and Galtonists, with Galtonists claiming that Mendelian genes accounted for only a small proportion of inherited features. The debate was settled when it was realized that quantitative traits derive their contin-uous distribution from the combined effects of many segregating Mendelian genes (that is, they are poly-genic traits). It remains true, however, that Mendelian traits — that is, phenotypes that are fully determined by one gene (monogenic) or a small number of genes (oligogenic) — are the exception rather than the rule. In humans, Mendelian traits are largely limited to blood groups and an admittedly long list of severe genetic defects that are compiled in the Online Mendelian Inheritance in Man (OMIM) database and that include the ‘inborn errors of metabolism’. In addition to blood Genotype imputation
The in silico prediction of the genotype of an individual for ungenotyped variants on the basis of known genotypes at neighbouring variants and a reference population with genotype information for all variants. Imputation exploits the nonrandom association of alleles at neighbouring variants, referred to as linkage disequilibrium.
Soft sweeps
The process by which the frequency of a favourable old variant rapidly increases in the population by positive selection until eventual fixation. soft sweeps are not associated with the concomitant fixation of one predominant haplotype, as the variant has been distributed over multiple haplotypes by recombination before selection. old variants that are substrates for new selection constitute the standing variation in the population.
Box 1 | Genetic variation provides insight into the domestication process
Punctuated versus continuous domestication.One of the most striking insights gained from studying genetic variation in livestock species is the realization that the degree of genetic variation, measured, for instance, by the average heterozygosity per nucleotide site (π), is typically higher in livestock than in humans19,28,29. this observation is against expectations. it is often assumed that animal domestication occurred through rare, isolated events involving a limited number of animals, which would have caused drastic genetic bottlenecks. Further reduction in effective population size would have accompanied more recent breed creation and been accentuated by intensifying selection schemes. However, domestic animal populations remain more variable than the people who domesticated them. this realization forces us to revisit our views of the domestication process. Domestication most likely involved continuous gene flow between domestic and wild individuals from the same species, as well as from inter- fertile sub- species, during most of agricultural history191. as a result, the genomes of the majority of domestic livestock species probably have a mosaic structure that is at least as pronounced as that of the laboratory mouse192 or human193. some haplotypes segregating within pig and cattle breeds have been shown to differ approximately every 100 bp, which is a similar sequence identity to humans and chimpanzees; thus, they possibly coalesced ~5 million years ago, which is before the creation of the studied species118,194,195.
Hard sweeps, soft sweeps and polygenic adaptation during domestication.Comparisons between the genome sequences of domestic animals and their wild extant or extinct progenitors (that is, red jungle fowl196, rabbit197, wild boar191, bezoar198 and auroch199) have identified chromosome regions that may have undergone hard sweeps driven by the domestication process. these regions seem to be enriched in genes that control behaviour and stature. the most convincing 40 kb hard sweep signature encompasses the G558r missense mutation in the chicken thyroid stimulating hormone receptor (tsHr), known to have a key role in metabolic regulation and photoperiod control of reproduction196. these genomic regions may correspond to islands of domestication that resist recurrent gene flow from wild progenitor species191. it is worth noting that the methods used to detect selective sweeps associated with domestication pick up only hard sweeps acting on very rare or de novo mutations. soft sweeps acting on older and hence more common mutations (that is, standing variation in the wild progenitor) require alternative methods for their detection200. it is also noteworthy that evidence suggests that tame behaviour in rabbits and possibly other species evolved through shifts in allelic frequency at many loci (that is, polygenic adaptation) rather than critical changes at a few domestication loci197.
groups and a similar list of severe genetic defects com-piled in the Online Mendelian Inheritance in Animals (OMIA) database, Mendelian traits in domestic animals also include an extended list of breed- defining char-acteristics, such as coat colour, tegument variation, polledness, double- muscling and hyper- prolificacy. Most breed- defining traits have been molecularly characterized. For millennia, animal breeders have per-formed what amounts to a mega- scale phenotype- driven mutagenesis screen. In the process, they have identified a series of mutations with large phenotypic effects that — when desirable — were selected, often becoming trade-marks and breed- defining features. In many instances, mutant variants were valued because of their aesthetic effects on the animals, such as patterns of coat and plum-age colour; shape of ears, horns, wattles or combs; and tonality of songs. The long- standing interest of breeders for ‘fancy’ animals is well illustrated by 7,000-year- old rock paintings in the Sahara63. In other instances, the value
of the mutant variants reflects their utility. For instance, mutations with major beneficial effects on hair (such as quality of angora or cashmere) and skin texture (such as heat tolerance of slick cattle), fertility (such as twinning) and muscularity (for example, double- muscling) are all highly desired. Although some mutant phenotypes are easily recognized, others are subtler and may require human–animal proximity for their detection. An exam-ple of such a phenotype is pacing in horses, which was shown recently to result from a premature stop codon in DMRT3, a gene that controls spinal circuitry64. It is hard
to imagine that such a phenotype could be detected in the systematic phenotype- driven screens that are currently being conducted in the mouse.
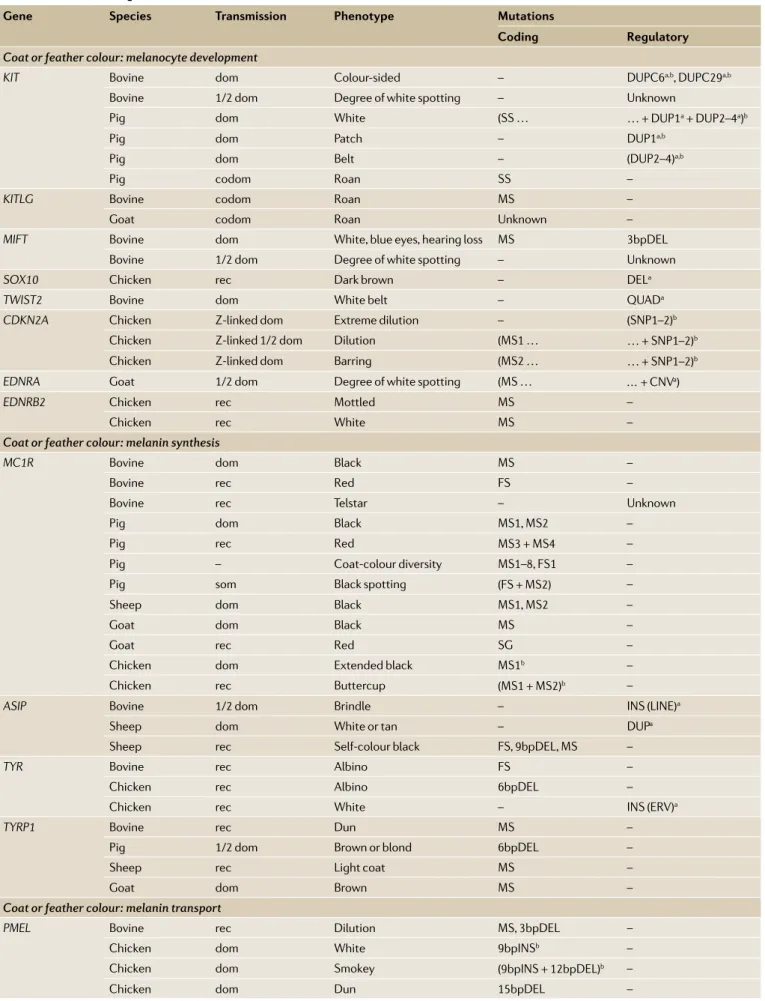
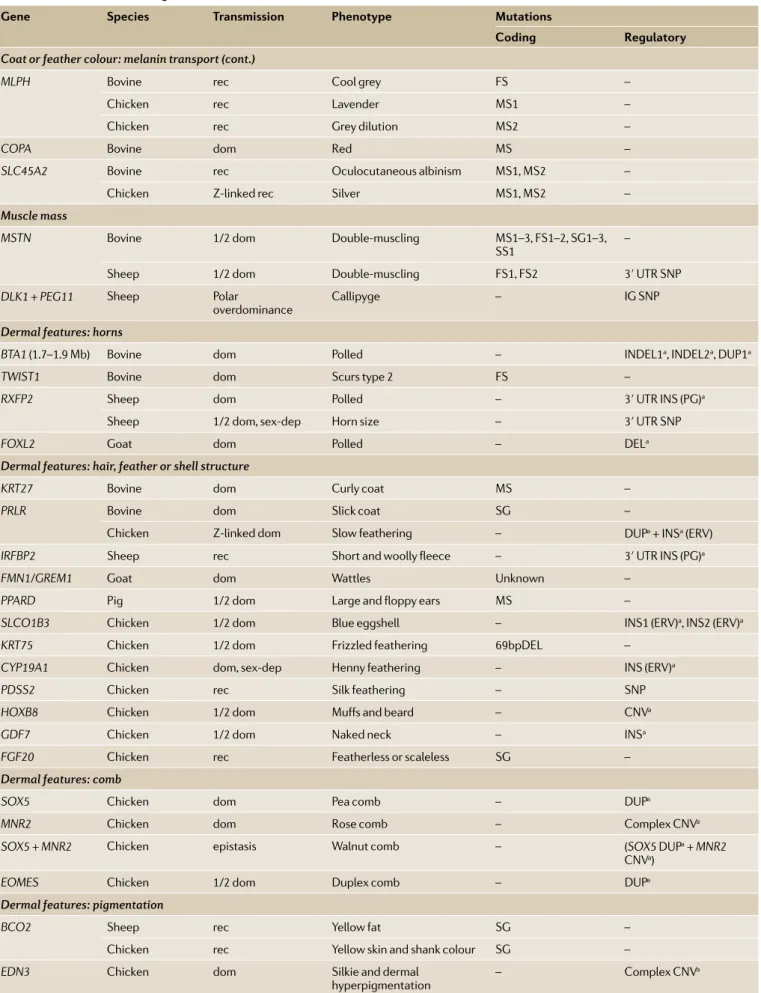
Over the past 10 years, as genomic resources and methods improved, the causative genes and mutations underlying most of these breed- defining characteristics have been identified, and a number of dominant themes have emerged65(TAble 2). Most (75%) of the
corre-sponding mutations are at least partially dominant, that is, heterozygotes express a phenotype; such mutations would have been easier to detect and maintain in the population than recessive ones. A large proportion of mutations affect gene regulation (43%), resulting in gain- of-function phenotypes through ectopic gene expres-sion. Regulatory mutations are often structural (64%) and involve duplications, insertions (including of retro- elements), inversions or combinations thereof. The same phenotype is often determined by mutations in the same gene in different species and by allelic series within spe-cies, which indicates that mutations of only that gene can generate the corresponding phenotype without major deleterious pleiotropy. Different phenotypes are some-times caused by allelic series that have evolved one from the other by serial accumulation of multiple mutations.
The molecular dissection of breed- defining traits has revealed some remarkable biology, including the demonstration of serial translocation by circular inter-mediates, which is likely to be an ancient exon shuffling mechanism66, the identification of a hypomorphic MSTN
mutation resulting from the acquisition of an illegiti-mate microRNA target site67 and the interplay between
cis- effects and microRNA- mediated trans- effects under-lying polar overdominance of the callipyge phenotype in sheep68. However, it is noteworthy that the
molecu-lar underpinnings of the cashmere and mohair wool types in goat and the very widespread recessive piebald phenotype in cattle remain unknown.
About the number of defect- causing recessive muta-tions carried per individual. Diploidy has enabled an increase in genome size while ensuring that most indi-viduals in the population have at least one functional copy of each gene. Concomitantly, most individuals are expected to be heterozygous for loss- of-function (LoF) alleles in a number of haplosufficient genes. The analysis of whole- genome sequences from large num-bers of individuals indicates that this number is ~100 in humans69. It appears to be very similar in livestock
species, including the cow30. This estimate is much
higher than expected from epidemiological studies, which suggest that humans carry on average ~0.5–1 allele that is lethal when homozygous70. This apparent
conundrum can be explained by the observation that for the majority of genes (~75%), homozygosity for LoF mutations is viable but confers a modest selective dis-advantage that is sufficient to preclude fixation of the mutations, which explains the evolutionary conserva-tion of the corresponding gene. Indeed, data from the International Mouse Phenotype Consortium indicate that only ~25% of mammalian genes are essential in the sense that at least one functional allele is needed for survival until reproductive age. Homozygosity (or compound heterozygosity) for LoF mutations in the corresponding genes are lethal, either before (embry-onic lethal (EL)) or after birth. The number of such recessive lethal alleles that are carried, on average, by healthy individuals has been of considerable interest for a long time71. Indeed, this number determines, for
instance, the increased morbidity endured by offspring of consanguineous marriages or matings. Simulations for mammalian genomes30 suggest that this number
increases with effective population size (Ne), from ~0.5
for Ne = 100 (which is the Ne for many livestock
popu-lations) to ~5 for Ne = 10,000 (which is the Ne of the
human population). Approximately 1% (independent of Ne) of conceptuses succumbs from homozygosity (or
compound heterozygosity) for at least one of around ten common EL mutations (frequency >0.02) in livestock compared with at least one among thousands of rare EL mutations in humans30. This observation suggests that
managing severe genetic defects in livestock populations (including EL mutations) is a tractable problem that requires the identification and tracking of around ten such common mutations per population. It is notewor-thy that in humans (and probably in other mammals), an estimated 3,000 genes are haploinsufficient and hence LoF- intolerant72.
Identifying causative mutations for recessive defects has become trivial. Livestock populations are charac-terized by recurrent outbursts of genetic defects. This is particularly true for species such as cattle in which artificial insemination allows elite sires to have tens Epigenome
The combination of chemical modifications of the DNA sequence (such as cytosine methylation) or nucleosomes (such as methylation of lys 27 of histone H3) that mark functionally distinct segments of the genome (such as active enhancers) and are inherited mitotically and/or meiotically. ChIP- Seq
A combination of chromatin immunoprecipitation and next- generation sequencing for genome- wide mapping of binding sites occupied by specific DNA- binding proteins or chromatin regions enriched in specific histone
modifications. DNase- Seq
A method based on next- generation sequencing for genome- wide detection of gene- switch components on the basis of their open chromatin conformation and resulting hypersensitivity to digestion by DNase I. ATAC- Seq
An assay based on next- generation sequencing for genome- wide detection of gene- switch components on the basis of their open chromatin conformation and resulting increased accessibility to transposase Tn5.
Expression quantitative trait loci
(eQTl). Quantitative trait loci that influence the transcript levels of specific genes. Cis- eQTl are due to regulatory variants that control the levels of rNA molecules transcribed from gene copies located on the same DNA molecule as the variant. Trans- eQTl are due to regulatory variants that can also control the levels of rNA molecules transcribed from gene copies located on different DNA molecules to the variant (homologous or other chromosomes).
Pleiotropy
The ability of a genetic variant to affect more than one phenotype.
Hypomorphic Pertaining to an allele with partial loss of function when compared with the wild- type allele.
Table 2 | Breed- defining traits that have been characterized at the molecular level
Gene species transmission Phenotype Mutations
coding Regulatory
Coat or feather colour: melanocyte development
KIT Bovine dom Colour- sided – DUPC6a,b, DUPC29a,b
Bovine 1/2 dom Degree of white spotting – Unknown
Pig dom White (SS … … + DUP1a+ DUP2–4a)b
Pig dom Patch – DUP1a,b
Pig dom Belt – (DUP2–4)a,b
Pig codom Roan SS –
KITLG Bovine codom Roan MS –
Goat codom Roan Unknown –
MIFT Bovine dom White, blue eyes, hearing loss MS 3bpDEL
Bovine 1/2 dom Degree of white spotting – Unknown
SOX10 Chicken rec Dark brown – DELa
TWIST2 Bovine dom White belt – QUADa
CDKN2A Chicken Z- linked dom Extreme dilution – (SNP1–2)b
Chicken Z- linked 1/2 dom Dilution (MS1 … … + SNP1–2)b
Chicken Z- linked dom Barring (MS2 … … + SNP1–2)b
EDNRA Goat 1/2 dom Degree of white spotting (MS … … + CNVa)
EDNRB2 Chicken rec Mottled MS –
Chicken rec White MS –
Coat or feather colour: melanin synthesis
MC1R Bovine dom Black MS –
Bovine rec Red FS –
Bovine rec Telstar – Unknown
Pig dom Black MS1, MS2 –
Pig rec Red MS3 + MS4 –
Pig – Coat- colour diversity MS1–8, FS1 –
Pig som Black spotting (FS + MS2) –
Sheep dom Black MS1, MS2 –
Goat dom Black MS –
Goat rec Red SG –
Chicken dom Extended black MS1b –
Chicken rec Buttercup (MS1 + MS2)b –
ASIP Bovine 1/2 dom Brindle – INS (LINE)a
Sheep dom White or tan – DUPa
Sheep rec Self- colour black FS, 9bpDEL , MS –
TYR Bovine rec Albino FS –
Chicken rec Albino 6bpDEL –
Chicken rec White – INS (ERV)a
TYRP1 Bovine rec Dun MS –
Pig 1/2 dom Brown or blond 6bpDEL –
Sheep rec Light coat MS –
Goat dom Brown MS –
Coat or feather colour: melanin transport
PMEL Bovine rec Dilution MS, 3bpDEL –
Chicken dom White 9bpINSb –
Chicken dom Smokey (9bpINS + 12bpDEL)b –
Gene species transmission Phenotype Mutations
coding Regulatory
Coat or feather colour: melanin transport (cont.)
MLPH Bovine rec Cool grey FS –
Chicken rec Lavender MS1 –
Chicken rec Grey dilution MS2 –
COPA Bovine dom Red MS –
SLC45A2 Bovine rec Oculocutaneous albinism MS1, MS2 –
Chicken Z- linked rec Silver MS1, MS2 –
Muscle mass
MSTN Bovine 1/2 dom Double- muscling MS1–3, FS1–2, SG1–3,
SS1 –
Sheep 1/2 dom Double- muscling FS1, FS2 3′ UTR SNP
DLK1 + PEG11 Sheep Polar
overdominance Callipyge – IG SNP
Dermal features: horns
BTA1 (1.7–1.9 Mb) Bovine dom Polled – INDEL1a, INDEL2a, DUP1a
TWIST1 Bovine dom Scurs type 2 FS –
RXFP2 Sheep dom Polled – 3′ UTR INS (PG)a
Sheep 1/2 dom, sex- dep Horn size – 3′ UTR SNP
FOXL2 Goat dom Polled – DELa
Dermal features: hair, feather or shell structure
KRT27 Bovine dom Curly coat MS –
PRLR Bovine dom Slick coat SG –
Chicken Z- linked dom Slow feathering – DUPa+ INSa (ERV)
IRFBP2 Sheep rec Short and woolly fleece – 3′ UTR INS (PG)a
FMN1/GREM1 Goat dom Wattles Unknown –
PPARD Pig 1/2 dom Large and floppy ears MS –
SLCO1B3 Chicken 1/2 dom Blue eggshell – INS1 (ERV)a, INS2 (ERV)a
KRT75 Chicken 1/2 dom Frizzled feathering 69bpDEL –
CYP19A1 Chicken dom, sex- dep Henny feathering – INS (ERV)a
PDSS2 Chicken rec Silk feathering – SNP
HOXB8 Chicken 1/2 dom Muffs and beard – CNVa
GDF7 Chicken 1/2 dom Naked neck – INSa
FGF20 Chicken rec Featherless or scaleless SG –
Dermal features: comb
SOX5 Chicken dom Pea comb – DUPa
MNR2 Chicken dom Rose comb – Complex CNVa
SOX5 + MNR2 Chicken epistasis Walnut comb – (SOX5 DUPa+ MNR2
CNVa)
EOMES Chicken 1/2 dom Duplex comb – DUPa
Dermal features: pigmentation
BCO2 Sheep rec Yellow fat SG –
Chicken rec Yellow skin and shank colour SG –
EDN3 Chicken dom Silkie and dermal
hyperpigmentation – Complex CNV
a
of thousands to hundreds of thousands of offspring, thereby disseminating their deleterious mutations in the general population and leading to the emergence of affected individuals in subsequent generations. Before the advent of genomics, determining whether an elite sire carried such a common defect required time- consuming and expensive PT, that is, mating the sire with affected dams when possible (such as for mule-foot)73 or to known carriers or daughters and verifying
the occurrence of affected offspring. In the 1980s, it became possible to positionally clone the responsible gene, with the aim to develop a diagnostic marker. However, this was a very tedious multi- year effort that often required the generation of informative pedigrees to prove the genetic nature of the condition (which was not always obvious otherwise) and allow linkage mapping. This situation changed dramatically when genome- wide SNP arrays became available, which enabled effective autozygosity mapping using only a few affected individuals74. More recently, whole- genome
resequencing of small numbers of affected individuals has enabled autozygosity mapping and, in approxi-mately half of cases, simultaneous identification of the causative mutations in a matter of days, especially when taking advantage of sequenced reference populations such as the 1,000 Bull Genomes Project25(fIG. 1a). An
increasingly common approach for the management of recessive defects in livestock is to systematically col-lect samples from animals with severe defects and to sequence the whole genome of small sets of animals with similar symptoms as soon as they become availa-ble. Identifying an autozygous genomic segment — or better, a causative mutation — shared by all affected individuals confirms the genetic origin of the defect and readily provides a diagnostic test. As a result of these advances, the list of characterized defects in livestock in OMIA has markedly increased in recent years (fIG. 1b).
Germline mosaicism for deleterious dominant muta-tions is common. A number of genetic defects that were assumed to be recessive because of their rarity — only a small number of affected animals were detected among thousands of offspring from a healthy sire — could not be mapped by autozygosity mapping. In several cases, these defects were demonstrated to be caused by dom-inant de novo mutations (DNMs) for which the sire
was germline mosaic25,33,75,76. Unlike in humans, who
typically produce only one affected offspring, samples were available from a number of affected animals, which greatly facilitated the identification of the causative mutation. In at least one instance, neurocristopathy, it also enabled a modifier locus that affected disease severity to be mapped33.
Preliminary studies of the bovine germ line have shown that sires are mosaic for ~30% of DNM present in a sperm cell and that dams are mosaic for ~50% of DNM present in an oocyte77. These numbers may be
consid-erably higher than those in humans. Our preliminary data suggest that early embryonic cleavage is 20-fold more mutation- prone than cell divisions occurring later in development77 and that this increased rate of DNM
might be due, in part, to reproductive technologies routinely used in livestock, such as the combination of oocyte pick- up, in vitro oocyte maturation and in vitro oocyte fertilization (C.C., unpublished observations). Reverse genetic screens for EL mutations that compro-mise carrier fertility. It is likely that for the majority of LoF variants in essential genes, homozygosity will result in embryonic or fetal lethality rather than a genetic defect manifesting at or after birth. The economic effect of such mutations when carried by influential sires, in terms of lost pregnancies, can run into hundreds of millions of dollars78,79. Embryonic lethality is a
com-plex phenotype that is not observed directly and hence is difficult to study. Daughters of sires that carry EL mutations are expected to be less fertile (as measured, for instance, by the probability to return to heat after insemination), but the effect on the sire’s EBV is detect-able only for EL mutations that have reached high fre-quencies in the population80. reverse genetic screens have
been devised to overcome this issue. First, scientists have mined large genome- wide SNP data sets for haplotypes with considerable autozygous depletion, that is, haplo-types for which no individuals are found to be homo-zygous despite some being expected (fIG. 1c). At least 17 such haplotypes have been identified in cattle78,81–83 and 4
in pig84,85 (Supplementary Table 2). In a number of cases,
mining of population- based resequencing data sets in the corresponding genomic regions has identified the causative mutations25,79,86–88. However, to be effective, this
approach requires that the haplotype and the causative Overdominance
The phenotypic superiority (for example, on a quantitative scale) of heterozygotes (‘Aa’) over both homozygous classes (‘AA’ and ‘aa’).
Haplosufficient
Pertaining to genes for which one functional copy is sufficient to ensure normal development and function.
Compound heterozygosity Pertaining to the inheritance of two distinct mutations in different alleles of the same gene, one from each parent. Autozygosity mapping Mapping of a recessive mutation on the basis that all affected individuals will be homozygous for the same (autozygous) haplotype. Typically applied in genetically isolated populations in which the hypothesis of allelic homogeneity is reasonable. Modifier locus
A locus with variants that may (depending on the genotype of the individual) affect the phenotypic expression conferred by specific variants at another locus. The effects of modifier loci include suppression and epistasis. Reverse genetic screens Process aimed at completing the phenotype–genotype map by sorting individuals according to their genotype at a variant with unknown function and searching for shared phenotypes, as opposed to forward genetics, which consists of sorting individuals according to a phenotype and searching for shared variants.
Table 2 (cont.) | Breed- defining traits that have been characterized at the molecular level
Gene species transmission Phenotype Mutations
coding Regulatory
Fertility
BMP15 Sheep X- linked 1/2 dom Prolificity MS1–5, SG1–2, FS1–2 –
BMPR1B Sheep 1/2 dom Prolificity MS –
GDF9 Sheep 1/2 dom Prolificity MS1–5 –
B4GALNT2 Sheep 1/2 dom Prolificity – (SNP1 + SNP2)
Multiple mutations constituting one allele are bracketed. CNV, copy number variant; codom, co- dominant; DEL , deletion; dom, dominant; DUP, duplication; ERV, endogenous retrovirus; FS, frameshift; IG, intergenic; INDEL , insertion and/or deletion; INS, insertion; LINE, long interspersed nuclear element; MS, missense; PG, pseudogene; QUAD, quadruplication; rec, recessive; sex- dep, sex- dependent; SG, stop gain; SNP, single- nucleotide polymorphism; som, somatic; SS, splice site; UTR , untranslated region; xbpINS, x bp insertion; ybpDEL , y bp deletion. aStructural variants. bAllelic series involving the serial accumulation of
Blue (b) vs others (x) Orange (o) vs others (x) Green (g) vs others (x) Blue vs yellow Orange vs others Blue vs others Green vs others Yellow vs others Black (B) vs blue (b)
Depletion in homozygotes for EL-carrying black haplotype
Haplotype block: I II III IV V VI
nBB << pB2 nBb ~ 2pBpb/(1–pB2) nox ~ 2po(1–po) nxx ~ (1–po)2 noo ~ po2 ngx ~ 2pg(1–pg) nxx ~ (1–pg)2 ngg ~ pg2 nbx ~ 2pb(1–pb) nxx ~ (1–pb)2 nbb ~ pb2 nbb ~ pb2/(1–pB2) Number of publications Publication y ear 0 5 10 15 20 25 30 1987 1989 1991 1993 1995 1997 1999 2001 2003 2005 2007 2009 2011 2013 2015 2017 b Cattle (181) Sheep (56) Goat (14) Pig (32) Chicken (58) d Autozygous chromosome segments Carriers De novo mutation in founder a c Affected animals In silico identification of segregating coding variants in essential genes,
which are predicted to have severe effects on
protein function Design of custom SNP array to interrogate candidate EL Genotyping of large (n>10,000) cohorts • In entire population (Hardy–Weinberg disequilibrium) • In carrier × carrier matings (<0.25) Searching for depletion in homozygotes:
Population-based resequencing
mutation are in near perfect linkage disequilibrium (LD), and this is certainly not always the case. An alternative approach, therefore, is to mine the sequence data for candidate EL mutations (that is, LoF variants in essential genes) and to genotype these directly in large cohorts. The absence of homozygous individuals, particularly in the offspring of carrier- by-carrier matings, strongly sup-ports the EL nature of the corresponding variants. Using this approach, nine EL were uncovered in cattle that would not have been detected using haplotype- based approaches30 (fIG. 1d; Supplementary Table 2).
Culling carriers of deleterious recessive variants is not the right approach. Once information became availa-ble about EL mutations, the spontaneous reaction of breeding companies was to cull breeding animals, par-ticularly sires, that carry known deleterious mutations in order to assure customers that their animals will not have a known recessive defect. However, as the num-ber of identified mutations increases, the proportion of ‘mutation- free’ animals becomes vanishingly small. Furthermore, excessive use of such mutation- free sires is bound to cause the emergence of novel defects in sub-sequent generations and hampers genetic progress for other traits. Instead, the costs of the defect should be properly modelled and weighted against the economic value of the other traits in a selection index. Alternatively, the dam population could be genotyped to avoid mat-ings between parents carrying the same deleterious var-iants (see From selecting animals to selective matings using genomic information), or cross- breeding could be used, as it is less likely that the same EL defects segregate in different breeds.
GS for complex agricultural traits
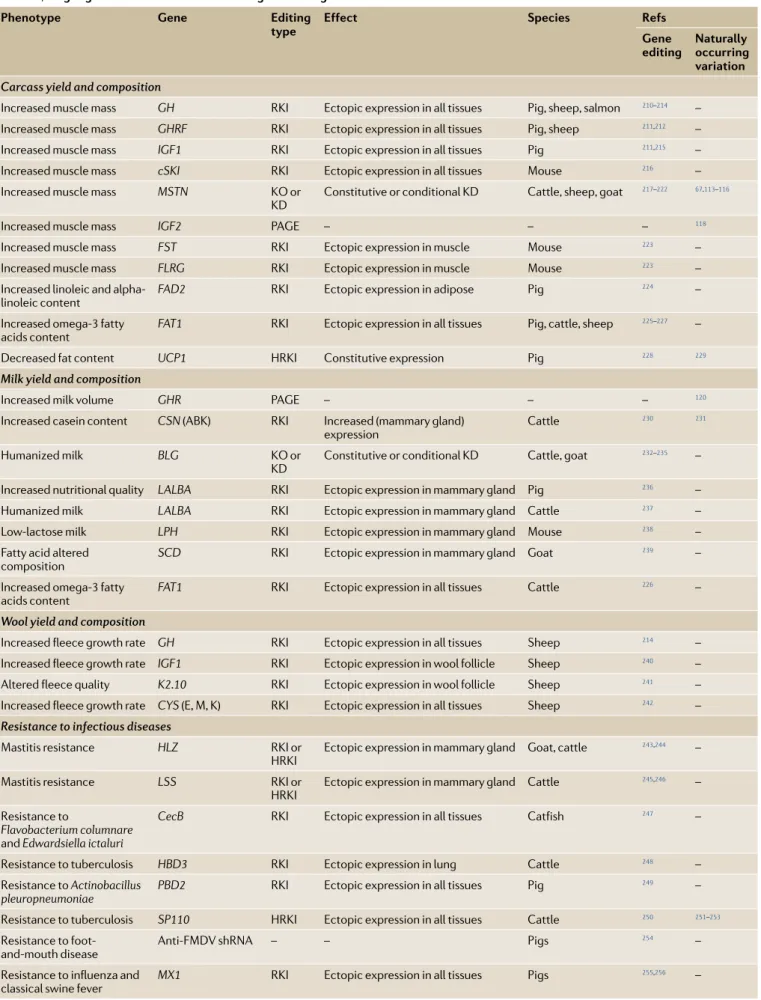
With the exception of the breed- defining characteris-tics, inherited defects and EL mutations discussed above, nearly all economically important traits in livestock are complex polygenic traits. They include milk yield and composition (that is, milk protein and fat yield), carcass yield, composition and quality (for example, marbling and tenderness), egg yield, growth rate, feed efficiency, fertility and disease resistance. Although some of these traits are categorical, most are continuously distrib-uted quantitative traits. The phenotypic variation of these traits is assumed to reflect the combined effects of developmental noise, differences in environmental
exposure and genotypic differences at a large number of loci scattered throughout the genome. The heritability (that is, the proportion of the trait variance that is caused by genetic factors) of these economically important traits in livestock typically ranges from ~5% to 50%. For a handful of traits, QTL mapping studies and GWAS analy-ses have identified loci with relatively large effects on the considered trait. However, the joint effects of these detectable loci typically explain only a limited fraction of the overall heritability. The most convincing evidence indicates that the remainder of the heritability is highly polygenic, corresponding to hundreds if not thousands of genetic variants that each has a very small effect on the trait of interest89. The contribution of each variant to
overall heritability is assumed to be mainly additive, that is, dominance and epistasis account for only a modest fraction of the variance9.
Before genomic tools made it possible to identify spe-cific loci by mapping experiments, quantitative geneti-cists made the simplifying assumption that heritability of quantitative traits was determined by an infinitely large number of variants of infinitely small effect that were spread uniformly throughout the genome. This model is known as Fisher’s infinitesimal model and is one of the pillars of quantitative genetics theory2. The
infini-tesimal model makes predictions about the expected phenotypic similarity of relatives as a function of their relatedness, underpins the methods used to estimate heritabilities and breeding values (BVs) of individu-als in pedigreed populations and guides the design of selection schemes in plant and animal breeding. The proven efficacy of plant and animal breeding and the good fit of genetic progress to predictions based on the infinitesimal model89 strongly suggest that a sizeable
proportion of the genetic architecture of most quanti-tative traits can be approximated reasonably well by the infinitesimal model.
GS under the infinitesimal model. One of the key fac-tors that determines the rate of genetic progress in a breeding programme is the accuracy of selection, that is, the accuracy with which animals with the best BVs are chosen as parents of the next generation. Among the methodological breakthroughs that have contrib-uted most to improving the accuracy of selection is the development and use of mixed models to estimate BVs90.
In these linear models, known environmental factors are fitted together with the BVs of individual animals, which are fitted as random effects. In attempting to find the best solutions for the random BVs, prior knowledge of their joint distribution is used. For instance, because full- sibs or parents and their offspring are closely related, their EBVs are expected to be more similar than those of unrelated animals. The infinitesimal model makes precise predictions about the shape of this joint distri-bution: BVs are normally distributed, and the covariance between the BVs of two animals is a simple function of their relatedness (that is, their kinship coefficient)91,92 and
the genetic variance of the trait. BVs for millions of ani-mals can be simultaneously estimated from correspond-ing sets of linear equations, yieldcorrespond-ing so- called best linear unbiased predictors (BLUPs) of the EBVs (box 2). Haplotypes
A combination of alleles at multiple variant positions transmitted by a gamete. The term is often used to describe variants that are located close to each other in the genome. Linkage disequilibrium (lD). The nonrandom association of alleles at two or more loci, which is manifest by the over- representation of specific haplotypes and the concomitant under- representation of others. Selection index A weighted sum of breeding values for several traits, each weighted by economic or perceived relevance. Kinship coefficient A measure of genetic relatedness between two individuals. The kinship coefficient corresponds to the probability that two alleles (one from each individual) drawn at random from the two possible alleles (maternal and paternal) for each individual for a randomly selected locus in the genome are identical by descent. The kinship coefficient between two individuals corresponds to the expected inbreeding coefficient of their putative offspring.
Fig. 1 | identification of mutations and genes causing monogenic defects in livestock. a | Autozygosity mapping: a defect- causing mutation (yellow star) in a haplosufficient gene appears by de novo mutation on a specific haplotype (labelled in blue) in a founder individual. The mutation spreads in the population as it is transmitted to descendants of the founder. In subsequent matings between healthy carriers, 25% of individuals are affected and are homozygous for the mutation and at least part of the blue haplotype of the founder. b | Number of monogenic traits for which the causative mutation was discovered by publication year and livestock species (data compiled from Online Mendelian Inheritance in Animals). c | Identification of haplotypes carrying embryonic lethal (EL) mutations: haplotypes are identified within blocks, and a Hardy– Weinberg- based test for their depletion in homozygotes in the population is performed for each haplotype. As the limits between haplotype blocks are poorly defined in livestock , window- based or hidden Markov model- based approaches are used. d | Flow chart of the steps involved in a sequence- based reverse genetic screen for EL mutations in livestock. SNP, single- nucleotide polymorphism.
Until approximately 10 years ago, kinship coefficients (needed to estimate BVs) were computed using gene-alogical information. Once genome- wide SNP arrays became available for livestock species, it became possi-ble to estimate kinship coefficients from SNP genotypes
rather than pedigree data93–95. Estimating EBVs with
mixed models using kinship coefficients deduced from SNP information is referred to as genomic BLUP (GBLUP) as opposed to standard pedigree- based BLUP, the corresponding estimates are known as GEBVs instead of EBVs, and the corresponding approach to breeding is called genomic selection (GS) (box 2).
One advantage of GBLUP over BLUP is that it is not reliant on pedigree information, which may not always be available or accurate. However, its main advantage is that SNP information better tracks and captures Mendelian sampling than does pedigree information. For example, on the basis of pedigree information only, full- sibs all have the same EBV. By contrast, SNP information enables allelic transmission to be tracked at positions where the parents are heterozygous and can therefore differentiate sibs. This information can have a major effect on the accuracy and utility of EBVs. Before GS, candidate elite dairy sires that had identi-cal EBVs based on pedigree information (for instance, because they were full- sibs) required expensive and time- consuming PT to expose differences in the BVs: their individual EBVs were estimated from the perfor-mances of tens to hundreds (depending on the country) of daughters, and PT took at least 5 years at a cost of ~US$50,000 per bull10. By contrast, as long as the
ref-erence population is large enough, GBLUP provides information of a similar accuracy to PT but at birth or earlier if SNP genotyping is performed on blastocyst biopsies (fIG. 2). For traits with high heritability (such as milk yield, h2 ≈ 0.3), the accuracy of GBLUP is typically
somewhat lower than that of a combination of PT and BLUP. However, this modest penalty is more than com-pensated for by the fact that the information becomes available 5 years earlier. For low heritability traits (such as fertility, h2 ≈ 0.05), GBLUP information is not only
available 5 years earlier but can even be more accurate than results obtained with PT combined with BLUP, depending on the size of the daughter groups used for PT. It is, therefore, no surprise that GBLUP was eagerly adopted worldwide by the dairy cattle breeding indus-try. As large- scale SNP genotyping rapidly became an outsourced commodity, the implementation of within- breed GBLUP in place of BLUP initially required only modest methodological adjustments, which also greatly facilitated the transition10.
The use of phenotypic records of hundreds of thou-sands to millions of pedigreed animals across many generations made a substantial contribution to the accuracy of BLUP. Most of these animals could obvi-ously not be retrospectively SNP genotyped. However, statistical methods have been devised to combine valu-able pedigree information with SNP data when availvalu-able. These single- step approaches are now routinely used in practice96–101.
An evaluation of the impact of 7 years of GS in US dairy cattle102 shows that the rates of genetic gain per
year increased 50–100% for high heritability traits, such as milk yield, and 300–400% for low heritability traits, such as somatic cell counts (SCCs, a measure of udder health) and daughter pregnancy rate (a measure of female fertility). Thus, GS enabled genetic gain that Box 2 | BLUP versus GBLUP
BLUP uses pedigree information to estimate BVs. Livestock selection has relied for
decades on the use of mixed model methodology to estimate breeding values (Bvs). the animals’ phenotypes are assumed to reflect differential exposure to known environmental factors (such as herd–year–season effects), as well as differences in intrinsic genetic ability (that is, the animals’ Bvs). Bvs are modelled as random effects with multivariate normal distribution. Following standard quantitative genetics theory, the covariance structure of the Bvs is assumed to reflect genetic relatedness:
σij= Θ2 ij Aσ2 (1)
where Θij is the kinship coefficient of individuals i and j and σA2 is the additive genetic
variance, where the matrix of 2Θij values is known as the additive relationship matrix A.
Note that this model implicitly assumes the infinitesimal model. Kinship coefficients are computed from pedigree information and used to constrain the Bv solutions, yielding so- called best linear unbiased predictors (BLuPs)2,90. BLuP- type approaches are extremely efficient and are able to extract information from millions of equations. an interesting feature of BLuP is that it allows estimation of Bvs for animals without phenotypic records, including Bvs for number of eggs or quantity of milk for males and Bvs for unborn animals. thus, BLuP can be seen as a method of statistical learning, in which the model is trained on a reference population that has both information on phenotypes and genetic relatedness and can then be used to predict the phenotype (including individual Bvs) for animals for which only relatedness information is available. For a non- inbred offspring with no record of its own but with perfect information for the parents, the maximum accuracy of BLuP is 0.707 (the square root of 0.5, as half the genetic variance is between families and half is within).
GBLUP uses genome- wide SNP information to predict Mendelian sampling.in genomic BLuP (GBLuP), the kinship coefficient, Θij, between two individuals is typically
estimated as the correlation between standardized (that is, standard deviations from the mean) allelic dosages across all single- nucleotide polymorphisms (sNPs)201,202. the matrix of 2Θij values computed from sNP data is known as the genomic relationship
matrix G. the accuracy of GBLuP is a function of the size of the training population (N), the trait heritability (h2) and the number of loci affecting the trait (M
e)203,204. a simple
equation that incorporates these parameters is:
= ∕
(
+)
Me Nh2 Nh2 Me (2)
under the infinitesimal model, Me corresponds to the effective number of
independent chromosome segments in the population. various estimates for Me are
available, with the simplest being: =
Me 2N Le (3)
where Ne is the effective population size and L is the length of the genome in
Morgans204. M
e is approximately 6,000 in Holstein–Friesian cattle and 45,000 in Merino
sheep. assuming the same- sized reference population, genomic estimated Bv (GeBv) will be more accurate in cattle205–207. Note that this formula for the accuracy of GBLuP is population- based — Me is the number of independent chromosome segments in the
population. if there are large full- sib or half- sib families in the population, accuracy is increased in some cases by taking advantage of the fact that within these families, Me is
much smaller204. estimates of M
e can also take into account the effect of family structure
between the reference population and selection candidates, as well as the covariance among chromosome segment effects, when Ne is low208. the maximum accuracy of
GBLuP approaches 1 for progeny with no records of their own, given an extremely large reference population. GBLuP can be seen as estimating sNP effects but also as using an estimator (based on sNPs) of realized instead of expected (based on pedigree) relationships209. the difference between expected and realized relationships results in the improved accuracy204.
was not dominated by production but was instead bal-anced between traits. As expected, the generation inter-val dramatically shortened, from 7 years to 2.5 years in the ‘sire of bull’ path (that is, elite bulls used to breed the next generation of bulls). The rate of inbreeding did not seem to be affected. Although the gains are less than those in dairy cattle, GS has also been applied and deemed profitable in defined contexts in beef cattle103,104,
pigs105, sheep106–108 and layer chickens109.
Another potential advantage of GS is that new traits can be included in selection indices to maximize genetic gain for profit. Provided a suitable reference population for these new traits can be constructed, genotyped selec-tion candidates will have a GEBV for these traits, and selection decisions can be made accordingly. For exam-ple, including GEBV for feed efficiency in the selection index for dairy cattle is expected to improve genetic gain for profitability by at least 3%110.
Accommodating non- normally distributed gene effects with Bayesian approaches. As with BLUP, GBLUP assumes that all segments of the genome contribute equally to the heritability of the trait, in accordance with the infinitesimal model. It can be shown that this is math-ematically equivalent to a BLUP model that fits the effect of individual SNPs111. However, GWAS indicate that this
assumption (that the effect of each SNP comes from a normal distribution, with the same variance across all SNP, such that all SNP effects are small) may not always be appropriate. Indeed, effects of a magnitude that is vir-tually impossible under this model have been identified and with GBLUP, their effects will be over- conservatively regressed downwards in genomic predictions. Examples of such major gene effects segregating within breeds include, among others, variants in MSTN in cattle112–115 and
sheep67 and RYR1, PRKAG3 and IGF2 in pig116–118, which all
affect muscularity; DGAT1, GHR and ABCG2, which affect milk yield and composition in cattle119–121; and PLAG1,
HMGA2 and LCORL, which affect stature in cattle122,123.
To better accommodate such large effects in GS, alternative prior distributions have been considered, mostly in a Bayesian framework. For instance, BayesA assumes a Student's t distribution of effects, which makes somewhat larger effects more likely8; BayesB assumes a
mixture distribution with a large spike of zero effects and a Student's t distribution for the remaining effects8;
BayesCπ assumes many effects at zero and the rest fol-lowing a normal distribution124; and BayesR assumes
SNP effects follow a multi- normal distribution125. The
accuracy of GEBV will be highest when the prior dis-tribution best matches the true disdis-tribution of SNP effects111. For example, for milk production traits
(par-ticularly fat percentage) affected by the DGAT1 mutation in cattle, accuracies of GS are higher with BayesA and BayesB than with GBLUP124.
The same methods can be used to study the genetic architecture of traits of interest. For example, a Bayesian method and a large number of dairy cattle with imputed whole- genome sequence data and milk production phenotypes were used to estimate the number of loci affecting these traits32. The study estimated that for milk
yield, 4,330 SNPs had a non- zero effect, with only 7 SNPs
explaining 1% or more of the genetic variation. Similar numbers were obtained for milk fat and protein yield. Balancing selection for variants with large effects is common in livestock. The occurrence of variants with large effects on complex quantitative traits seems to be much more common in livestock than in humans. This may be due, in part, to the strong directional selection to which nearly all livestock populations are subjected. DNMs with large effects on the selected traits sequen-tially undergo hard sweeps, causing large effects detect-able by GWAS until the corresponding variants reach fixation126. Furthermore, genomic studies have provided
ample evidence that several variants with large effects are maintained in livestock populations by balancing selection through a variety of mechanisms127.
For instance, a growing list of variants is known to improve performance in heterozygotes but cause a defect in homozygotes, and these variants are hence subject to balancing selection. Classic examples include a RYR1 variant in pigs that increases carcass yield in hetero-zygotes but causes porcine stress syndrome and related syndromes in homozygotes112 and bovine MSTN LoF
variants that increase muscle mass in heterozygotes but cause birthing difficulties for mothers of homozygous calves. Accordingly, the double- muscled phenotype, which is caused by homozygosity or compound hete-rozygosity for MSTN LoF variants, is avoided in most cattle breeds. In Belgian Blue cattle, disruptive variants in at least four genes (MRC2, RNF11, WWP1 and ATP2A1) are known to increase muscularity in heterozygotes but affect viability or fitness in homozygotes30,128–130.
Mutations in the ovine BMP15 and GDF9 genes increase litter size in heterozygotes but cause sterility in homo-zygotes131,132. In Scandinavian dairy cattle, a specific
hap-lotype increases milk production in heterozygotes but is lethal in homozygous embryos80.
Balancing selection also affects pleiotropic variants that have a positive effect on a desired trait but a negative effect on another trait. For example, a missense mutation in the SH2 domain of SOCS2 in sheep increases stature and milk yield but also increases susceptibility to mas-titis133. Similarly, an allele of the relaxin- like receptor 2
(RXFP2) locus in Soay rams increases horn size (and hence reproductive success) but reduces survival134.
The CLPG mutation, which causes callipyge muscular hypertrophy in sheep, is an example of polar overdom-inance, by which only heterozygous animals inheriting the mutation from a particular parent (the sire in the case of CLPG) express the phenotype68,135,136. Salmon
provide a remarkable example of balancing selection of VGLL3 variants, in which antagonistic selection for age at maturation in males versus females creates sex-ual conflict that is partially resolved by sex- dependent dominance137,138.
Other examples of balancing selection may reflect breeding objectives that change over time or differ between countries. For example, the K232A DGAT1 var-iant in cattle results in increased fat yield but decreased protein yield. As breeding objectives evolved, this allele went from being favoured to penalized to neutral119.
The segregation of PLAG1 variants that have a major Hard sweeps
The process by which the frequency of a favourable new variant rapidly increases in the population by positive selection until eventual fixation of the variant and the haplotype upon which it occurred.
Balancing selection A selective force on a locus that leads to a steady state whereby multiple alleles are simultaneously maintained in the population, rather than one allele becoming fixed at the expense of the others.
Elite dam OPU IVM IVF Elite sire BLUP selection a b 9 months 30 months 12 months 40 months BV BV Performance testing Progeny testing Reference population 12 months 9 months GBV GBV GBV GBV BLUP selection GBLUP selection GBLUP selection Elite dam OPU IVM IVF Elite sire GS model 8 04618 93043 3 0 79880 27591 4 2 95052 62115 2 8 83522 84517 4 6 71860 01362 4 3 74630 98254 7 1 82547 12067 9 4 93643 66813 2 8 04618 93043 3 0 79880 27591 4 7 83466 10423 0 2 95052 62115 2 7 10472 29566 0 8 83522 84517 4