THÈSE
THÈSE
En vue de l’obtention du
DOCTORAT DE L’UNIVERSITÉ DE TOULOUSE
Délivré par : l’Université Toulouse 3 Paul Sabatier (UT3 Paul Sabatier)
Présentée et soutenue le 15/01/2015 par :
Saif ul ISLAM
Energy Management in Content Distribution Network Servers.
JURY
Wilfrid Lefer Professeur d’Université Rapporteur
Jean-Marc Nicod Professeur d’Université Rapporteur
Georges Da Costa Maître de Conférence Examinateur
Jean-Marc Pierson Professeur d’Université Directeur de Thèse
École doctorale et spécialité :
MITT : Domaine STIC : Réseaux, Télécoms, Systèmes et Architecture
Unité de Recherche :
Institut de Recherche en Informatique de Toulouse (UMR 5505)
Directeur(s) de Thèse :
Jean-Marc Pierson
Rapporteurs :
i
Abstract
Explosive increase in Internet infrastructure and installation of energy hungry de-vices because of huge increase in Internet users and competition of efficient Internet services causing a great increase in energy consumption. Energy management in large scale distributed systems has an important role to minimize the contribu-tion of Informacontribu-tion and Communicacontribu-tion Technology (ICT) industry in global CO2 (Carbon Dioxide) footprint and to decrease the energy cost of a product or ser-vice. Content Distribution Networks (CDNs) are one of the popular large scale distributed systems, in which client requests are forwarded towards servers and are fulfilled either by surrogate servers or by origin server, depending on contents availability and CDN redirection policy.
Our main goal is therefore, to propose and to develop simulation-based princi-pled mechanisms for the design of CDN redirection policies which will do and carry out dynamic decisions to reduce CDN energy consumption and then to analyze its impact on user experience constraints to provide services.
We started from modeling surrogate server utilization and derived surrogate server energy consumption model based on its utilization. We targeted CDN redirec-tion policies by proposing and developing load-balance and load-unbalance policies using Zipfian distribution, to redirect client requests to servers. We took into ac-count two energy reduction techniques, Dynamic Voltage Frequency Scaling (DVFS) and server consolidation. We applied these energy reduction techniques in the con-text of a CDN at surrogate server level and injected them in load-balance and load-unbalance policies to have energy savings.
In order to evaluate our proposed policies and mechanisms, we have emphasized, how efficiently the CDN resources are utilized, at what energy cost, its impact on user experience and on quality of infrastructure management. For that purpose, we have considered surrogate server’s utilization, energy consumption, energy per request, mean response time, hit ratio and failed requests as evaluation metrics. In order to analyze energy reduction and its impact on user experience, energy consumption, mean response time and failed requests are considered more important
parameters.
We have transformed a discrete event simulator CDNsim into Green CDNsim and evaluated our proposed work in different scenarios of a CDN by changing: CDN surrogate infrastructure (number of surrogate servers), traffic load (number of client requests) and traffic intensity (client requests frequency) by taking into account previously discussed evaluation metrics.
We are the first who proposed DVFS and the combination of DVFS and con-solidation in a CDN simulation environment, considering balance and load-unbalance policies. We have concluded that energy reduction techniques offer con-siderable energy savings while user experience is degraded. We have exhibited that server consolidation technique performs better in energy reduction while surrogate servers are lightly loaded. While, DVFS impact is more considerable for energy gains when surrogate servers are well loaded. Impact of DVFS on user experience is lesser than that of server consolidation. Combination of both (DVFS and server consolidation) presents more energy savings at higher cost of user experience degra-dation in comparison when both are used individually.
Keywords: Content Distribution Networks, Energy Management, User Experi-ence
iii
Acknowledgments
At the end of my thesis I would like to thank everyone who made this thesis possible for me.
First of all, I would like to express my deepest, sincere and greatest sense of Appreciation and Gratitude to my supervisor Professor Jean-Marc Pierson for all his enthusiasm, kindness, patience, and outstanding support without which this thesis would not have been possible. I found him always smiling, encouraging and helping a lot whenever I needed him. Briefly, I don’t have words to thank you Jean-Marc for being the excellent person you are. It is a great honor for me to work with you.
I acknowledge my gratitude to Konstantinos Stamos for his great help to initial-ize my work and for his continuous support during my PhD. I would like to express my sincere gratitude to François Thiebolt for his unreserved technical help since the start of my thesis. I am indebted to Thomas Zilio for his great support during my experimental and result oriented phase. It was a great pleasure to work with nice people like you.
I also would like to thank SEPIA team members (George Da Costa, Amal Sayah, Patricia Stolf and Daniel Hagimont) for their fruitful discussions, comments and advices during my stay at IRIT. I am glad to be part of this great team.
I am delighted to pass an excellent time with colleagues and friends. Thank you for unforgettable moments and great company.
I would like to express my gratitude to reporters of my thesis Professor Jean-Marc Nicod and Professor Wilfrid Lefer for making me honor to review my work. I also thank to George Da Costa for taking his precious time to evaluate my work. I am very thankful to Martine Labruyere and Chantal Morand who contributed to the warm atmosphere which I have experienced during my stay in France.
The Higher Education Commission (HEC) Pakistan, Université Toulouse III -Paul Sabatier and Institut National Polytechnique de Toulouse (INPT) are grate-fully acknowledged for their financial support to this study.
throughout my academic career who have a great role for this day.
At a personal level, I wish to especially thank my parents, my brother and my sisters for everything they have done and even sacrificed to help me reach this point. Finally, and above all my gratitude towards God, who is faithful beyond human comprehension, cannot be expressed by words. Without the help of God, I am sure that this would not have seen the light of this day.
Contents
I Complete dissertation: English version 1
1 Introduction 3
1.1 Why Do We Conserve Energy? . . . 4
1.2 Who Does Energy Conservation? . . . 5
1.3 What is Green ICT? . . . 6
1.4 Area of Interest, Objectives and Contributions . . . 7
1.4.1 Objectives. . . 11
1.4.2 Contributions . . . 11
1.5 Thesis Organization . . . 12
2 State of the Art 15 2.1 Basic Terms . . . 16
2.2 Energy Measurement and Profiling Techniques . . . 16
2.3 Reducing Energy Consumption in Computing Systems . . . 18
2.3.1 Dynamic Voltage Frequency Scaling (DVFS) . . . 18
2.3.2 Energy Reduction in Cluster of Servers . . . 24
2.3.3 Reducing Energy Consumption of Content Delivery . . . 29
2.4 Conclusion . . . 35
3 Content Delivery Networks Simulation 37 3.1 CDNsim . . . 38
3.1.1 Input Parameters. . . 38
3.1.2 Our Proposed Input Parameters . . . 44
3.2 From CDN Utility to CDN Utilization . . . 47
3.2.1 Factors Affecting CDN Utilization . . . 50
3.3 Evaluation Parameters . . . 54
3.3.1 Client Side Evaluation Metrics . . . 55
3.4 Summary of Changes Made in Original CDNsim . . . 57
3.5 Conclusion . . . 60
4 Policies for Energy Conservation in Content Distribution Networks (CDNs) 63 4.1 CDN Redirection Policies . . . 64
4.1.1 Load-Balance . . . 65
4.1.2 Load-Unbalance . . . 66
4.2 Surrogate Server Utilization and Energy Consumption . . . 66
4.2.1 Surrogate Server Utilization . . . 66
4.2.2 Surrogate Server Utilization Model . . . 68
4.2.3 Energy Consumption in CDN Servers . . . 71
4.2.4 Surrogate Server’s Energy Consumption Model . . . 71
4.3 Energy Aware CDN Redirection Policies . . . 76
4.3.1 DVFS Aware Policies. . . 77
4.3.2 Consolidation and DVFS Aware Policies . . . 84
4.4 Results Discussion . . . 89
4.4.1 Load-Balance . . . 89
4.4.2 Load-Unbalance . . . 98
4.4.3 Load-Unbalance Power-Off . . . 108
4.5 Conclusion . . . 121
5 Comparison of Energy-Aware CDN Redirection Policies 123 5.1 Surrogate Server Utilization . . . 125
5.2 Energy Consumption . . . 128
5.3 Energy per Request . . . 132
5.4 Mean Response Time. . . 134
5.5 Hit Ratio . . . 136
5.6 Failed Requests . . . 139
Contents vii
6 Comparison of Energy Aware CDN Redirection Policies
(Evaluat-ing Impact of Client Request Frequency) 145
6.1 Number of Surrogate Servers Turned-On . . . 147
6.2 Energy Consumption . . . 148
6.3 Energy per Request . . . 149
6.4 Mean Response Time. . . 150
6.5 Hit Ratio . . . 152
6.6 Failed Requests . . . 154
6.7 Conclusion . . . 155
7 Conclusion and Perspectives 157 7.1 Conclusion . . . 157
7.2 Perspectives . . . 161
II Summary :French version 163 1 Version Française 165 1.1 Résumé . . . 165 1.2 Introduction. . . 167 1.2.1 Domaine d’intérêt . . . 168 1.2.2 Objectifs . . . 169 1.2.3 Contributions . . . 169
1.3 Simulation des Content Delivery Networks (CDNs) . . . 170
1.3.1 CDNsim . . . 170
1.3.2 Du CDNsim au Green CDNsim . . . 171
1.4 Politiques pour l’économie d’énergie dans les Content Delivery Net-works (CDNs) . . . 171
1.4.1 Consommation d’énergie des serveurs des Content Delivery Networks . . . 173
1.4.2 Politiques . . . 174
1.6 Conclusion et Perspectives. . . 181
List of Figures
1.1 Worldwide Internet users by region [live stats 2014]. . . 8
1.2 Worldwide Internet users [live stats 2014]. . . 8
1.3 Estimation of annual electricity cost for companies with large infras-tructure [Qureshi 2009]. . . 9
1.4 An overlay network is built on the top of Internet to work as a bridge between modern application requirements and the Internet basic ser-vices.. . . 9
1.5 A typical CDN architecture. . . 10
2.1 CCN network communication model [Jacobson 2012].. . . 29
2.2 High level NaDa architecture. Content can be served by home gate-way as well [Valancius 2009]. . . 31
2.3 GreenCoop model . . . 31
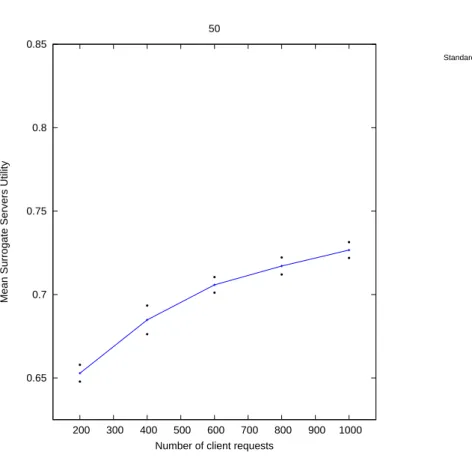
3.1 Mean surrogate servers utility, for 50 surrogate servers over different number of client requests for Load-Unbalance policy. . . 51
3.2 Surrogate servers utilization, for 50 surrogate servers over different number of client requests for Load-Unbalance policy. . . 52
3.3 Average utilization of the surrogate servers over 400k client requests for Load-Unbalance policy.. . . 53
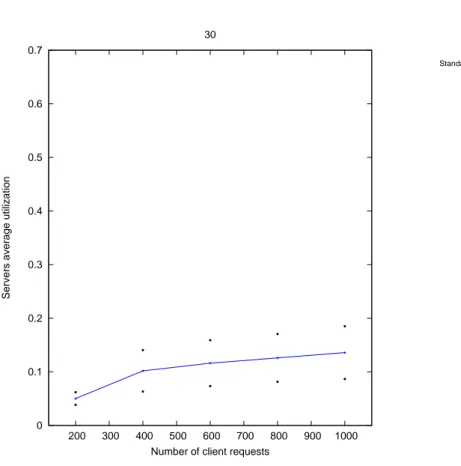
3.4 Average utilization of 30 surrogate servers over different number of client requests for Load-Unbalance policy. . . 54
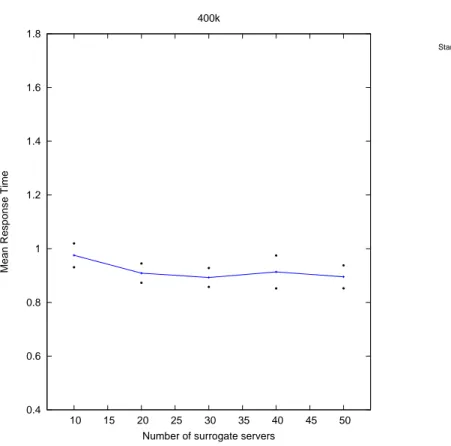
3.5 Mean response time over 400k client requests for Load-Unbalance policy. . . 55
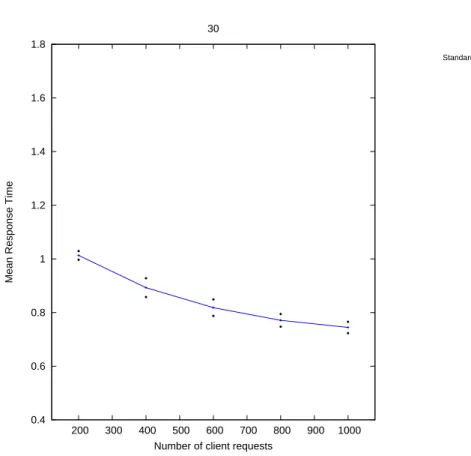
3.6 Mean response time over 30 surrogate servers over different number of client requests for Load-Unbalance policy. . . 56
4.2 Utilization (%) of 30 surrogate servers for serving 400k client requests (Load-Balance).. . . 72
4.3 Utilization (%) of 30 surrogate servers for serving 400k client requests (Load-Unbalance). . . 72
4.4 Utilization (%) of 30 surrogate servers for serving 1000k client re-quests (Load-Balance). . . 73
4.5 Utilization (%) of 30 surrogate servers for serving 1000k client re-quests (Load-Unbalance). . . 73
4.6 Utilization (%) of 50 surrogate servers for serving 400k client requests (Load-Balance).. . . 74
4.7 Utilization (%) of 50 surrogate servers for serving 400k client requests (Load-Unbalance). . . 74
4.8 Utilization (%) of 50 surrogate servers for serving 1000k client re-quests (Load-Balance). . . 75
4.9 Utilization (%) of 50 surrogate servers for serving 1000k client re-quests (Load-Unbalance). . . 75
4.10 Energy-aware CDN redirection policies. . . 88
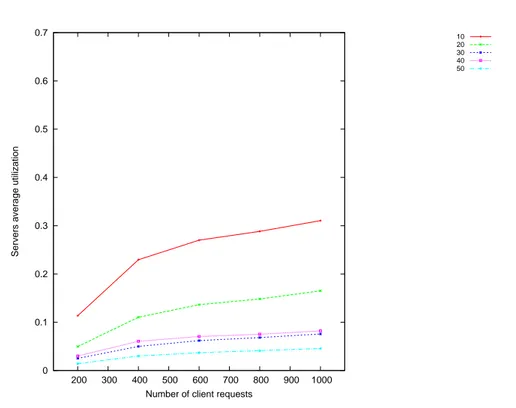
4.11 Surrogate servers Average utilization vs. number of client requests (×103) for different number of surrogate servers, for Load-Balance policy. . . 90
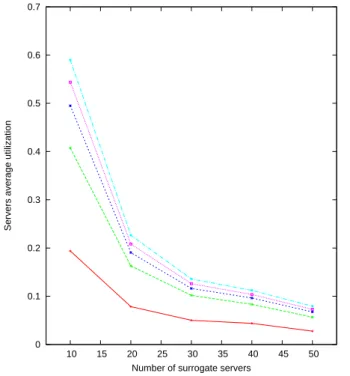
4.12 Surrogate servers average utilization vs. number of surrogate servers serving different number of client requests, for Load-Balance policy. 90
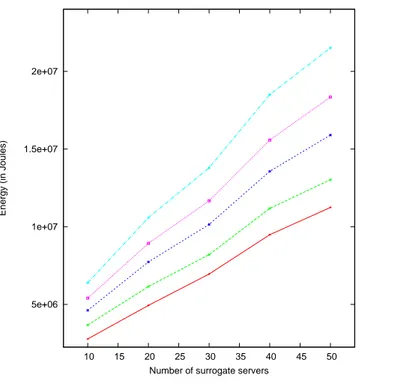
4.13 Surrogate servers energy consumption vs. number of client requests (×103) for different number of surrogate servers, for Load-Balance policy. . . 92
4.14 Surrogate servers energy consumption vs. number of surrogate servers for different number of client requests, for Load-Balance policy. . . 92
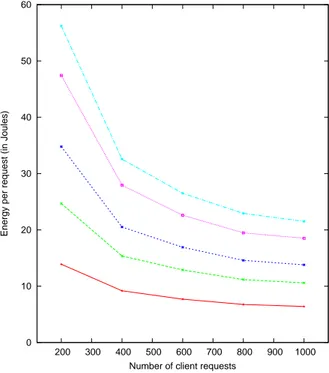
4.15 Energy per request vs. number of client requests (×103) for different number of surrogate servers, for Load-Balance policy.. . . 93
4.16 Energy per request vs. number of surrogate servers, serving different number of client requests, for Load-Balance policy. . . . 93
List of Figures xi
4.17 Mean response time vs. number of client requests (×103) for different number of surrogate servers, for Load-Balance policy.. . . 95
4.18 Mean response time vs. number of surrogate servers, serving different number of client requests, for Load-Balance policy. . . . 95
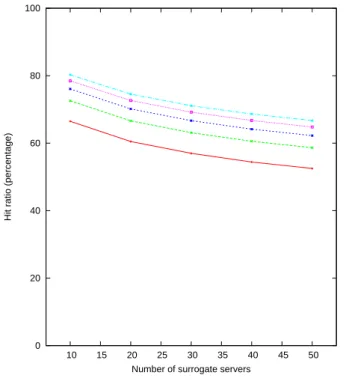
4.19 Hit ratio (%) vs. number of client requests (×103) for different num-ber of surrogate servers, for Load-Balance policy. . . . 97
4.20 Hit ratio (%) vs. number of surrogate servers, serving different num-ber of client requests, for Load-Balance policy. . . . 97
4.21 Number of completed requests vs. number of client requests (103) for different number of surrogate servers, for Load-Balance policy. 99
4.22 Surrogate servers Average utilization vs. number of client requests (×103) for Load-Unbalance policy. . . . 101
4.23 Surrogate servers Average utilization vs. number of surrogate servers, serving different number of client requests, for Load-Unbalance pol-icy. . . 101
4.24 Surrogate servers energy consumption vs. number of client requests (×103) for Load-Unbalance policy. . . . 102
4.25 Surrogate servers energy consumption vs. number of surrogate servers, serving different number of client requests, for Load-Unbalance pol-icy. . . 102
4.26 Energy per request vs. number of client requests (×103) for different number of surrogate servers, for Load-Unbalance policy. . . . 103
4.27 Energy per request vs. number of surrogate servers, serving different number of client requests, for Load-Unbalance policy. . . . 103
4.28 Mean response time vs. number of client requests (×103) for different number of surrogate servers, for Load-Unbalance policy. . . . 104
4.29 Mean response time vs. number of surrogate servers, serving different number of client requests, for Load-Unbalance policy. . . . 104
4.30 Hit ratio (%) vs. number of client requests (×103) for different num-ber of surrogate servers, for Load-Unbalance policy. . . . 106
4.31 Hit ratio (%) vs. number of surrogate servers, serving different num-ber of client requests, for Load-Unbalance policy. . . . 106
4.32 Number of failed requests vs. number of client requests (×103) for different number of surrogate servers, for Load-Unbalance policy. . 107
4.33 Surrogate servers average utilization vs. number of client requests (×103), for different number of surrogate servers, for Load-Unbalance
Power-Off policy. . . . 109
4.34 Surrogate servers Average utilization vs. number of surrogate servers, serving different number of client requests, for Load-Unbalance
Power-Off policy. . . . 109
4.35 Surrogate servers energy consumption vs. number of client requests (×103) for different number of surrogate servers, for Load-Unbalance
Power-Off policy. . . . 110
4.36 Surrogate servers energy consumption vs. number of surrogate servers, serving different number of client requests, for Load-Unbalance
Power-Off policy. . . . 110
4.37 Energy per request vs. number of client requests (×103) for different number of surrogate servers, for Load-Unbalance Power-Off policy.111
4.38 Energy per request vs. number of surrogate servers, serving different number of client requests, for Load-Unbalance Power-Off policy. 111
4.39 Mean response time vs. number of client requests (×103) for different number of surrogate servers, for Load-Unbalance Power-Off policy.113
4.40 Mean response time vs. number of surrogate servers, serving different number of client requests, for Load-Unbalance Power-Off policy. 113
4.41 Hit ratio (%) vs. number of client requests (×103) for different num-ber of surrogate servers, for Load-Unbalance Power-Off policy. . 115
4.42 Hit ratio (%) vs. number of surrogate servers, serving different num-ber of client requests, for Load-Unbalance Power-Off policy. . . 115
4.43 Failed number of client requests regarding number of surrogate servers vs number of client requests (×103), for Load-Unbalance
List of Figures xiii
4.44 Number of surrogate servers powered-on over simulation time for serving 800k requests for different number of surrogate servers. . . . 117
4.45 Number of surrogate servers powered-on over simulation time for 40 surrogate servers for serving different number of client requests . . . 118
4.46 Response time for client requests over simulation time for serving 1000k requests for different number of surrogate servers . . . 119
4.47 Response time for client requests over simulation time for 40 surro-gate server for serving different number of client requests . . . 120
5.1 Surrogate servers average utilization vs. number of requests (103) for different policies. . . 126
5.2 Surrogate servers average utilization vs. number of surrogate servers for different policies. . . 127
5.3 Energy consumption vs. number of requests (103) for different policies.128
5.4 Energy consumption vs. number of surrogate servers for different policies. . . 129
5.5 Energy consumption vs. number of requests (103) for different policies.130
5.6 Energy consumption vs. number of surrogate servers for different policies. . . 131
5.7 Energy per request vs. number of requests (103) for different policies. 132
5.8 Energy per request vs. number of surrogate servers for different policies.133
5.9 Mean response time vs. number of requests (103) for different policies.134
5.10 Mean response time vs. number of surrogate servers for different policies. . . 135
5.11 Mean response time vs. number of requests (103) for different policies.136
5.12 Mean response time vs. CDN redirection policies.. . . 137
5.13 Hit ratio vs. number of requests (103) for different policies. . . 138
5.14 Hit ratio vs. number of surrogate servers for different policies.. . . . 139
5.15 Failed requests vs. number of requests (103) for different policies. . . 140
6.1 Surrogate servers ON vs. simulation time for different client request frequencies for load-unbalance power-off policy. . . 146
6.2 Energy consumption vs. frequency of client requests for different policies (except FreqMin and FreqMed). . . 147
6.3 Energy consumption vs. frequency of client requests for different policies. . . 148
6.4 Energy per request vs. mean inter-arrival time of requests for differ-ent policies. . . 150
6.5 Mean response time vs. mean inter-arrival time of requests for dif-ferent policies (except FreqMin and FreqMed). . . 151
6.6 Mean response time vs. mean inter-arrival time of requests for powering-off policies. . . 152
6.7 Hit ratio vs. mean inter-arrival time of requests for different policies. 153
6.8 Failed requests vs. mean inter-arrival time of requests for different policies. . . 154
List of Tables
2.1 Characteristics of some existing work. Con = Consolidation; LB =
Load-Balance; LUB = Load-Unbalance; UE = User Experience . . . 36
3.1 Summary of simulations parameters . . . 61
4.1 Global DVFS Policies . . . 80
4.2 Local DVFS Policies . . . 83
4.3 Global DVFS Policies . . . 87
5.1 Impact DVFS and Power-Off: Load-Balance and Load-Unbalance (case of 40 surrogate servers serving 1000k requests), compared with the case of Load-Balance(FreqMax) E/R = Energy per Request; MRT = Mean Response Time; HR = Hit Ratio; FR = Failed Re-quests; LB = Load-Balance; LUB = Load-Unbalance . . . 142
5.2 Impact DVFS and Power-Off : Load-Unbalance (case of 40 surrogate servers serving 1000k requests), compared with the case of Load-Unbalance (FreqMax) . . . 143
1.1 Récapitulatif des paramètres de simulation . . . 172
1.2 Les Politiques Locales DVFS . . . 175
1.3 Impact de DVFS et de l’arrêt des serveurs proxy : équilibre et déséquilibre des charges : (cas de 40 serveurs proxy répondant aux 1000k requêtes utilisateurs) comparé au cas de l’équilibre des charges(LB FreqMax) E/R = Energie par requête; MRT = Temps de réponse moyen; HR = Hit Ratio; FR = Requêtes échouées; LB = Equilibre des charges; LUB = Déséquilibre des charges . . . 179
1.4 Impact de DVFS et de l’arrêt des serveurs proxy : déséquilibre des charges (cas de 40 serveurs proxy répondant à 1000k requêtes util-isateurs), comparé au cas de déséquilibre des charges (LUB FreqMax)180
Part I
Complete dissertation: English
version
Chapter 1
Introduction
Contents
1.1 Why Do We Conserve Energy? . . . . 4
1.2 Who Does Energy Conservation? . . . . 5
1.3 What is Green ICT? . . . . 6
1.4 Area of Interest, Objectives and Contributions . . . . 7
1.4.1 Objectives. . . 11
1.4.2 Contributions . . . 11
1.5 Thesis Organization . . . . 12
Since technological evolution, human life is based on the utilization of machines, sometimes we feel that our life is fully mechanized by machines that are around us. A simple scenario of our daily life starts with a sound of clock alarm to wake up in the morning. A means of transportation to get to work, a coffee machine for drinking coffee, using elevator to go to office etc. Each of these machines consumes energy and the production of this energy emits CO2 (Carbon Dioxide) and nuclear waste. In the last two decades, we began to feel a large effect of CO2 and a wide energy consumption. Due to the vast exploitation of machinery, energy prices are becoming more and more expensive. To deal with such an explosive use of machines, and by that the large energy consumption, different research axes, focusing on reduction of energy consumption have been launched. The ultimate goal of this intensive field of research is to provide new energy-aware and environment friendly technologies and mechanisms.
1.1
Why Do We Conserve Energy?
• To Protect Environment: It is our social responsibility to change and improve our life style to consume less energy. There are many challenges to our en-vironment e.g. global warming. When we consume more energy, more heat will be produced while consuming less energy, less heat will be ejected to the outdoor environment, ensuring cooler ambient temperature. As a result of that our environment remains green which is a need of today and also re-quirement for a secure future. Always these types of world issues take greater attention of the communities. Global warming has become a world issue, the efforts and contributions of the corporations are judged and appreciated by communities. The governments and environmental agencies are active to face the challenge of global warming [The Climate Group 2008]. If energy conser-vation becomes a top priority of any organization then it contributes towards greener environment.
• Economic Benefit: Energy cost is one of the major costs of an organization, enterprise and even for a household. The less energy consumption will reduce the overall cost of a product or service. So, the energy conservation helps organizations to reduce operating cost and to be more competitive.
With the passage of the time, the behavior of the market is changing according to the changes in the needs. Many new business opportunities are being created accordingly. The idea of the reducing energy consumption has also effected the trend of the market. The green products have attracted the manufacturers and customers attention. New products with the green tag are coming into the markets which have created new business opportunities.
• Equipment Lifespan Prolongation: Efficient consumption of energy prolongs the lifespan of equipment. For energy conservation, equipment has to be maintained well to operate efficiently. Equipment that consumes less energy will experience less wear and tear. By using energy conservation, equipment operate efficiently with a longer lifespan.
1.2. Who Does Energy Conservation? 5
• Solution to Energy Shortage: With the new inventions and increasing comfort needs of the communities, energy needs are increasing. Every year usage of energy is increasing. In many parts of the world, energy needs are more than the energy production. These communities are suffering with the problem of energy shortage. If the energy efficient solutions are adopted, it can help to overcome the energy shortage problem and with the same consumption of energy more services can be gained. So, energy conservation provides the economical and environment friendly solution to energy shortages problem.
1.2
Who Does Energy Conservation?
It is not one profession of energy conservation or efficiency, many sectors contribute to make the world more efficient. Computer scientists, chemists, mechanical en-gineers, electrical enen-gineers, mathematicians etc can contribute to provide smart solutions to minimize energy consumption.
• Economy experts can compare the different products or services with or with-out energy conservation or efficiency mechanisms and can provide the idea that which product or service is least expensive. They can also provide analysis of the price vs. life of the product. It can guide the customers or organizations to make a choice.
• The energy-aware products and services provide opportunities to the business and commercial communities to contribute towards energy reduction.
• Lawyer community can also guide to the concept of green world by providing their services to make the license process easy for energy-aware solutions. • Designers can play an important role to make the world green. The systems
and the controls can be designed to provide green solutions in a huge amount instead of individual technologies.
• Energy auditors consider how the energy is used in the system. They can recommend the energy-aware techniques and technologies.
• Awareness can be developed in the educational institutions to have a green environment.
• Every individual can contribute to opt for smart mechanisms or to use energy-aware technologies to have a green world. In other words, everyone can do energy efficiency.
1.3
What is Green ICT?
ICT (Information and Communication Technology) contributes more than 2% in the global CO2footprint that is increasing day by day [Christensen 2009]. In a business as usual scenario (BAU), CO2 emissions by the ICT sector are expected to increase from 0.53 billion tonnes (Gt (Gigatonnes)) carbon dioxide equivalent (CO2e) in 2002 to 1.43GtCO2e in 2020 [The Climate Group 2008]. The ICT sector has also been directed to evaluate its impact on environmental changes. It is important to estimate CO2 emissions from ICT industry and to create opportunities for ICT contributions to enable the low carbon economy. There is intensive need to push the world in this direction.
No doubt ICT has provided a lot of opportunities to sustain the environment but at the same time, it has changed the life style to more energy consuming society. ICT discoveries and developments are directing towards the more resource consuming behaviors which are contributing to change the environment. Hence ICT itself is the part of the problem but also a part of the solution. The term Green ICT is used to address this problematic role of ICT. The aim is to make it environment friendly by changing its overall impact. Basically, the topic Green ICT was used to evaluate the direct affects of ICT on the environment for example its production, use and services but nowadays it is used as term to use the ICT to make the things environment friendly in other domains as well. This is because of the expanded use of the ICT everywhere.
1.4. Area of Interest, Objectives and Contributions 7
1.4
Area of Interest, Objectives and Contributions
Internet has made the communication faster and easy. The basic idea of Internet was to serve as a heterogeneous network of networks to connect different entities for communicating in a best effort way. Today’s Internet has got mature to the point that web browsing and e-mail are no longer the main features. Content providers and e-commerce organizations view the Internet as a tool to make available their rich contents to their widely dispersed customers (as shown in Figure 1.1). Internet users are also increasing significantly every year (as presented in Figure
1.2). Therefore, there is very fast increase in the Internet infrastructure. Today’s Internet is comprised of more than 13, 000 autonomous networks [Sitaraman 2014]. This change caused a trend towards the grand, geographically distributed systems [Qureshi 2009]. These systems can have a huge amount of servers and many data centers. Millions of watts of power may be required to run a large data center [Katz 2009] as shown in Figure 1.3. Internet providers are installing more energy consuming devices in order to provide better services. Energy cost of the Internet infrastructure is increasing every year, that affects the both organizations and their customers as well. According to [Gyarmati 2010], 15% of data centers’ cost is in terms of energy consumption. One of a popular large scale distributed systems for content delivery Akamai, is estimated to spend a $10M (Millions) of electricity cost every year [Qureshi 2009]. Reduction in energy consumption may play an important role to decrease over all cost [Vasić 2010].
To explore the energy consumption and its reduction in large scale distributed systems is a hot research area [Orgerie 2013], [Chiaraviglio 2010], [Pierson 2013], [Da Costa 2009], [Hlavacs 2009] with important practical applications. A popular type of such a network is the Content Distribution Network (CDN) [Pallis 2006]. CDN is an overlay network (as illustrated in Figure 1.4). A CDN is responsible for managing the large amount of content traffic originating from the Web users. A CDN consists of a set of surrogate servers geographically distributed in the Web, which contain copies (replicas) of content belonging to the origin server (according to a specific storage capacity). Taking example of Akamai, a large scale content
Figure 1.1: Worldwide Internet users by region [live stats 2014].
1.4. Area of Interest, Objectives and Contributions 9
Figure 1.3: Estimation of annual electricity cost for companies with large infras-tructure [Qureshi 2009].
provider has deployed more than 100, 000 surrogate servers in over 1150 networks around the world (in over 80 countries) [Sitaraman 2014]. The main idea is to bring content replicas closer to the user. Therefore, CDNs act as a network layer between the origin server and the user, for handling their requests. With this approach, content is located nearer to the user, yielding low response time and high content availability since many replicas are distributed. The origin server is relieved from the requests since the majority of them are handled by the CDN servers. A typical
Figure 1.4: An overlay network is built on the top of Internet to work as a bridge between modern application requirements and the Internet basic services.
CDN (as shown in Figure 1.5) includes following functions:
• Content Distribution Services: Geographically distributed set of surrogate servers, which store the data on behalf of the origin server or using data replication.
• Request Redirection and Content Delivery Services: Client requests are di-rected towards the closest servers either in terms of proximity or load. • Cooperation Services: Surrogate servers may cooperate with each other in
order to fulfill the client requests. If a client sends content request to a server, the server checks for the content in its cache: If the content is not available in its cache it forwards the request to the neighboring surrogates or to the origin server.
• Management Services: Services to control utilization of the contents, manag-ing copy rights etc.
• Content adaptation services, e.g. format conversion.
Figure 1.5: A typical CDN architecture.
However, improvement in users’ satisfaction comes at the cost of increased energy consumption mainly originated from the surrogate servers activity. The cited works
1.4. Area of Interest, Objectives and Contributions 11
[Feldmann 2010], [Lee 2010], [Chiaraviglio 2010], [Blackburn 2009] address how the underlying network activity, in conjunction with content delivery, interacts with the energy consumption, but there is not much focus on the CDN redirection poli-cies in particular. Therefore, our key motivation lies on finding a delicate balance between users’ satisfaction and reduction in CDN infrastructure energy consump-tion. We aim at defining an energy-aware forwarding strategy that enhance previ-ous work [Stamos 2009], including energy savings, relying on utilization model of the surrogate servers. We focus on energy reduction in CDN at surrogate server level by working on CDN redirection policies. Our work doesn’t include to analyze the energy conservation at network level and is considered for future work. So, this research lies to explore, propose and to develop energy-aware mechanisms and techniques in CDN and analyzing their impact on the user experience.
1.4.1 Objectives
The objectives of our research include:
• Identifying the right CDN metric to find the energy consumption in CDN.
• Identifying and analyzing the energy consumption in a CDN.
• Modeling the energy consumption in a CDN.
• Exploring energy conservation opportunities in CDN systems.
• Identifying and implementing the techniques of energy conservation which can be applicable to implement in a CDN environment.
1.4.2 Contributions
The main advances of this research are the following:
• Deriving an energy consumption model from the surrogate servers’ utilization in a CDN.
• Proposing and developing Energy-aware CDN redirection policies by apply-ing the energy conservation techniques (Consolidation and DVFS (Dynamic Voltage Frequency Scaling)) in traditional CDN redirection policies.
• Developing a simulator to integrate energy concerns and energy conservation techniques to evaluate our proposed concepts.
• Studying the impact of CDN infrastructure size i.e. number of surrogate servers participating in a CDN, traffic size i.e. number of client requests and load intensity i.e. frequency of client requests on energy consumption and user experience, to evaluate the behavior of our proposed policies in different CDN scenarios. And then to compare these policies, to help a CDN owner to make the choice of appropriate CDN redirection policy in a particular CDN scenario (depending on the user’s and his own requirements).
• Deriving from these studies, some perspectives as potential energy saving techniques that preserve energy while respecting a certain level of quality of services.
1.5
Thesis Organization
Thesis report is organized as follows,
• In the next Chapter, literature review is presented, in which energy consump-tion models and energy conservaconsump-tion techniques, developments and mecha-nisms are discussed. Starting from the basic concepts, energy measurements and profiling techniques are discussed which describe different energy mea-surement techniques and various types of component or system level energy and power consumption models. Later on, Dynamic power management i.e. DVFS, its applications, benefits and drawbacks are discussed. After that, energy conservation methods in a pool of servers are discussed. The chap-ter is ended with a detailed review of energy reduction in content delivery mechanism.
1.5. Thesis Organization 13
• Chapter 3 presents the CDN simulation environment. A simulation test-bed CDNsim is discussed in detail. Different input/output parameters (existing and newly proposed), existing CDN redirection policies, evaluation metrics (existing and newly proposed (including their justification)) and our contribu-tions to the CDNsim are exhibited in detail. Also, it shows how the different evaluation metrics are affected by different input parameters. It ends with the presentation of data set we used to perform our simulations which are presented in the next chapters.
• In Chapter 4, CDN redirection policies (traditional and energy-aware) are proposed. CDN utilization, CDN utilization and energy consumption mod-els (with and without DVFS) are exhibited. Also, energy-aware techniques (DVFS, server consolidation) and mechanisms along with their implementa-tion in CDN are illustrated and evaluated. Moreover, CDN redirecimplementa-tion policies are evaluated presenting the impact of CDN infrastructure and traffic size on different evaluation parameters.
• Chapter 5 compares the proposed CDN redirection policies (Traditional and/or energy-aware) impact on different evaluation metrics.
• Chapter 6 states, at what extent the frequency of the client requests traffic affects the CDN operations. It compares the proposed policies based on the evaluation metrics in the previously discussed context.
Chapter 2
State of the Art
Contents
2.1 Basic Terms. . . . 16
2.2 Energy Measurement and Profiling Techniques . . . . 16
2.3 Reducing Energy Consumption in Computing Systems. . . 18
2.3.1 Dynamic Voltage Frequency Scaling (DVFS) . . . 18
2.3.2 Energy Reduction in Cluster of Servers . . . 24
2.3.3 Reducing Energy Consumption of Content Delivery . . . 29
2.4 Conclusion . . . . 35
This chapter describes some research work done in the context of our area of interest. The main purpose of this chapter is to provide the background of our work to have better understanding before presenting the more explanatory and result oriented sections. In order to be precise, we start from some basic concepts leading towards some related aspects. We have defined some basic terms used in our proposed context. We discussed the models used to calculate energy consumption on component and system level. Then we describe the techniques used for the energy reduction in computer systems. We have discussed the previous work done to explore the energy conservation in cluster of servers. At the end, before concluding the chapter, we have investigated the mechanisms used for energy conservation in content delivery architecture. We have explored the previous work linking with our work and provided necessary comparisons and discussions as well.
2.1
Basic Terms
It is important to describe some basic terminologies before proceeding towards more details.
• Energy: In computer systems, it is referred as the electricity resource that can power the hardware devices for doing computation during a certain time. Energy is measured in Joules. In research, the term energy is mostly used in the mobile and data center platforms. In case of mobile devices, energy is referred to the battery lifetime while in case of data centers, it is mostly concerned with the electricity cost.
• Power: Power is the rate at which work is done, or energy is dissipated. Power is measured in Watts. Power is used to present the current delivery and voltage regulator of the circuits. In case of system research, power can also be referred for the abstract concepts e.g. process and operating system. For example, if we state that the power of a process "A" is 1W (Watt), it means that the execution of "A" causes the hardware circuits to use 1W of power.
• Static Power: This is the power produced when the transistors are not com-pletely turned-off. It is specified as the power that is needed by a device when it is inactive.
• Dynamic Power: It is referred to the power that is needed for the working of a device. It is occurred because of switching of the capacitance voltage states.
2.2
Energy Measurement and Profiling Techniques
In this section different existing energy measurement and profiling techniques are investigated. [Benedict 2012], [Chen ] and [Trobec 2013] described the recent tech-niques to measure power consumption in large scale distributed systems. According to them, energy measurement and profiling can be majorly categorized into hard-ware and softhard-ware. According to hardhard-ware-based energy measurement approaches,
2.2. Energy Measurement and Profiling Techniques 17
different instruments can be used to measure the energy consumption, communica-tion or storage segments e.g. CPU (Central Processing Unit), racks of data centers, motherboards. These instruments can be implemented as meters, special hardware devices usually embedded in hardware platforms or as power sensors put on the hardware. However, hardware-based techniques use expensive sensors to measure the energy consumption, also a good knowledge of the hardware design is required. According to the software-based energy measurement techniques, energy models are developed to evaluate the energy consumption. These energy models are used to estimate the energy consumption at different levels i.e. hardware component, program block, process, instruction or system level etc.
[Rivoire 2008] presents a constant power model. It doesn’t take into account the resource utilization and predicts the constant power. This model provides the base for the utilization-based models. Moreover, linear CPU dependent model was also proposed [Fan 2007]. According to them, power consumption is predicted ac-cording to the utilization of the CPU of a node. Some works like [Heath 2005] uses the linear model to measure the CPU and disk energy consumption according to their usage. Number of disk transfers is used as the parameter by the disk trans-fer models to estimate the dynamic energy consumption of the disk. Moreover, [Vereecken 2010] proposed CPU, hard disk and network interface card utilization model where utilization of the different components is mapped to the energy con-sumption. [Economou 2006] presents the performance counter model where the energy consumption of a system is measured according to the system’s performance counters such as utilization of floating point unit, amount of instruction level par-allelism or the activity of the cache hierarchy. Additionally some models were proposed to estimate the energy consumption of different architecture styles i.e. peer-to-peer, client/server, publisher/subscriber [Seo 2009].
Load models concentrate on the running hosts only and are sufficient to predict the energy consumption for the servers which are active 24/7[Berl 2011]. Load models take into account the utilization of the servers. After turning the servers on, their active energy consumption is function of their load. We adopted this form of model which fits our case.
2.3
Reducing Energy Consumption in Computing
Sys-tems
Energy conservation has a key importance in computing systems because lower power results in lower operating costs, lower fan noise and lower cooling needs. Increase in energy consumption in large-scale distributed systems (e.g. clusters, CDNs (Content Distribution Networks), grids and clouds) raises economical and environmental issues. Proposing and designing new energy-efficient techniques and methods at all levels of distributed architectures, to minimize energy consump-tion is an issue of high importance [Shuja 2012] [Beloglazov 2011] [Da Costa 2009] [Chang 2003] [Contreras 2005]. Energy can be decreased at different levels of dis-tributed system architecture e.g. on hardware level, at the network level, at the middle-ware level or at the application level etc. [Shuja 2012] [Beloglazov 2011] [Da Costa 2009] [Chang 2003] [Contreras 2005] [Orgerie 2013]. Moreover, energy consumption of computing systems can be defined as the summation of static and dynamic energy consumption. In order to reduce energy consumption of a device, a system or a system of systems: It is necessary to reduce its static, dynamic or static and dynamic energy consumption. By keeping in view previously discussed concepts and to be precise, in this section we have presented related existing work describing energy reduction techniques used at device (particularly CPU), cluster of servers and content distribution level to reduce static, dynamic or static and dynamic energy consumption.
2.3.1 Dynamic Voltage Frequency Scaling (DVFS)
In order to get the higher system performance, we need to increase the operat-ing frequency, or usoperat-ing the powerful ICs (Integrated Circuits). When voltage of a CPU is minimized, its power consumption is substantially reduced. Performance is affected by this process. Frequency of a CPU is changed approximately propor-tionally according to the change in its voltage (f ∝V ). Hence, P ∝V2f , where P
denotes power consumption of a CPU. When power is divided by frequency, we get energy per cycle. Energy is proportional to square of frequency E∝f2. So a CPU
2.3. Reducing Energy Consumption in Computing Systems 19
can consume less energy when running on lower speed [Lorch 2001].
Hence, increase in performance level inevitably causes the increase in energy consumption. We can have the energy savings at system level by using the low static power consumption devices or by controlling the system operation according to the processing load.
One of the popular energy reduction techniques is known as DVFS (Dynamic Voltage Frequency Scaling), also called dynamic speed scaling or dynamic power scaling. The voltage supply to the different components like CPU, main memo-ries, local buses etc is controllable. The power consumption of a processor depends on the supply voltage and frequency. Power-aware mechanisms try to reduce en-ergy consumption according to the appropriate moments and enhances the enen-ergy savings keeping in view the system performance. Energy saving algorithms are pro-posed for dynamically varying processor clock speed or reducing the supply voltage and hence saving energy as described in [Venkatachalam 2005a], [Flautner 2002], [Venkatachalam 2005b], [Flinn 2000], [Govil 1995], [Grunwald 2000], [Lorch 2001], [Mochocki 2006], [Pettis 2004] and [Pouwelse 2001].
2.3.1.1 Preliminary Work.
DVFS is applicable in different scenarios, one of them is the moment when the processor has a lower utilization. Weizer et al. [Weiser 1994] proposed one of the early approach based on general purpose operating systems. They consider a collection of interval based algorithms i.e. OPT, FUTURE and PAST. They evaluated these algorithms by the help of traces which were collected from the systems which lie on the Unix operating system. On these systems, engineering applications were running. According to their approach, time was divided into intervals. These intervals had fix length. For each interval they notice the frequency of the clock. At the start of each interval, the frequency and the voltage of the CPU has been considered. The purpose was to complete majority of the work at the end of the intervals. Their approach considers the CPU utilization ratio to determine the status of CPU under-utilization. When the CPU is underutilized, it requires lower frequency. Among their proposed algorithms, PAST doesn’t require the future
knowledge to work. But it remained unimplementable because of its requirements of information about the work done in the previous time intervals, hence the work of Weizer et al. has some inconveniences which made it hard to implement on general purpose systems.
In 1995 Yao et al. [Yao 1995] presented a job scheduling DVFS approach for real time systems. They proposed some off-line and on-line algorithms. They considered the single processor with variable speed to conserve energy, where every tasks are accomplished during the start and the end time with the changing speed of the processor.
2.3.1.2 Advanced Work.
The complexity in work of Weizer et al. was tried to be removed later-on by [Pering 1998] and [Grunwald 2000] by modifying the original algorithms.
These basic works motivated the researchers to progress the research in this direction. Now-a-days, most of the existing processors support DVFS e.g. AMD (Advanced Micro Devices) Athlon and Mobile K6 Plus, Intel Xeon, Pentium-III with SpeedStep technology [Intel Corporation 2000] and Strongarm SA-2 [HEEB 2000].
• Operating System level Frequency Scaling: With the advancements in DVFS supporting technology, some standards are also introduced e.g. ACPI (Advanced Configuration and Power Interface) [Hewlett-Packard 1999] re-leased in 1999. The purpose was to introduce the energy-awareness at oper-ating system level. The approach of ACPI is to determine CPU performance states. A CPU can have different performance states according to ACPI. When a CPU is working, it is considered to be working in one of these de-termined performance states. These performance states are co-related with the power states. ACPI existence created the opportunity for DVFS oriented algorithms to be compatible with different types of CPU.
• Load level Frequency Scaling: According to [Don Domingo 2010], the fre-quency and the voltage of a processor can be varied according to its load. Linux kernal provide five different modes of DVFS. These modes are
per-2.3. Reducing Energy Consumption in Computing Systems 21
formance, powersave, ondemand, userspace and conservative. According to performance mode, the frequency of a processor works at the highest rates, set by the governor. In this mode, the processor frequency will not be changed. Though this mode is useful when there are higher loads or the systems are uti-lized throughout the time. This mode doesn’t offer power saving but provides the higher performance. Powersave governor offers the opposite functionality to the performance one. According to this mode, the processor frequency is set to the minimum possible value. Though this mode provides higher power savings but at the cost of lower CPU performance. It also resolves the overheating problem. But this mode is not useful during the period of higher loads where the energy consumption can be higher. So it is better to set this mode in the conditions where the lower load periods are going to happen. Ondemand mode provides the frequency switching function to the processor. During higher loads, frequency of the processor is kept maximum and is switched to minimum when the system has no load. It can offer dif-ferent possibilities to manage the difdif-ferent problems of the system like power consumption, heating emissions and performance etc by switching the clock frequency according to the lower and higher loads. Userspace governor pro-vides the facility to the user-oriented programs to set the frequency according to their needs. Depending on its better use, this mode can manage the things in a better way to handle the energy concerns. Conservative mode is less ag-gressive than the ondemand mode and changes the clock frequency according to the load gradually. Some of these techniques were presented by Guer-out et al in [Guerout 2013] keeping in view the grid and cloud environment simulation using CloudSim simulator.
• Frequency Scaling in Other Components: Dynamic Speed Scaling (DSS) is also done in different components e.g. multi-speed disks [Pinheiro 2004], [Gurumurthi 2003] and [Carrera 2003], memory power management via DVFS [David 2011]. Similarly at network level, the idea of adapting rate according to the load is applied for energy conversation. The idea of reducing power
consumption in wired network links and network devices was first studied in [Gupta 2003]and [Christensen 2004]. For example Adaptive Link Rate (ALR) addresses the concept of changing the link rate dynamically and adapting it to the utilization of network. This technology allows Ethernet data link to adjust its speed and ultimately power to traffic levels [Gunaratne 2005], [Anand 2006], [Gunaratne 2006].
2.3.1.3 DVFS Limitations.
Energy reduction techniques try to reduce energy but it doesn’t mean that there will always be reduction in the energy consumption by applying the energy saving techniques. An execution of a task on reduced speed doesn’t always result in reduced energy consumption [Shekar 2010]. Similarly reduced power doesn’t necessarily cause reduced energy consumption. The fact is that energy consumption doesn’t depend only on the power. Energy consumption includes the execution time also. So, working on the lower power for a long time can result into the higher energy consumption. Similarly, working on the higher power for a smaller time can result into the lower energy consumption. But, execution time of the task may not be inversely proportional to the clock frequency and DVFS may result in non-linearity in the execution time [Buttazzo 2002] e.g if the task is memory or I/O bounded then speed of the processor will not have a dramatic effect on the time of execution. Also, reducing the processor speed may lead to the changes in the order of scheduled tasks [Venkatachalam 2005a].
There is also an other impact of processor frequency change on the performance of processor. According to [Zhu 2004], the use of DVFS degrades the reliability of the processor. In short, we can gain substantial energy savings by using DVFS technique but it is important to apply it carefully, as the results may change for different system architectures and applications loads.
2.3.1.4 Discussion.
We opt for the concept of changing the rate of devices according to the load. In our work, we target the processor as a device to apply the DVFS. As we are concerned
2.3. Reducing Energy Consumption in Computing Systems 23
with the CDN, so we take the surrogate server processor and apply the DVFS technique according to load of surrogate server which is directly proportional to the number of simultaneous connections. The previously discussed techniques focus on the energy reduction by DVFS in processors generally while we focus on the surrogate servers in a CDN in particular. We approach the problem with the CDN simulation.
Up to our knowledge, there is no work that addresses the DVFS technique in a CDN simulation environment. Moreover, some works are similar to our approach with considerable differences for example [Don Domingo 2010] that presented the different DVFS techniques in Linux Kernel. Their work is more practical in PCs (Personal Computers), for example they presented a userspace technique where the user oriented programs settle the frequency of the processor according to their needs. In CDN, the surrogate servers are not controlled by the users and users can just access the contents from the servers. However some of their approaches can also be practical for the server systems e.g. powersave, ondemand modes.
According to the previously discussed approaches, DVFS modes can be divided into two major categories i.e. static and dynamic. Static modes can be presented as the modes where the processor frequency works on the same scale and doesn’t change whether other factors (e.g. load) are static or dynamic. Dynamic mode can be said as the mode where the processor frequency changes according to a factor (e.g. load). Dynamic mode changes can be mapped to the thresholds as well. In previous works, while considering the static mode of the DVFS, mostly two extreme modes are considered i.e. the mode where the processor works at maximum frequency and the mode where the processor works always on the minimum possible frequency e.g. performance and powersave modes in [Don Domingo 2010]. It can be an interesting idea to be moderate between these two extreme modes and analyzing its impact on the power-saving. That motivated us to propose a DVFS mode where the frequency of the processor always work on medium scale.
One of the interesting DVFS approach is presented in [Don Domingo 2010] i.e. ondemand approach: where the processor frequency works on minimum scale when the system is idle or at maximum when system has some load. No doubt, this
ap-proach minimizes the static energy consumption but it doesn’t give the opportuni-ties to conserve dynamic energy consumption because it doesn’t consider frequency changes when system has different loads. In contrast to this approach, we proposed the technique of frequency adaptation according to thresholds of the system load that makes our work more practical and useful to enhance the static as well as dynamic energy saving. Additionally, we focus not only on the DVFS to reduce the energy consumption but also we present how the DVFS affects the user experience that makes our approach more practical for a CDN environment where the user experience is an important factor.
2.3.2 Energy Reduction in Cluster of Servers
Researchers are doing work on minimizing the energy consumption in clusters of database and web servers. The purpose is to minimize the power consumption and analyzing its impact on user experience. Ultimate goal is to find different ways for the services, which are acceptable for both customers and the service providers in terms of energy cost and quality of service. Energy consumption in such type of systems, mostly depends on the utilization of CPU along with the part of power consumption of memory, network devices, hard-disks etc. A server without any load can still consume 60% of its peak power [Chase 2001]. So, in order to have maximum possible energy reduction in such systems, it is important to power-off or down the servers as a function of their utilization. Different works have been proposed to attain this goal.
Chase et al. [Chase 2001] proposed energy-aware mechanisms. According to their policies, in a large cluster of servers, resources are allocated on the base of economic criteria by keeping in view the energy consumption and user experience. Resource allocation is managed by a request dispatcher which focuses on the min-imum number of active servers for incoming requests. The rest of the servers are kept in a low power idle mode.
Sharma et al. [Sharma 2003] exhibited feedback control mechanism to control application level service demands. They proposed adaptive algorithms for Dynamic Voltage Scaling (DVS) in QoS-enabled web servers by keeping in view the service
de-2.3. Reducing Energy Consumption in Computing Systems 25
lay problem while minimizing energy consumption. Dovrolis et al. [Dovrolis 1999] proposed a feedback controller to handle the response time in cluster of servers. Sharma et al. [Sharma 2005] proposed a mechanism for thermal load-balancing using load monitoring and dynamic workload provisioning. [Nedevschi 2008] com-pares the utilization of hot data centers that should be cooled with cool peers.
Chen et al. [Chen 2008] discussed related dynamic provisioning problem. They concentrated on long-lived TCP (Transmission Control Protocol) connections e.g. in case of Skype, MS (Microsoft) Messenger, online gaming etc. They proposed techniques which include dynamic provisioning and load dispatching. Their tech-nique proposes to turn on minimum number of servers which can be enough to satisfy the user requests while keeping in view the user experience. They proposed a CPU load-oriented power model. They also proposed a model to measure the performance according to the number of connections and log in rate. Moreover, they used a model for the prediction of the load. They use all these models to develop the provisioning techniques. [Urgaonkar 2008] proposed a dynamic provi-sioning algorithm. They focus on a platform which can host many applications. They use a queuing model for analyzing the system. The provisioning algorithm exhibits a predictive strategy and analytics model which focuses on the minimum set of servers. They also take into account the user experience. Their technique predicts the future load based on the long time intervals. In order to avoid the complexities in their technique which can be caused by the sudden load variations, they also used a reactive provisioning at short time intervals.
Goiri et al. [Goiri 2010] [Comellas 2010] presented that reduction in the online systems decreases the energy consumption and they tried to find the compromise between power savings and online machines. According to them, they used two thresholds i.e. minimum working nodes threshold and maximum working nodes threshold. Minimum working nodes threshold determines when the service owner can power-off the nodes. Maximum working nodes threshold determines when the service provider should power-on the new nodes. By evaluating the energy con-sumption and the user experience, different analysis can be obtained.
pro-poses an intelligent consolidation framework by applying different techniques e.g. turning on/off nodes, power-aware consolidation policies and machine learning tech-niques in order to optimize the previous technique. [Kamitsos 2010] also exhibited the turning on/off technique and proposed to put the idle machines in a low power consuming mode to gain energy reduction. In order to get this functionality, they used Bellman’s function to consider when to set the unnecessary machines into sleeping mode while managing rest of the jobs in the active machines.
[Lu 2013] tried to explore the energy saving by proposing the decentralized online dynamic provisioning algorithms. They did dynamic provisioning with and without future knowledge about the workload and found that full size window future workload knowledge will not enhance the performance of dynamic provisioning. They suggested that without or with partial future workload information, there is possibility to reduce the energy consumption in cluster of servers.
[Pinheiro 2001] proposed power-aware algorithm at application and operating system level. Their proposed algorithm is able to do balancing and load-unbalancing at cluster level. They used energy-aware technique of powering-off servers during lower loads and keeping them on while higher loads. They focus on clusters of the PCs or workstations in the context of clusters of web server and compute server. According to their method, the nodes of clusters are turned-on and turned-off dynamically. They use the load-balancing technique to use idle servers while the load-unbalancing technique was used to concentrate on some nodes and making the other nodes idle to consider them for powering-off. Their approach is closer to our work in the sense that we both consider the load balancing to use the idle servers and load-unbalancing to have the under-utilization in servers to consider them for turning-off. They exhibit the power and performance trade-off. For the performance they took throughput and execution time as the metrics. But the major difference in our work is that we emphasized on CDN servers. Simi-larly, we use DVFS but they didn’t consider this important technique to have the maximum energy savings even doing load-balancing. Though they focused on the systems performance vs energy gains but we consider the user experience which is very important in CDN case. Their work was then extended by Elnozahy et al.
2.3. Reducing Energy Consumption in Computing Systems 27
[Elnozahy 2003] who proposed the global (cluster level) and individual (server level) energy conservation policies. They proposed five different algorithms to manage the power reduction in cluster of servers. These five algorithms are the combination of two popular energy reduction techniques 1) Dynamically power-on and power-off servers 2) Dynamically changing the voltage of processor. They are the one who first time combine these two energy reduction techniques in cluster of servers. Their policies are: Individual voltage scaling (IVS), coordinated voltage scaling (CVS), vary-on vary-off (VOVO), combination of IVS and VOVO, and fifth algorithm com-bination of VOVO and CVS. The first policy IVS, uses the concept of frequency and voltage changes according to the workload of a cluster node. CVS policy also does the frequency scaling like IVS but CVS does this operation in a coordinated way. According to CVS, the nodes coordinate for voltage scaling and work close to average frequency setting in the cluster. According to them, for this purpose a monitor can be used that computes the frequency setting of all the nodes in a cluster and then broadcasts it to restrict all the nodes to work closer to that aver-age frequency for a given interval of time. Though according to the author, CVS is supposed to do better in energy savings but it is more complex to implement. VOVO policy is actually the same policy as investigated by [Pinheiro 2001] where the nodes of the clusters are powered-on and powered-off dynamically to reduce the energy consumption of system. VOVO-IVS combines the functionality of IVS and VOVOS to gain maximum energy saving by taking into account the local and global measures. VOVO-CVS algorithm is combination of VOVO and CVS policies for energy gains but it is considered the most complicated policy to implement. Their work is similar to our work and we use both powering-off servers and DVFS techniques and their combinations. Along with these similarities, there are con-siderable differences. Our focus is on the energy reduction in CDN environment particularly in the CDN servers or surrogate servers. We use the load-balancing and load-unbalancing using Zipfian distribution. We applied DVFS technique while balancing the load among CDN servers and combined it with powering-off servers while doing load-unbalancing. Their global DVFS technique i.e. CVS is more com-plicated to implement and also increase the overhead of installing load monitor.
CVS computes the average load of all the nodes and then restrict them to work on corresponding frequency. As a result of that it also affects performance and causes delay process while computing the load. In comparison, our global DVFS technique doesn’t require all this overhead and complications and is very practical because of its simplicity. In our global DVFS approach, for a CP (Content Provider), there is only a single requirement to determine the different load periods and then ac-cording to the algorithm, all the nodes work on the appropriate frequencies i.e. Highest, medium or lowest. It also prevent the burden of frequent fluctuations of the processor frequencies as well. Moreover, our two local adapting DVFS policies provide the opportunity to save the energy on the individual server level by using three thresholds which helps to decide to change the processor frequency according to the server load.
2.3.2.1 Discussion
In previous works, two of the main approaches or their combination is adopted to achieve energy minimization in cluster of servers i.e. Global (sleeping/turning-off servers) and local or server level (DVFS). Most of the previous techniques target the different types of cluster of servers while our emphasis is particularly on the CDN. Though some of these works also discuss the trade-offs between energy saving and some aspects of quality of experience but mainly it concentrates on the energy reduction and system performance. We analyze the energy saving and its affects on the user experience and performance of the CDN. Our work combines the different approaches of the several previously discussed works and adds the new techniques to reduce the energy consumption in distributed systems. Some of the approaches prefer to keep some of the servers idle while lower load periods but to have the maximum savings, we determine to turn-off the servers as the servers in idle mode also consumes a considerable amount of energy. We also consider to minimize the cooling cost by adjusting a threshold of the servers by avoiding them to be fully loaded to overcome the problem of over heating which also increases the cooling cost.
2.3. Reducing Energy Consumption in Computing Systems 29
2.3.3 Reducing Energy Consumption of Content Delivery
Different content delivery architectures are proposed and studied by researchers. Reducing energy consumption of content delivery has become an area of high im-portance because of its explosive increase. Also, trade-offs among content delivery architectures were analyzed inside several works.
2.3.3.1 Content Centric Networking(CCN).
Jacobson et al. [Jacobson 2009] [Jacobson 2012] proposed a new architecture, Con-tent Centric Networking (CCN), also called as named data networking, conCon-tent- content-based networking or data-oriented networking. According to them "Accessing con-tent and services requires mapping from the what that users care about to the network’s where." Its main objective is that a communication network must permit an end user to concentrate on the required data rather than giving a reference from where that data is to be accessed. The purpose is to change the current network-ing communication model by replacnetwork-ing the machines with the content as shown in Figure 2.1.
Figure 2.1: CCN network communication model [Jacobson 2012].
In [Lee 2010], a network architecture problem is investigated. Authors pro-posed an architecture based on CCN to reduce the power consumption. They tried