HAL Id: hal-02058307
https://hal.inria.fr/hal-02058307
Submitted on 5 Mar 2019
HAL is a multi-disciplinary open access
archive for the deposit and dissemination of
sci-entific research documents, whether they are
pub-lished or not. The documents may come from
teaching and research institutions in France or
abroad, or from public or private research centers.
L’archive ouverte pluridisciplinaire HAL, est
destinée au dépôt et à la diffusion de documents
scientifiques de niveau recherche, publiés ou non,
émanant des établissements d’enseignement et de
recherche français ou étrangers, des laboratoires
publics ou privés.
Service traceroute: Tracing Paths of Application Flows
Ivan Morandi, Francesco Bronzino, Renata Teixeira, Srikanth Sundaresan
To cite this version:
Ivan Morandi, Francesco Bronzino, Renata Teixeira, Srikanth Sundaresan. Service traceroute: Tracing
Paths of Application Flows. PAM 2019 - Passive and Active Measurement Conference, Mar 2019,
Puerto Varas, Chile. �hal-02058307�
Flows
Ivan Morandi1, Francesco Bronzino1, Renata Teixeira1, and Srikanth
Sundaresan2
1
Inria, Paris [email protected]
2
Princeton University [email protected]
Abstract. Traceroute is often used to help diagnose when users experi-ence issues with Internet applications or services. Unfortunately, probes issued by classic traceroute tools differ from application traffic and hence can be treated differently by routers that perform load balancing and middleboxes within the network. This paper proposes a new tracer-oute tool, called Service tracertracer-oute. Service tracertracer-oute leverages the idea from paratrace, which passively listens to application traffic to then is-sue traceroute probes that pretend to be part of the application flow. We extend this idea to work for modern Internet services with support for identifying the flows to probe automatically, for tracing of multiple concurrent flows, and for UDP flows. We implement command-line and library versions of Service traceroute, which we release as open source. This paper also presents an evaluation of Service traceroute when tracing paths traversed by Web downloads from the top-1000 Alexa websites and by video sessions from Twitch and Youtube. Our evaluation shows that Service traceroute has no negative effect on application flows. Our com-parison with Paris traceroute shows that a typical traceroute tool that launches a new flow to the same destination discovers different paths than when embedding probes in the application flow in a significant fraction of experiments (from 40% to 50% of our experiments in PlanetLab Europe).
1
Introduction
Internet services and applications rely on highly distributed infrastructures to deliver content. When applications stop working or when their performance de-grades, service providers and more sophisticated users often resort to traceroute to narrow down the likely location of the problem. Traceroute issues probes with increasing TTL to force routers along the path towards a destination to issue an ICMP TTL exceeded message back to the source, which iteratively reveals the IP addresses of routers in the path [4].
Traceroute, however, may fail to reveal the exact path that a given appli-cation flow traverses. For example, Luckie et al. [8] have shown that depending on the traceroute probing method (ICMP, UDP, and TCP) the set of reached destinations and discovered links differ. The authors explain these differences by the presence of middleboxes in the path such as load balancers and firewalls that
make forwarding decisions based on flow characteristics. These results imply that diagnosing issues on application flows must ensure that traceroute probes have the same characteristics as the application’s packets.
This paper develops a traceroute tool, called Service traceroute, to allow dis-covering the paths of individual application flows. Service traceroute passively listens to application traffic to then issue probes that pretend to be part of the application flow. Some traceroute tools (for instance, paratrace [6], TCP side-car [13], and 0trace [5]) already enable probes to piggyback on TCP connections. These tools observe an active TCP connection to then insert traceroute probes that resemble retransmitted packets. TCP sidecar was developed for topology mapping, whereas paratrace and 0trace for tracing past a firewall. As such, they lack the support for tracing paths of modern application sessions, which fetch content over multiple flows that change dynamically over time. First, these tools provide no means to identify the set of application flows to trace. They require as input the destination IP address and the destination port to detect the target application flow. Second, they trace one target application flow at a time. Finally, these tools lack the support for tracing application flows using UDP as transport protocol, which are increasing thanks to the adoption of QUIC protocol [7].
Our work makes the following contributions. First, we develop and imple-ment Service traceroute (§2), which we release as open source software. Service traceroute is capable of identifying application flows to probe and of tracing the paths of multiple concurrent flows of both TCP and UDP flows. For example, a user may simply specify trace ‘Youtube’ and Service traceroute will identify Youtube flows and then trace all of their paths. Service traceroute is configurable to cover a large variety of Internet services.
Our second contribution is to conduct the first thorough evaluation of the ef-fect of embedding tracetoute probes within application flows. One issue with this approach is that we may hurt application performance. Our evaluation shows that in the vast majority of cases, Service traceroute has no side-effect on the tar-get application (§4). Finally, we compare Service traceroute with 0Trace, which also embeds probes within a target application flow, and with Paris Traceroute, which launches a new flow for probing (§5). Our comparison with Paris tracer-oute shows that when we launch a new flow with tracertracer-oute probes we observe a different path in around 40% to 50% of paths depending on the application. This difference reduces considerably for the majority of applications when we run Paris traceroute with the same flow ID as the target application flow, which shows that differences are mostly due to middleboxes that make forwarding de-cisions per flow. These results highlight the need for Service traceroute, which automatically identifies the flow IDs of the target application to create probes.
2
Tool Design and Implementation
Service traceroute follows the same high-level logic as paratrace or 0trace. Given a target application flow, which we define as the application flow whose path we aim to trace, Service traceroute proceeds with two main phases. The first
phase is the passive observation of a target application flow to define the content of the probes. Then, the second phase involves active injection of TTL-limited probes within the application flow. The main difference is that Service traceroute identifies the flows to trace automatically and supports tracing paths traversed by multiple application flows concurrently. The user can either directly specify the set of target application flows or simply describe a high-level service (e.g., Youtube). Service traceroute will then trace paths traversed by all the flows related to the target service. This section first describes the two phases focus-ing on the new aspects of Service traceroute to allow per service tracfocus-ing and then presents our implementation. Library and command-line versions of Ser-vice traceroute, together with the scripts to perform data analysis are available as open source projects [1].
2.1 Observation of target application flow
Service traceroute passively observes traffic traversing a network interface to
search for packets with the flow-id of the target application flows.3Service
tracer-oute takes a set of target application flows as input, in contrast with previous tools which can only trace the path traversed by one single application flow. Users can either explicitly specify one or more target application flows or they can simply specify a service. Service traceroute uses a database of signatures of known services to inspect DNS packets in real-time and identify flows that match the target service. We release the DB as open source, so users can contribute to add or update the signatures in the database [1]. We define as signature the set of domains and IP addresses corresponding to a specific service. For instance, ‘google.com’ or the corresponding IP addresses can be used in the signature to detect Google services. Our current database has signatures for popular video streaming services such as Netflix, Youtube, and Twitch. We identify web flows simply from the domain or the host name given as input. For additional flexibil-ity, it is possible to add domains and IP addresses via command line parameters or through the library API.
2.2 Path tracing
Only once it identifies a packet belonging to the target application flow, Service traceroute will start the tracing phase. This phase works as classic traceroute implementations sending probes with increasing TTL, but Service traceroute creates a probe that takes the form of an empty TCP acknowledgement that copies the 5-tuple of the flow as well as its sequence number and acknowledge-ment number (similar to paratrace and 0trace). We rely on the flow-id plus the IPID field to match issued probes with the corresponding ICMP responses. We note that this is sufficient to correctly identify probes even when tracing multiple concurrent target application flows. The maximum number of concurrent target
3
We use the traditional 5-tuple definition of a flow (protocol, source and destination IP, as well as source and destination port).
application flows varies based on the used configuration as the IPID field is dy-namically sliced based on the number of probes that have to be generated. For example, with traceroute standard parameters, i.e. maximum distance of 32 and 3 packets per hop, Service traceroute can trace paths of more than 600 target application flows in parallel.
Service traceroute stops tracing when the target application flow closes to avoid any issues with middleboxes (which may interpret probes after the end of the connection as an attack) and also to reduce any network and server overhead. In contrast to prior tools that only support TCP, we add support for UDP. In this case, we create probes with empty UDP payload, but with the same 5-tuple flow-id as the target application flow. Given UDP has no explicit signal of the end of the flow (like the FIN in TCP), we stop tracing if the flow produces no further packets (either received or sent) after a configurable time interval.
2.3 Implementation
We implement Service traceroute in Go and release command-line and library versions. The command-line version is useful for ad-hoc diagnosis, whereas the library allows easy integration within monitoring systems. The library version of Service traceroute outputs a json data structure that contains the discovered interfaces with the observed round-trip-time values. For the command line ver-sion, Service traceroute shows the results of each trace in the traceroute format, i.e., the list of hops with the corresponding round-trip times.
Service traceroute is configurable to adapt to different applications. It in-cludes three types of probing algorithms that capture the tradeoff between trac-ing speed and network overhead. PacketByPacket sends only one probe at a time. HopByHop sends a configurable number of probes with the same TTL at a time (3 by default). Concurrent sends all probes to all hops at once. Given that Service traceroute requires the target application flow to be active dur-ing tracdur-ing, some applications with short flows (e.g., Web) require the higher overhead of Concurrent to complete all the probes within the flow duration. Ser-vice traceroute also allows configuring the number of probes for each TTL, the inter-probe time, and inter-iteration time (i.e., the time between packets with different TTL) to further control the tradeoff between tracing speed and over-head. Finally, Service traceroute allows to specify three types of stop conditions: the maximum distance from the source, the maximum number of non-replying hops, like Paris Traceroute, or explicit stop points in the form of IP addresses. The stop condition is particularly important for Service traceroute because the destination host will never respond with an ICMP error message as probes are part of the target application flow.
Following extensive calibration tests (reported in Section 3), we set Service traceroute to use as default the Concurrent mode, together with a maximum distance of 32 and 3 probes per hop.
3
Evaluation Method
We design our evaluation around two questions. First, does Service traceroute affect the target application flows? Service traceroute injects new packets within the application flow. Although the majority of these packets will be discarded before they reach the servers, a few probe packets will reach the end-host and can potentially affect the target application flows. Second, do paths discovered with Service traceroute differ from those discovered by other traceroute methods? One assumption of our work is that paths taken by classic traceroute probes may not follow the same paths as the packets of the target application flows. We present a preliminary evaluation to help answer these questions, where we use Service traceroute to trace paths of target application flows corresponding to the two most popular Internet services: Web and video. We compare our results with that of Paris traceroute [2] and 0Trace [5].
Web. We select the top-1000 Alexa webpages on April 14 2018 as target web flows.
Video. We focus on two popular video streaming services: Twitch and YouTube. We select Twitch videos on their homepage where Twitch shows dynamically a popular live streaming video. While for YouTube, we select 20 random videos from the catalogue obtained after arbitrarily searching with the keyword “4K UHD”. With YouTube, we evaluate both TCP and QUIC.
Calibration. We run extensive experiments to calibrate Service traceroute for these two applications varying the probing algorithm and the number of probes per hops [9]. Our results (not shown for conciseness) indicate that the best settings to maximize the fraction of completed traceroutes while minimizing the probing overhead is different for video and Web. For video, we use the HopByHop probing algorithm with a timeout of 2 seconds to wait for ICMP replies, whereas for web we use the Concurrent probing algorithm. For both, we set the maximum distance to 32 and the number of probes per hop to 3.
Comparison with Paris traceroute. We select Paris traceroute because its Multipath Detection Algorithm (MDA) [16] can discover with high probability all paths between the source and the destination in case there is a load balancer in the path. This allows us to disambiguate whether the differences we may encounter between Paris traceroute and Service traceroute are because of load balancing or some other type of differential treatment. We evaluate four versions of Paris traceroute with MDA enabled using the three protocols ICMP, UDP, and TCP as well as Paris traceroute to trace a single path with the same 5-tuple as the target application flow.
Comparison with 0Trace. We select 0Trace as it implements the idea of embedding probes in a target application flow and it has a working
implementa-tion.40Trace, however, requires as input the flow to probe, which is hard to know
4
To make 0Trace work on PlanetLab nodes, we had to replace the library to issue probes from dnet to scapy.
in advance. We used Service traceroute’s DNS resolution to detect the flow to probe and then launch 0Trace. Unfortunately, the download time for web pages is extremely short and our script was too slow to detect the target application flows and then run 0Trace. Hence, for this comparison we focus only on Twitch and Youtube. This experience illustrates the challenge of running 0Trace in prac-tice and highlights the importance of integrating flow identification in Service traceroute.
Experiment setup. We run our tests during 30 days in July 2018 from 27
PlanetLab nodes in Europe.5 Experiments for video and Web are similar. We
first launch Service traceroute, then we start streaming a video or downloading a webpage, once that is done we run the four versions of Paris traceroute and 0Trace back-to-back. Then, we stream again the same video or download the same webpage without Service traceroute. We have run a total of 459 videos, 153 for Twitch and 306 equally split between YouTube with TCP and with QUIC, and 1000 Web experiments. All datasets collected in our experiments are available [1].
Data representativeness. Webpages in the Alexa top-1000 list are often hosted on CDNs [12]. This choice guarantees that we cover the large majority of loca-tions hosting web content (i.e., all major CDN providers), but we may fail to capture the behavior of smaller webpages. Another bias comes from our choice of PlanetLab nodes as it is well known that they are mostly connected via aca-demic networks [3, 14] and hence may fail to capture the behavior of commercial ISPs. Even with these limitations, our European-scale evaluation is useful to determine whether or not Service traceroute affects the application flows of pop-ular services (top-1000 Alexa as well as Twitch/Youtube). It is also useful to shed some light on whether there are differences between paths discovered with Service traceroute and more traditional traceroute paths. The generalization of these results to vantage points located in other areas of the Internet and to other services would require larger scale experiments.
4
Side Effects of Service traceroute
This section evaluates whether Service traceroute affects target application flows. Firewalls or servers may mistakenly interpret too many duplicated packets within a flow as an attack or losses, which in turn may cause application flows to be blocked or achieve lower throughput. Although the idea of piggybacking tracer-oute probes within application flows has been around for approximately a decade, there has been no prior evaluation of whether it can hurt target application flows. TCP sidecar evaluates the intrusiveness of their method, but only by measuring the number of abuse reports [13].
5 Service traceroute failed to run on PlanetLab US nodes due to compatibility issues.
PlanetLab US nodes use an old Linux distribution (Fedora 2), which lacks many required tools and libraries necessary to run our program.
4.1 Metrics
We select different metrics to measure properties of target application flows. Flow duration refers to the time between the first and the last packet of a flow. For TCP, we measure the time from the server SYN to the first FIN or RST. For UDP, we measure the time from the first and the last packet coming from the server. We compute the average throughput of a target application flow as the total application bytes divided by the flow duration. In addition to these metrics, which we can compute for both TCP and UDP flows, we have three other TCP specific metrics: the number of resets, which capture the number of target application flows closed by resets; window size is the difference between the minimum and the maximum TCP window size of the server for an application flow; and the number of retransmissions is the number of retransmission from the server per application flow.
4.2 Aborted flows
We first study whether Service traceroute causes flows to be aborted. We have seen no video sessions that ended with resets in our experiments. Even though our analysis is only from PlanetLab vantage points in Europe, we believe that this result will hold more generally for both Twitch and Youtube as these type of large video providers deploy multiple versions of the same software across servers/caches [10, 17]. Any differences will depend on middleboxes placed either close to the clients or in the path towards the service. Our results for webpage downloads are also encouraging, we see no aborted flows. In some preliminary experiments we observe resets for three of the top-1000 websites only with Service traceroute. Our manual analysis suggests that either some firewall close to the website or the web server itself is resetting the flows due to the duplicate packets.
4.3 Flow performance
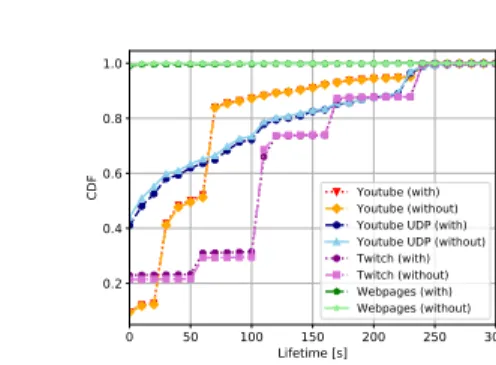
We next evaluate whether Service traceroute affects flow performance. Figure 1 presents the cumulative distribution function of the flow duration in seconds with and without Service traceroute. We present eight curves: two for video sessions over TCP both for Twitch and Youtube, two for Youtube sessions over UDP, and two for all web page downloads. We see that the distributions with and without Service traceroute are mostly the same. Similarly, our analysis (omitted due to space constraints) shows that the distributions of average throughput, TCP window size, and retransmissions are similar with and without Service traceroute. We conclude that Service traceroute has no effect on the performance of target application flows.
5
Comparison with traceroute tools
The key motivation for building Service traceroute is that we must send probes within the target application flow to discover its path. Although Luckie et al. [8]
0 50 100 150 200 250 300 Lifetime [s] 0.2 0.4 0.6 0.8 1.0 CDF Youtube (with) Youtube (without) Youtube UDP (with) Youtube UDP (without) Twitch (with) Twitch (without) Webpages (with) Webpages (without)
Fig. 1. Flow duration of target application flows with and without Service traceroute have observed different paths depending on the traceroute method (UDP, ICMP, or TCP), no prior work has studied how often piggybacking traceroute probes within application flows will discover different paths. This section compares Ser-vice traceroute with different traceroute probing methods using Paris traceroute, which discover all paths between a source and destination in the presence of load balancing, and 0Trace, which also piggybacks probes inside an application flow.
5.1 Metrics
We select two metrics to compare the discovered paths. The path length captures the distance from the source to the last hop that replies to probes. For Paris traceroute, we take the length of the longest path in case of multiple paths. The path edit distance captures the edit distance between the path discovered with Service traceroute and that discovered with another traceroute (0Trace or Paris traceroute). The edit distance is the minimum number of operations (insertion, deletion, and substitution) needed to transform one string (in our case, one path) into the other. In case Paris traceroute returns multiple paths, we select the one with the smallest edit distance. This allows us to focus on the best case. We treat empty hops (marked with a ∗) as any other character. When we observe differences between paths, we analyze where the differences are in the path: origin AS, middle of the path, or destination AS. We map IPs to ASes using the RIPEstat Data API [11]. The location where the two paths diverge help us understand the placement of middleboxes.
5.2 Path lengths
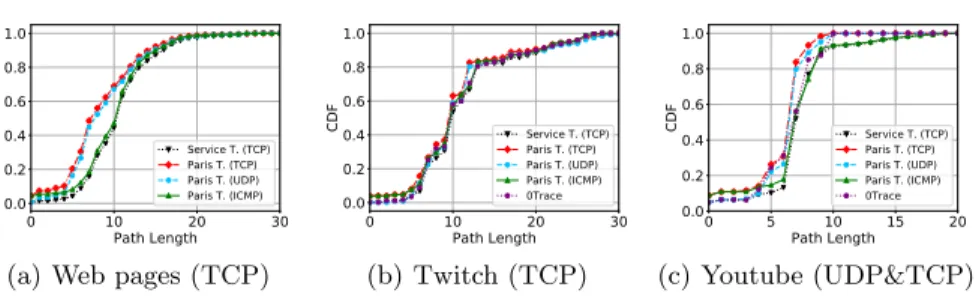
We study the length of paths discovered with Service traceroute, Paris traceroute MDA (TCP, ICMP, and UDP), and 0Trace. The comparison of path lengths helps capture which versions of traceroute discover more hops. For application diagnosis it is important that the tool reveals most (hopefully all) of the path, so that we can identify issues in any parts of the path. Figure 2 presents the cumulative distribution functions of path length for each service: Web, Twitch, and Youtube (UDP and TCP). We see that for all three services, probing with TCP and UDP discovers less hops. The Web results confirm Luckie et al.[8]’s
0 10 20 30 Path Length 0.0 0.2 0.4 0.6 0.8 1.0 CDF Service T. (TCP) Paris T. (TCP) Paris T. (UDP) Paris T. (ICMP)
(a) Web pages (TCP)
0 10 20 30 Path Length 0.0 0.2 0.4 0.6 0.8 1.0 CDF Service T. (TCP) Paris T. (TCP) Paris T. (UDP) Paris T. (ICMP) 0Trace (b) Twitch (TCP) 0 5 10 15 20 Path Length 0.0 0.2 0.4 0.6 0.8 1.0 CDF Service T. (TCP) Paris T. (TCP) Paris T. (UDP) Paris T. (ICMP) 0Trace (c) Youtube (UDP&TCP) Fig. 2. Length of paths discovered with different versions of traceroute. analysis from ten years ago, which showed that UDP probes cannot reach the top Alexa web sites as probes correspond to no active flow. Service traceroute discovers longer paths for all three services. ICMP and 0Trace discover paths that are almost as long as those discovered by Service traceroute. The next sections characterize the path edit distance and the location of path differences to shed light on the causes of the differences we observe in path length.
5.3 Path differences when tracing with different flow IDs
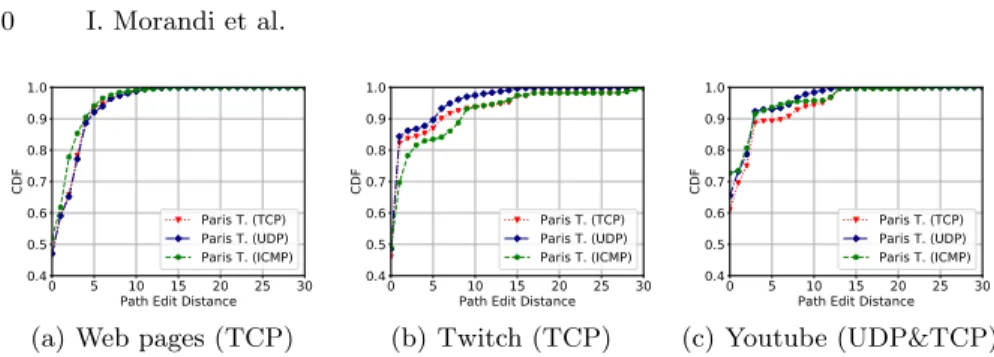
This section studies the differences in paths discovered by Service traceroute versus by other traceroutes in the most typical case, i.e., when traceroute starts a new flow and picks the port numbers with no knowledge of the target application flow ID. We compare with Paris traceroute MDA using TCP, UDP, and ICMP. Figure 3 presents the cumulative distribution functions of path edit distance between Service traceroute and Paris traceroute for Web, Twitch, and Youtube (UDP and TCP). A path edit distance of zero corresponds to the case when the Paris traceroute output contains the path discovered by Service traceroute. We see that even though we select the closest path in Paris traceroute’s output to compute the edit distance, the path discovered with Service traceroute only matches that discovered by Paris traceroute MDA in about 55% of the web-page downloads, 50% of the Twitch sessions, and almost 75% of the Youtube streaming sessions. When paths discovered by Service traceroute differ from paths discovered by Paris traceroute, the edit distance is relatively high as the vast majority of paths towards these services is less than 15 hops long. In gen-eral, Twitch has longer paths (up to 30 hops) and Youtube shorter (up to 20 hops), which explains the differences in the values of edit distance we observe. For Twitch, UDP discovers paths that are the most similar to Service tracer-oute’s paths, whereas for both Web and Youtube, ICMP leads to the most similar paths.
5.4 Path differences when tracing with same flow ID as application
One possible explanation for the differences we observe in the previous section is the fact that the flow ID of Paris traceroute probes is different than the ID of the target application flow, which can trigger different forwarding decisions
0 5 10 15 20 25 30 Path Edit Distance 0.4 0.5 0.6 0.7 0.8 0.9 1.0 CDF Paris T. (TCP) Paris T. (UDP) Paris T. (ICMP)
(a) Web pages (TCP)
0 5 10 15 20 25 30 Path Edit Distance 0.4 0.5 0.6 0.7 0.8 0.9 1.0 CDF Paris T. (TCP) Paris T. (UDP) Paris T. (ICMP) (b) Twitch (TCP) 0 5 10 15 20 25 30 Path Edit Distance 0.4 0.5 0.6 0.7 0.8 0.9 1.0 CDF Paris T. (TCP) Paris T. (UDP) Paris T. (ICMP) (c) Youtube (UDP&TCP) Fig. 3. Path edit distance between Service traceroute and Paris Traceroute. in middleboxes that act per flow. In this section, we compare Service tracer-oute’s output with Paris traceroute when it uses the same flow ID as the target application flow. Note that in this case Paris traceroute still runs after the tar-get application flow finishes, we tar-get the correct flow ID based on the Service traceroute’s run just before in order to guarantee a complete match
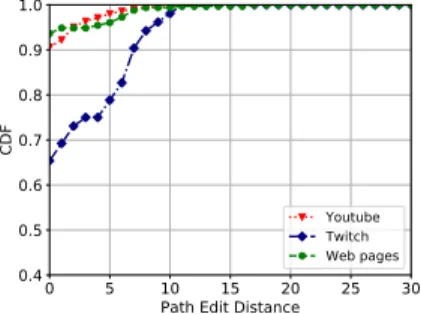
Figure 4 compares the path discovered by Service traceroute with that dis-covered by Paris traceroute when using the exact same flow ID as the target application flow. In this case, Paris traceroute discovers the same path as Ser-vice traceroute more often than when probing with MDA: about 65% of Twitch sessions, 91% of Youtube sessions, and 93% of web downloads. This result shows that issuing probes with a different flow ID than that of the target applica-tion flow causes most of the differences we observe in the previous secapplica-tion. The remaining differences are due to three possible causes: (i) path changes that might occur between the runs of Service traceroute and Paris traceroute; (ii) per-packet load balancing; or (iii) middleboxes (such as application-layer prox-ies or firewalls) that track the state of TCP connections and may hence drop packets after connections are terminated. In fact, in our initial testing we no-ticed cases of probes not generating any ICMP response if issued after the target application flow finishes. We further examine the paths for Twitch to shed light on the reasons for the large fraction of paths that are different between Paris traceroute and Service traceroute. It is unlikely to have routing changes for about 45% of paths and we verified that there are no middleboxes dropping our probes (which would appear as stars). Thus, we conjecture that the differences are likely due to per-packet load balancing, but we must run further experiments to verify this conjecture.
We also compare Service traceroute with 0Trace. Unfortunately, due to how web browsers loop across a large number of different ports, both Twitch and Youtube often change port numbers between consecutive runs. Given that we launch a new video session to probe with 0Trace, the result is that Service traceroute and 0Trace often issue probes with different flow IDs. This issue biases our experiments, and hence we omit these results (available at [9]).
5.5 Location of path divergence points
To help explain our results we study the location of the points where Service traceroute’s and Paris traceroute’s paths diverge, which we call the divergence
0 5 10 15 20 25 30 Path Edit Distance
0.4 0.5 0.6 0.7 0.8 0.9 1.0 CDF Youtube Twitch Web pages
Fig. 4. Path edit distance between Service traceroute and Paris traceroute using the same flow ID.
point. Table 1 shows the fraction of experiments with divergence points at the origin AS, the middle of the path, and the destination AS. We conduct this analysis to help explain the results in the previous sections, but we note that the findings are heavily biased by our vantage points and destinations.
Table 1. Location of divergence points [% of all flows]
Web Pages (TCP) Twitch (TCP) Youtube (TCP and UDP)
Configuration Origin Middle Dest. Origin Middle Dest. Origin Middle Dest.
MDA UDP 7.33 39.82 4.92 0.41 50.56 0.64 12.49 19.52 3.15
MDA TCP 15.13 34.37 2.86 4.28 49.17 0.51 15.67 19.13 3.92
MDA ICMP 9.11 19.04 17.44 7.35 44.50 1.99 6.81 19.95 1.55
PT same flow ID 4.06 1.81 1.03 8.43 24.72 2.18 4.08 0.87 4.61
For the three applications, when comparing with MDA most of the divergence points are in the middle (from 19% for Youtube to above 40% for Twitch). Given the middle contains more hops it is not too surprising that it also contains more divergence points. When using Paris traceroute with the same flow ID, however, the percentage of divergence points in the middle decreases substantially to less than 2% for Web and Youtube and to 24% for Twitch. This result indicates that divergence points in the middle mostly correspond to middleboxes that perform per-flow forwarding. Paris traceroute’s MDA discovers all possible interfaces for every hop of the path and we compare the closest path MDA finds to Service traceroute’s output, but MDA often uses different flow IDs than the target appli-cation flow and hence it may not get the exact same sequence of hops end-to-end. For Paris traceroute with the same flow ID, we observe more divergence points at the origin, which may indicate path changes. The only exception is Twitch, which still has around 24% of divergence points in the middle. Our analysis of these divergence points shows that half of them are within a single ISP: GTT Communications (AS 3257).
6
Related Work
Since Jacobson’s original traceroute tool [4], a number of new versions have emerged with different features and with new methods for constructing probes
(e.g., Paris traceroute [2, 16] and tcptraceroute [15]). All these traceroute versions have a drawback for the goal of diagnosing a target application flow because they start a new flow to send probes. As such, middleboxes may treat them differently than the target application flow. Service traceroute avoids this issue by piggybacking traceroute probes within active application flows. This idea was first introduced in paratrace [6], which is no longer available, and then re-implemented in 0trace [5] with the goal of tracing through firewalls and in TCP sidecar [13] for reducing complaints of large-scale traceroute probing for topology mapping. Unfortunately, none of these tools is actively maintained. Service traceroute adds the capability of automatically identifying application flows to trace by a domain name, of tracing UDP flows as well as of tracing multiple concurrent flows that compose a service. We release both a command-line and a library version as open source. Furthermore, we present an evaluation of the side-effects of piggybacking traceroute probes within application traffic as well as of its benefit by comparing the differences with Paris traceroute and with 0Trace. Our characterization reappraises some of the findings from Luckie et al. [8], which show that the discovered paths depend on the protocol used in the probes. Their study, however, includes no traceroute tools that piggyback on application flows.
7
Conclusion
In this paper we present Service traceroute, a tool to trace paths of flows of modern Internet services by piggybacking TTL-limited probes within target ap-plication flows. Our evaluation of paths to popular websites and video services from PlanetLab Europe shows that Service traceroute’s probing has no effect on target application flows. Moreover, a typical traceroute tool that launches a new flow to the same destination discovers different paths than when embed-ding probes in the application flow in a significant fraction of experiments (from 40% to 50% of our experiments) as our comparison with Paris traceroute shows. When we set Paris traceroute’s flow ID to that of the target application flow, the resulting paths are more similar to Service traceroute’s. Identifying the flow ID to probe, however, is not trivial. Modern applications rely on a large pool of servers/ports. Even to run 0Trace, which implements the same idea of pig-gybacking probes in the application flow, we had to rely on Service traceroute’s
functionality to identify target application flow IDs to probe. In future work,
we plan to add the support of IPv6 to Service traceroute. We further plan to perform a larger scale characterization of results of Service traceroute across a wide variety of services and a larger set of globally distributed vantage points.
Acknowledgements This work was supported by the ANR Project No
ANR-15-CE25-0013-01 (BottleNet), a Google Faculty Research Award, and Inria through the IPL BetterNet and the associate team HOMENET.
References
1. Service Traceroute. https://github.com/inria-muse/service-traceroute.
2. B. Augustin, X. Cuvellier, B. Orgogozo, F. Viger, T. Friedman, M. Latapy, C. Mag-nien, and R. Teixeira. Avoiding Traceroute Anomalies with Paris Traceroute. In Proc. IMC, 2006.
3. S. Banerjee, T. G. Griffin, and M. Pias. The interdomain connectivity of planetlab nodes. In International Workshop on Passive and Active Network Measurement, pages 73–82. Springer, 2004.
4. V. Jacobson. traceroute, Feb 1989.
5. Jake Edge. Tracing behind the firewall, 2007. https://lwn.net/Articles/
217076/.
6. D. Kaminsky. Parasitic Traceroute via Established TCP Flows & IPID Hopcount. https://man.cx/paratrace.
7. A. Langley, A. Riddoch, A. Wilk, A. Vicente, C. Krasic, D. Zhang, F. Yang, F. Kouranov, I. Swett, J. Iyengar, et al. The quic transport protocol: Design and internet-scale deployment. In Proceedings of the Conference of the ACM Special Interest Group on Data Communication, pages 183–196. ACM, 2017.
8. M. Luckie, Y. Hyun, and B. Huffaker. Traceroute Probe Method and Forward IP Path Inference. In Proc. IMC, Vouliagmeni, Greece, 2008.
9. I. Morandi. Service traceroute: Tracing paths of application flows, 2018.
Master thesis, UPMC-Paris 6 Sorbonne Universit´es: https://hal.inria.fr/
hal-01888618.
10. Netflix Open Connect Overview. https://openconnect.netflix.com/
Open-Connect-Overview.pdf.
11. RIPEstat Data API. https://stat.ripe.net/docs/data_api.
12. Q. Scheitle, O. Hohlfeld, J. Gamba, J. Jelten, T. Zimmermann, S. D. Strowes, and N. Vallina-Rodriguez. A long way to the top: Significance, structure, and stability of internet top lists. arXiv preprint arXiv:1805.11506, 2018.
13. R. Sherwood and N. Spring. Touring the internet in a tcp sidecar. In Proceedings of the 6th ACM SIGCOMM conference on Internet measurement, pages 339–344. ACM, 2006.
14. N. Spring, L. Peterson, A. Bavier, and V. Pai. Using planetlab for network research: myths, realities, and best practices. ACM SIGOPS Operating Systems Review, 40(1):17–24, 2006.
15. M. Torren. Tcptraceroute-a traceroute implementation using tcp packets.
man page, unix (2001). See source code: http://michael.toren.net/code/
tcptraceroute.
16. D. Veitch, B. Augustin, T. Friedman, and R. Teixeira. Failure Control in Multipath Route Tracing. In Proc. IEEE INFOCOM, 2009.