يملعلا ثحبلا و يلاعلا ميلعتلا ةرازو
Seismic vulnerability and risk assessment
of Annaba region (Algeria)
FACULTE DES SCIENCES DE L’INGENIORAT DEPARTEMENT DE GENIE CIVIL
THESE
Thème
Présentée en vue de l’obtention du diplôme de DOCTORAT en Génie Civil
Année : 2015
راتخم يجاب ةعماج
-ةبانع
BADJI MOKHTAR UNIVERSITY- ANNABAUNIVERSITE BADJI MOKHTAR - ANNABA
Option : Structure
Par :
Athmani Alla Eddine
Directeur de Thèse:
GOUASMIA Abdelhacine - MCA - Université de Badji Mokhtar, Annaba Co-Directeur:
DJEGHABA Kamel - Professeur- Université de Badji Mokhtar, Annaba
Devant Jury: Président:
REDJEL Bachir - Professeur- Université de Badji Mokhtar, Annaba Examinateurs:
MERZOUD Mouloud - Professeur- Université de Badji Mokhtar, Annaba BENMARCE Abdelaziz - Professeur- Université de 8 Mai 1945, Guelma NOUAOURIA M-Salah - Professeur- Université de 8 Mai 1945, Guelma Guelma
1
ACKNOWLEDGEMENTS
In the name of Allah, the Most Gracious and the Most Merciful Alhamdulillah, all praises to Allah for the strengths and His blessing in completing this Phd thesis.
During the period of my research in the interesting field of the seismic risk at Annaba city, many people have contributed in various ways to this final dissertation. Firstly, I would like to thank my supervisor Dr. Gouasmia Abdelhacine for his aid and encouragements constantly provided during the period of my Phd.
A special thanks to Dr. Boukri Mehdi; a researcher at the Algerian National Earthquake Engineering Centre (CGS) for his guidance and learning me the basic elements of the applied methods.
I thank also the Annaba city council (technical organism in charge of the Technical Control of Construction, CTC) and DUCH (Direction of Urban planning and Construction of Habitation) for providing the data of the study area.
I wish to express my deep acknowledgment to Professor Romeu da Silva Vicente for his help and the opportunity he gave me to do a research training period in Aveiro University - Portugal and the guidance during my stay together with my best friend Dr. Tiago Miguel Ferreira. Sincerely, without their support and advice, this work would not be possible.
In this thesis, very valuable information about the historical seismicity and the active faults located in Algeria are presented as well as the probabilistic seismic hazard assessment of Annaba city. This fact leads me to be very grateful to Dr. Mezouar Nourredine; also a researcher at the Algerian National Earthquake Engineering Centre (CGS) for the data provision and Dr. Assia Harbi, research director of CRAAG; the Algerian Centre for Research in Astronomy, Astrophysics and Geophysics in addition for her help in the very difficult moments.
My deepest gratitude goes to my sister and brothers, to my wife Khemis Asma; Phd student at the same Department of Civil Engineering - University of Badji Mokhtar Annaba -, and her family for their love and invaluable care.
Finally, in fact that I did not find a way to thank the dearest two persons in my heart, I have to leave my God to thank them instead of me. They are my parents, who have always given me the strength and wisdom to be sincere in my work, for setting high moral standards and supporting to reach my dreams, and for their unselfish love and affection. This dissertation is dedicated to them.
Abstract:
This thesis addresses and discusses the seismic risk associated to the old urban areas of the Algerian city of Annaba. In this sense, two seismic vulnerability index methods and damage estimation have been adapted and applied wherein the first one is based on the EMS-98 building typologies, and the second is based on the Italian GNDT approach. To accomplish this task, we employed an existing data survey, which, however, was not originally developed for seismic purposes. It was used herein to provide input to the vulnerability methods. The goal of this research thesis was not only to assess the seismic vulnerability and expected damage within Annaba, but also to adapt the two mentioned approaches to the existing data survey, aiming to use such nonspecific building database and to study the possibility of its application for seismic risk estimation in similar regions. About 380 of historical masonry buildings were assessed using the selected methodologies, aiming at evaluating the expected physical damage.
2
Subsequently different seismic scenarios were developed at urban-scale analysis, in order to evaluate the relevant expected economic and human losses in the studied area. For depicting and analyzing the obtained results from the application of the two methods, the results were integrated and compared using a geographic information system (GIS), which proving that the vulnerability of the buildings surveyed in Annaba is significant and therefore public awareness are required. Consequently, the ultimate goal is to support the city council of Annaba for the implementation of risk mitigation and emergency planning strategies.
RESUME
Cette thèse, adresse et discute le risque sismique associé aux anciennes zones urbaines de la ville Algérienne d’Annaba. À cet égard, deux méthodes d’indice de vulnérabilité sismique et estimation des dommages ont été adaptées et appliquées, dont la première est basée sur les typologies de construction EMS-98, et la deuxième est inspirée de l'approche Italienne GNDT. Pour accomplir cette tâche, nous avons utilisé une enquête de données existante, qui, cependant, n'a pas été développée à l'origine à des fins sismiques. Elle a été utilisée ici pour apporter une entrée de données aux méthodes de vulnérabilité. L’objectif de cette thèse de recherche n'était pas seulement d'évaluer la vulnérabilité sismique et les dommages attendus à Annaba, mais aussi d'adapter les deux approches mentionnées à l'enquête de données existante, dans le but d'utiliser cette base de données spécifique des constructions et d'étudier la possibilité d’évaluer le risque sismique dans des régions similaires. A propos de 380 bâtiments historiques en maçonnerie ont été évalués en utilisant les méthodologies choisies, visant à évaluer les dommages physiques attendus. Par la suite, différents scénarios sismiques ont été développés à l'analyse d'échelle urbaine, afin d'évaluer les pertes économiques et humaines escomptés pertinents dans la zone étudiée. Pour illustrer et analyser les résultats obtenus à partir de l'application des deux méthodes, les résultats ont été intégrées et comparées en utilisant un système d'information géographique (SIG), qui a prouvé que la vulnérabilité des bâtiments étudiés d’Annaba est importante, et donc la sensibilisation du public est nécessaire. Par conséquent, le but ultime est de soutenir le conseil de la ville d'Annaba pour la mise en œuvre des stratégies d'atténuation des risques et de planification d'urgence.
صخلم
هذه لأا ةحوطر انت ميدقلا يوضحلا قطرانملاب طبتوملا لزلازلا وطراخم شق يف يوئازجلا نيدملا صلا اذه يفح . بانع ،دد فييكت مت يلازلزلا فعضلا وشؤم نيتقيوطر ثية اهقيبطتح راوضلأا ويدقتح ت لحلأا موق ى ءانب طرامنأ ىلع EMS-98 ح ، ت دنتس يناثلا جهن ىلع GNDT ا فظح ، مهملا هذه زاجنلإ .يلاطيلإ ا دوجوم تانايب حسم باتكل ة مل ،كلذ عم ،يتلا ت تعضح نك ل تلاخدم ويفوتل انه مدختست تناك . يلازلز ضاوغلأ لاصأ نيتقيوط .فعضلا لا فده نم طقف سيل يثحبلا ةحوطرلأا هذه فعضلا مييقتل لا يلازلز يئاصقتسلاا ساردلا ىلع روكذملا جهنلا نم نينثا فيكت اضيأ نكلح ، بانع يف عقوتملا روضلاح ىلع لوصحلل قيبطت نم يناكمإ سارد ىلع ىنبملاح ةددحم ويغ تانايبلا ةدعاق هذه مادختسا ىلإ فدهتح ،ةدوجوملا تانايبلا لثامم قطرانم يف لزلازلا وطراخم ويدقت . يلاوة 083 نابملا نم مييقت مت يوجة يخيراتلا ي اه ،ةددحم تايجهنملا مادختساب ىلإ فدهت عقوتملا يداملا راوضلأا مييقت . قطرانملا قاطن ىلع ليلحت يف فلتخم يلازلز تاهويرانيس ويوطت مت كلذ دعب ساردلا قطنم يف لصلا تاذ عقوتملا يوشبلاح يداصتقلاا وئاسخلا مييقت فدهب ، يوضحلا . روصتل نراقمح ح جئاتنلا ليلحت قيبطت نم اهيلع لوصحلا مت يتلا لا يفاوغجلا تامولعملا ماظن مادختسا مت نيتقيوط (GIS) لاح ، ذ ي أ ينابملا فعض نأ تبث سلجم معد وه يئاهنلا فدهلا نإف ،كلذ ىلع ءانبح .ماعلا يعولا جاة كانه يلاتلابح ،ويبك بانع يف ساردلا اهتلمش يتلا بانع نيدم ئراوطلا تلااحل طيطختلاح وطراخملا نم فيفختلا تايجيتاوتسا ذيفنتل .3
INDEX:
Chapter I: Seismic risk assessment
I.1 GENERALITY ... 8
I.1.1 INTRODUCTION ... 8
I.1.2 MANAGEMENT AND TOOLS ... 10
I.2 OUTLINE OF THE THESIS ... 11
I.2.1 CONTRIBUTION ... 11
I.2.2 MOTIVATION ... 12
I.2.3 ORGANIZATION... 13
Chapter II: Seismic hazard
II.1 INTRODUCTION ... 14II.2 EVALUATION OF THE SEISMIC HAZARD ... 14
II.2.1 DETERMINISTIC SEISMIC HAZARD ANALYSIS (DSHA) ... 15
II.2.2 PROBABILISTIC SEISMIC HAZARD ANALYSIS (PSHA) ... 16
II.3 DETERMINISTIC VERSUS PROBABILISTIC APPROACHES ... 18
II.4 SEISMIC ACTIVITY OF THE NORTHERN OF ALGERIA ... 18
II.4.1 SEISMIC EVENTS ... 18
II.4.2 ACTIVE FAULTS ... 19
II.4.3 MACROSEISMIC INTENSITY ... 20
II.5 SEISMIC ACTIVITY IN THE NORTH-EASTERN OF ALGERIA ... 21
II.5.1 SEISMIC EVENTS ... 21
II.5.2 ACTIVE FAULTS ... 23
II.5.3 MACROSEISMIC INTENSITY ... 23
II.6 SEISMIC ACTIVITY OF ANNABA CITY ... 24
II.6.1 SEISMIC EVENTS ... 24
II.6.2 ACTIVE FAULTS ... 25
II.6.3 MACROSEISMIC INTENSITY ... 25
II.7 SEISMIC HAZARD ASSESSMENT OF ANNABA CITY ... 26
II.7.1 PROBABILISTIC ESTIMATION ... 26
II.7.2 DETERMINISTIC ESTIMATION ... 26
Chapter III: Seismic vulnerability
III.1 INTRODUCTION ... 28III.2 SEISMIC VULNERABILITY ASSESSMENT METHODOLOGIES FOR BUILDINGS ... 28
4
III.2.2 DAMAGE PROBABILITY MATRICES ... 30
III.2.3 VULNERABILITY INDEX METHODS ... 33
III.2.4 ANALYTICAL APPROACHES ... 34
III.2.5 HYBRID METHODS ... 35
III.3 LITERATURE REVIEW ON RESPECTS TO SEISMIC RISK ANALYSIS REQUIREMENTS ... 36
III.4 THE DESCRIPTION OF THE SELECTED METHODOLOGIES ... 36
III.4.1 GNDT APPROACH ... 36
III.4.1.1 Second level for masonry buildings ... 37
III.4.1.2 Damage grade estimation ... 38
III.4.2 RISK-UELM1 METHOD ... 40
III.4.2.1 Masonry building classification ... 40
III.4.2.2 BTM and final vulnerability index ... 41
III.4.2.3 Behavior Modifier factor ∆Vm ... 43
III.4.2.4 Regional Vulnerability Factor ∆VR ... 43
III.4.2.5 Total vulnerability index ... 44
III.4.2.6 Estimation of the damage distribution ... 44
a. Damage grade definition ... 44
b. Mean damage grade ... 44
c. Damage distribution ... 45
III.4.3 CORRESPONDENCE BETWEEN BOTH VULNERABILITY INDEXES IV AND V... 46
Chapter IV: Exposure
IV.1 INTRODUCTION ... 47IV.2 ANNABA CITY ... 47
IV.2.1 HISTORY AND EVOLUTION ... 48
IV.2.2 POPULATION AND BUILDINGS STOCK ... 49
IV.3 THE OLD CITY CENTRE OF ANNABA ... 50
IV.3.1 HISTORY AND EVOLUTION ... 50
IV.3.2 DATA INVENTORY ... 51
IV.3.3 POPULATION AND BUILDING STOCK ... 53
Chapter V: Contribution
V.1 INTRODUCTION ... 59V.2 THE APPLIED METHODOLOGIES ... 59
V.2.1 GNDT APPROACH ... 59
V.2.2 EMS-98 APPROACH ... 62
V.3 VULNERABILITY ASSESSMENT AND RELIABILITY OF RESULTS, DAMAGE DISTRIBUTIONS AND SCENARIOS ... 62
V.3.1 SEISMIC VULNERABILITY ASSESSMENT ... 62
5
V.3.3 SEISMIC SCENARIO AND DISTRIBUTION OF PHYSICAL DAMAGE ... 66
V.3.4 MEAN VULNERABILITY CURVES ... 69
V.4 CREATION OF LOSS SCENARIOS ... 71
V.4.1 ASSESSMENT OF THE DAMAGE DISTRIBUTION PROBABILITY ... 71
V.4.2 COLLAPSED AND UNUSABLE BUILDINGS ... 73
V.4.3 HUMAN CASUALTIES AND HOMELESSNESS ... 76
V.4.4 ECONOMIC LOSS AND REPAIR COST ESTIMATION ... 79
FINAL CONCLUSION ... 81
Appendix
APPLICATION PROCEDURE ... 83REFERENCES ... 125
LISTE OF TABLES :
Table II.1: Representative applications of DSHA and PSHA approaches ... 18Table II.2: Seismic sources lines in the northeastern of Algeria and their characteristics ... 23
Table II.3: List of the earthquakes that have strong to damaging effects at Annaba ... 25
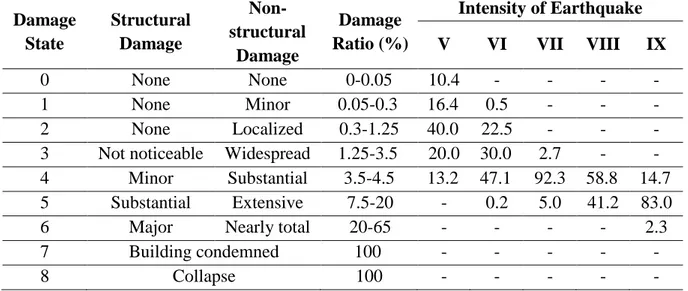
Table III.1: Format of the Damage Probability Matrix Proposed by Whitman et al. (1973) . 31 Table III.2: Damage matrices for vulnerability classes A-F ... 32
Table III.3: Scores and relative weights to compute Iv ... 38
Table III.4: Definition of the damage grades according to the macroseismic method ... 39
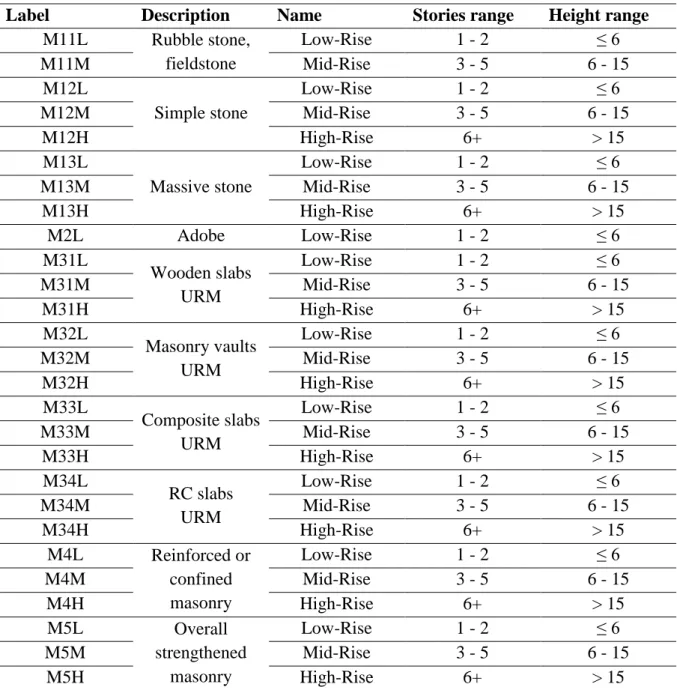
Table III.5: RISK-UE Building Typology Matrix for masonry buildings ... 41
Table III.6: Attribution of vulnerability classes to different building typologies ... 42
Table III.7: Vulnerability index values for each vulnerability class... 42
Table III.8: Vulnerability indices for BTM masonry buildings ... 42
Table III.9: Scores for the vulnerability factors Vm: masonry buildings ... 43
Table III.10: Classification of damage grade according to RISK-UE LM1 method ... 44
Table III.11: Correlation between the vulnerability indexes and the vulnerability classes defined in terms of the EMS-98 scale ... 46
Table V.1: The modified GNDT II method ... 61
Table V.2: Percentage distribution of DR values for different EMS-98 intensities ... 65
Table V.3: Results of the collapsed and unusable buildings for different macroseismic scenarios ... 76
Table V.4: Results of the dead and severely injured, and homelessness inhabitants for different macroseismic scenarios ... 79
Table V.5: Correlation between damage levels and damage index... 79
LISTE OF FIGURES :
Fig. I.1: The causal chain from basic research disciplines to preventive actions through earthquake loss estimation. ... 96
Fig. II.2: Diagrams showing four steps of probabilistic seismic hazard analysis ... 17
Fig. II.3: The seismic activity in north of Algeria from 1980 to 2013 ... 19
Fig. II.4: The active faults in the north of Algeria ... 20
Fig. II.5: Map of maximum intensities for 1716-1989. ... 20
Fig. II.6: Maximum observed intensity (MOI) map of north of Algeria (2014) ... 21
Fig. II.7: The spatial distribution of the seismic events in north-eastern Algeria ... 22
Fig. II.8: Maximum intensities of the north-easthern of Algeria ... 24
Fig. II.9: Active faults of Annaba Sea ... 25
Fig. II.10: Seismic hazard maps of Annaba city in terms of PGA for 100, 200 and 500 return periods. ... 26
Fig. II.11: DSHA for Annaba city ... 27
Fig. II.12: DSHA for Annaba region ... 27
Fig. III.1: The different seismic vulnerability assessment methods and their applicability scales ... 29
Fig. III.2 : The choices for the seismic vulnerability assessment procedure; the bold path shows a traditional assessment method ... 29
Fig. III.3: Analytical way to generate building capacity curves which ideally represent the nonlinear (damaging) behavior under a statically increasing lateral load ... 34
Fig. III.4: Conversion of design response spectrum into Sa–Sd domain. ... 35
Fig. III.5: Acceleration versus damage ratio tri-linear curves for masonry buildings proposed in the GNDT II level approach ... 39
Fig. III.6: Damage equivalence between the EMS-98 scale and GNDT method ... 39
Fig. IV.1: Location of Annaba city ... 47
Fig. IV.2: Urbane evolution of Annaba city ... 49
Fig. IV.3: Geography and aerial view of the old city center of Annaba... 50
Fig. IV.4: Parameters that compose the CTC data sheets... 52
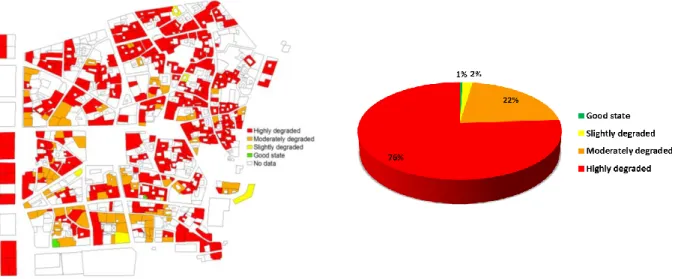
Fig. IV.5: Spatial distribution of the collected data according to habitability state ... 53
Fig. IV.6: Alleys and streets of the study area “Place d’arme” ... 53
Fig. IV.7: Distribution of buildings stock according to their type of usage and occupation level ... 54
Fig. IV.8: Spatial distribution of the collected data according to health state ... 54
Fig. IV.9: Distribution of buildings according to structural systems ... 58
Fig. V.1: Vulnerability index according to: a) GNDT II and b) RISK-UE LM1 ... 63
Fig. V.2: Comparison of the results derived from the two methods (RISK-UE LM1 and GNDT II) in terms of the residual damage value (DR) ... 65
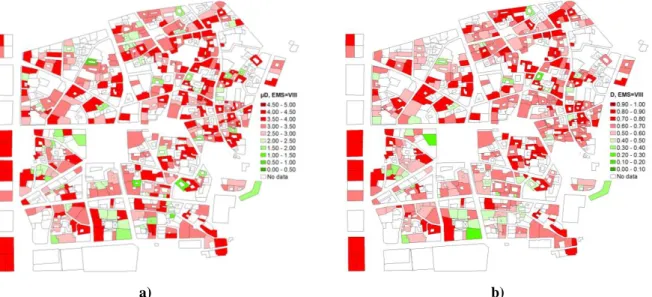
Fig. V.3: Distribution of the damage grades µD and D for the EMS-98 intensities VII, VIII, IX, and X. ... 66
Fig. V.4: Damage scenarios for IEMS-98 = VII obtained for the applied methods: a) RISK-UE and b) GNDT II ... 67
Fig. V.5: Damage scenarios for IEMS-98 =VIII obtained for the applied methods: a) RISK-UE and b) GNDT II ... 68
Fig. V.6: Damage scenarios for IEMS-98 = IX obtained for the applied methods: a) RISK-UE and b) GNDT II ... 68
7
Fig. V.7: Damage scenarios for IEMS-98 =X obtained for the applied methods: a) RISK-UE and
b) GNDT II ... 68
Fig. V. 8: Vulnerability curves for the entire old buildings stock of Annaba city; a) RISK-UE, b) GNDT II ... 69
Fig. V.9: Mean vulnerability curves regarding the mean damage grades µD and D computed considering the RISK-UE LM1 and GNDT II methods ... 70
Fig. V.10: Vulnerability curves for: a) each building typology and b) Annaba masonry building stock ... 70
Fig. V.11: Vulnerability curves for: a) rubble stone and b) adobe buildings ... 71
Fig. V.12: Damage of the buildings stock ... 72
Fig. V.13: Distribution of the damage probability for different seismic scenarios ... 73
Fig. V.14: Estimative of the collapsed and unusable buildings for different seismic scenarios ... 74
Fig. V.15: Evaluation of collapse probability and unusable building for a seismic scenario of IEMS-98=VII ... 74
Fig. V.16: Evaluation of collapse probability and unusable building for a seismic scenario of IEMS-98=VIII ... 75
Fig. V.17: Evaluation of collapse probability and unusable building for a seismic scenario of IEMS-98=IX ... 75
Fig. V.18: Evaluation of collapse probability and unusable building for a seismic scenario of IEMS-98=X ... 75
Fig. V.19: Estimation of homeless and casualty rate for different seismic scenarios ... 77
Fig. V.20: Evaluation of death rate and shelter requirements for a seismic scenario of I EMS-98=VII ... 77
Fig. V.21: Evaluation of death rate and shelter requirements for a seismic scenario of I EMS-98=VIII ... 78
Fig. V.22: Evaluation of death rate and shelter requirements for a seismic scenario of IEMS-98=IX ... 78
Fig. V.23: Evaluation of death rate and shelter requirements for a seismic scenario of IEMS-98=X ... 78
8
Chapter I: Seismic risk assessment
I.1 Generality
I.1.1 Introduction
The seismic phenomenon has lived with the humans since the start of the times. Man, throughout history has always encountered with the earthquake as a natural disaster, and has undergone social and economic losses as a result of it. Generally the lack of man knowledge and his inability to intervene in natural environments, such as excessive construction in faults vicinity, as well as inattention to build with regulations and standards, turn earthquake to a disaster phenomenon. Nowadays, these and many other factors have made sever the threat of accidents resulting from natural phenomena, especially earthquake, and as a result of its occurrence there will be great crisis in human society. In this context, assessing the impact of an earthquake upon an urban area is important for many reasons, one of them is that decision makers can develop disaster impact scenarios, which can be subsequently used to outline preventive measures, applicable to mitigate the probable unlike consequences of the seismic event. Consequently, bolstering the resiliency of communities to such hazardous events should begin with a comprehensive risk assessment. The earthquake risk assessment is a comparably young discipline defined by several researchers namely by , Cardona (2001), Coburn and Spence (2002), McGuire (2004), Barbat et al. (2010) or Maio et al. (2015) as a mathematical convolution between hazard, vulnerability and exposure (Eq. I.1):
Risk = Hazard Vulnerability Exposure (I.1) Where the each parameter is defined as following:
1. Hazard: refers to a latent danger or an external risk factor of an exposed element that can be expressed as the probability of occurrence of an event of certain intensity in a specific site (Barbat et al. 2010). In this sense, the seismic phenomena can be defined as the likelihood of occurrence of a potential damaging earthquake within a given time frame, characterized for being an inevitable event (out of human control) in the area of its location.
2. Vulnerability: Seismic vulnerability is an intrinsic property of the structure, a characteristic of its own behavior due to the occurrence of an earthquake of certain intensity described trough a law of cause-effect, where the cause is the seismic action and the effect is the amount of damage that could be presented in a building. According to Vicente et al. (2011), it can be used to indirectly measure the reduction in a building’s structural efficiency or a building’s residual ability to guarantee its expected use and function under normal conditions.
3. Exposure: the exposure reflects the value of the exposed elements at risk (Ferreira et
al. 2013) which corresponds to the conjunct of the potential social, economic and
9
In the present thesis, the use of the term “seismic risk” represents a true inter-disciplinary research field since it requires the expertise and knowledge of a number of research areas (Fig. I.1) (Lang 2012) such as:
seismology, or more precise seismic hazard assessment (SHA),
geology and tectonics,
geotechnical and structural (earthquake) engineering,
urban land-use planning
sociology, or more precise disaster sociology,
insurance/re-insurance industry,
disaster management and emergency relief, as well as
Geographical Information Systems (GIS).
Fig. I.1: The causal chain from basic research disciplines to preventive actions through earthquake loss estimation (Lang 2012).
Considering the above flow chart (Fig. I.1), it can be concluded that the main purpose of studying the seismic risk upon a buildings stock, is to generate reliable assessment of expected physical damage as well as the economic and social losses that are connected to the damages either in a direct or indirect way. The amount of damage identified in the seismic vulnerability assessment of buildings depends on many factors such as intensity of the seismic action, soil conditions, constructive materials, state of previous damages and structural elements. Another important aspect to consider is whether the structure was designed to resist earthquakes or only
10
to withstand its own self-weight, such as the case of the historical masonry constructions. In this context, considering such typology of buildings stock which is the one presenting the greatest vulnerability (Grünthal 1998), the dilemma of their seismic risk assessment is herein studied especially for the case of the urban areas of Annaba city.
I.1.2 Management and tools
A risk management involves specific planning, practices of mitigation before earthquakes and provision of critical and timely information to improve response of the society after the calamitous event. Regarding the urban areas, the risk management in many cases is undertaken without the use of a general planning tool. A primary consequence of this situation is that city councils or regional authorities (decision makers) do not acquire a global view of the area under analysis, which can compromise the effectiveness of their rehabilitation strategies and risk mitigation measures (Vicente et al. 2008). This fact justifies the need for a developed tool connected to a relational database, through which it is possible to perform integrated analysis of the studied area.
In this context, the GIS (Geographic Information System) represents, nowadays a suitable instrument for multi-disciplinary studies and for the scenario or risk analysis performance. Indeed, throughout a GIS employment, various and complex aspects could be controlled at different scale to develop a complete seismic risk analysis by means of the interaction of hazard estimation, exposure identification and vulnerability assessment.
The GIS system permits to cross different kind of data and verify, from many points of view, the effects deriving from specific territorial phenomena. In particular, a GIS allows to computerize capture, store, analyze, manage and show data linked to a specific zone by means the use of the personal computer. The GIS application software combines geo-referenced graphical data (vectorised information and orthophoto-maps) with building’s information. In this specific case, each polygon (represent a building) was associated with several features and attributes, allowing for their visualization, selection and search (Ferreira et al. 2013). Two types of spatial views were possible: a global view of the entire area under study and, alternatively, a local view of each defined zones.
All calculations of the likelihood multiple damage (such as number of collapsed and unusable buildings) and loss scenarios (like the rate of human death and injuries, repair costs, etc.) presented in this thesis work are programmed in Excel file for different earthquake intensities. This procedure enables rapid data editing of building information, depicting high quality of the scenarios outcomes, which in turn support risk management actions and decisions. All database information associated with GIS application could be updated at any time especially from the prepared Excel file, that’s why this kind of treatment is very rapid and useful especially for the management of the building stock under consideration.
In this work, the potentialities of GIS have been extensively proved in implementing of a mutable and progressive platform that integrated all aspects of seismic risk evaluation of a historical center, from building characteristics to the estimation of economic loss as it will be shown in next Chapters.
11
I.2 Outline of the thesis
I.2.1 Contribution
The main work of this thesis is studying the seismic risk upon an urban district of the city of Annaba through the creation of damage and loss scenarios. Such a study is carried out by mean of comparison between results derived from different urban vulnerability methods using an existing building survey previously performed for other purposes. To perform this task, implicit assumptions and explicit modifications in order to minimize the uncertainties of the final results are applied.
Various methods have been implemented in different countries to assess the seismic vulnerability of buildings wherein their application have shown that among all, those methods based on vulnerability indexes are more suitable for large-scale assessments. Despite their high level of approximation and uncertainties, they present the advantage to consider a large number of buildings (Quiroz et al. 2010) for a first estimate at the city or urban district scale when only limited and general data are available.
The establishment of a new, or the adaptation of an existing, vulnerability assessment approach should take into account criteria suitable to the specific characteristics of the area under study. In particular, the seismic hazard of the site together with the vulnerability of the building tissue depending on the structural architecture, the construction material, the character of use, and the state of health/preservation/robustness of the buildings (Ferreira et al. 2013, Ferreira et al. 2014). It is worth mentioning that when developing an urban earthquake scenario, more detailed inventory and classification scheme should be considered, which at times can be originated from different purposes. In this regard, the building data used in this work comes from an existing general program of a building-by-building detailed survey performed by the CTC (the official technical organization of Annaba city in charge of the Technical Control of Construction), wherein the buildings were classified according to their degradation state, towards setting retrofitting and maintenance priorities (CTC 2010).
Considering the aims of this thesis, two seismic vulnerability index methods, specifically developed for the Euro-Mediterranean area, were selected among the available methodologies; the first one designated as RISK-UE LM1 method (Mouroux and Brun 2006, RISK-UE 2003), which is based on the EMS-98 building typologies (Grünthal 1998), and the second one based on the Italian GNDT approach level II (Benedetti et al. 1988, GNDT 1993b). The main differences found between the results obtained from each of the two methods are compared and discussed in this thesis, taking into account the context of Annaba city and in view of their replication on future seismic vulnerability assessment works apply to other old urban areas in Algeria.
Subsequently, an equivalence between both selected methods is then performed in the aim of assessing for the different seismic scenarios previously evaluated, the likelihood physical losses (rate of buildings in collapse and those unusable) the expected relevant economical and human losses, respectively in terms of repair cost in Dinar of Algeria and the rate of death and injuries people for the built-up area of the old town of Annaba city based especially on the modified GNDT II approach which is considered herein as the main applied method.
12
Finally, it is important to underline that the outputs obtained are then mapped using a GIS tool connected to a relational database, enabling the storage and the spatial analysis of the results into an open, georeferenced and fully upgradable environment.
I.2.2 Motivation
Extensive damage was observed following earthquakes in urban built environments that are concerned especially by the historical masonry structures. The first motivation that attract us to perform this research work, in one hand is that the experience shows a high vulnerability of such buildings to seismic actions, even of moderate intensity, wherein after their collapse, a great amount of people that are killed or seriously injured. In the other hand, the sum of all people that become homeless generates not only an economical but a big social problem difficult to deal with.
In this context, the second motivation is presenting in the case of Annaba (one of the northeast Algerian cities) which is assumed to have a moderate seismic hazard (Aoudia et al. 2000, Boughacha et al. 2004, Hamdache 1998, Harbi 2006, Kherroubi et al. 2009, Peláez et al. 2005). However according to the recent probabilistic microzonation study performed by the Algerian National Earthquake Engineering Centre (CGS 2011) concludes that hazard is significantly higher, with peak ground acceleration (PGA) levels ranging from 0.18 to 0.32g for 200–500year return periods respectively. Therefore, albeit disputed, such considerable hazard level of Annaba necessitates addressing the issue of the seismic risk analysis especially in the case of the historical masonry buildings located in its old city center, due to their accelerated degradation state, material heterogeneity, and past intrusive structural and non-structural modifications. These facts suggest on focusing research efforts to develop tools that emphasizes in these particular conditions. In this regards, to estimate the seismic risk of such building stock, the use of a reliable but expedite assessment method able to accounting the buildings features that most influence their seismic vulnerability is an essential part of a meaningful seismic risk analysis. However, in the case of Annaba city, this task leads to non-accurate and unreliable quantitative building vulnerability, due to the lack of information related to past seismic activities and losses, which are typically used for the calibration and validation process. In this case, the application or the adaptation of existing vulnerability methods already validated in the area of the Euro-Mediterranean region that Algeria belong to, is advisable. The main motivation behind this assumption is founded on the thesis that, accounting for the structural characteristics and urban organizations of the Algerian buildings, they can be considered similar to those which have been studied in Europe and Algeria (Senouci et al. 2013). This assumption is further supported by the great compatibility found between the existing information of the study area (CTC data) and the main parameters used in both methods (Athmani et al. 2014). Therefore, as already mentioned, two European approaches are chosen to be adapted and applied in the context of the built-up environment of Annaba city.
At the end, it is absolutely essential to understand the seismic risk associated to those built environments in a reliable and accurate way. Indeed, knowing the seismic risk and potential losses allows for proper budgetary planning, raising public awareness, assessment and allocation of the necessary manpower for mitigation and disaster management operations,
13
prioritization of retrofit applications, and educating the public and professionals on preparedness.
I.2.3 Organization
According to what exposed above, this thesis is structured in six chapters. The Chapter I presents the generality on the seismic risk assessment highlighting our contribution, and shortly describes the motivation for choosing this research topic as well as provides a general overview of the objectives of the thesis.
The Chapter II, Chapter III and the Chapter IV are related respectively to one parameter that contributing in the definition of the meaningful seismic risk as described in Eq. (I.1). In this context, in descending way starting from the north of Algeria to the its north-east reaching to the our area of interest of Annaba city, the Chapter II consists of identifying and characterizing the active faults and all earthquake events occurred in these zones emphasizing those of significant impact, especially on the old building stock of Annaba.
With regard to vulnerability analysis which is the main element accounting in Chapter III, a review of the existing and most applied vulnerability methods is presented with the aim to accentuate some limitations to be overcome rather than to provide an exhaustive state of the art. In this Chapter, the selected vulnerability approaches are presented in details in their original version. The first one is the Italian GNDT approach level II which is so-called “mother method”, and the second one designated as RISK-UE LM1 method.
Subsequently, the Chapter IV, was reserved for the presentation of the exposure and the elements at risk located in the area of our interest of Annaba city. Additionally, the available data of the buildings stock provided from a general program of a building-by-building detailed survey performed by the CTC (the official technical organization of Annaba city in charge of the Technical Control of Construction) are exhibited.
In the Chapter V, new adaptation of the selected methodologies (GNDT II and RISK-UE) is carried out with which the earthquake risk posed to the Annaba city is quantified by considering the vulnerability of its building stock in in a short, medium and a long-term of seismic hazard. In this regard, the physical damages for the studied historical buildings of the old city center of Annaba for different seismic scenario is presented, wherein the necessary vulnerability curves are drown. Accordingly, the expected relevant losses in terms of collapse and unusable buildings as well as in terms of homeless and casualty people are evaluated for each seismic scenarios. The expected economic losses in term of repair cost of the entire building stock under study demanded in each seismic scenario is also estimated in term of Algerian Dinar (DA).
Finally, the last part of the thesis is reserved for the appendix, where the vast set of building data used as input in the previous chapter to feed the applied methodologies are manipulated. Therefore, based on the description of the inherent parameters defined in each original version of the applied methodologies, their possible application using the non-ad hoc data survey of CTC was carried out in detail. Moreover, the use of the new additional parameters inserted in each method according to the same data source (CTC) is also presented. At the end, the spatial and the frequency distribution of each parameter are depicted for all masonry buildings of the study area.
14
Chapter II: Seismic hazard
II.1 Introduction
The term of hazard is described in the previous studies with different ways however leads to the same meaning. For instance, “a hazard, in a broader definition, is a threat to people and the valuable things. In other way, “Hazard … reflects a potential threat to humans as well as the impact of an event on society and the environment. Therefore, Hazards arise from the interaction between social, technological, and natural systems” (Katharina 2006).
In engineering terms, hazard was described as an extreme geophysical event that is capable of causing a disaster wherein its fundamental determinants are location, timing, magnitude and frequency (Katharina 2006). In this regards, natural hazard is used in a mathematical sense to mean the probability of the occurrence, within a specified period of time and a given area, of a potentially damaging phenomenon of a given intensity (Katharina 2006).
Focusing on the natural phenomena of earthquake, the seismic hazard analysis consists on the estimation and description of the ground motion by an appropriate parameters, which are represented under suitable form of maps required by a seismic risk analysis. This kind of hazard assessment involves studies of historical data, skilled interpretations of existing topographical and geological maps (Gilda 2010).
II.2 Evaluation of the seismic hazard
The goal of many earthquake engineering analyses is to ensure that a structure can withstand a given level of ground shaking while maintaining a desired level of performance. But what level of ground shaking should be used to perform this analysis ?. Given the challenges in earthquake prediction, seismic hazard analysis is considered one of the practical solutions to cope with the complicated, random earthquake process (Wang and Huang 2014). First of all, it should be worth clarifying that such an analysis is not to estimate the damage (casualties and economic loss) caused by earthquakes but to best estimate the level of earthquake-induced ground motion at the site. The seismic hazard characterization of a certain zone under study has been accepted as an engineering solution to the uncertain earthquake process (Wang and Huang 2014) which is recommended to be estimated by considering a combination of seismological, geophysical, geological and geotechnical studies with the history of earthquakes, damages and the experts’ opinion. Site-specific seismic hazards evaluated are then used for developing site-specific earthquake resistant designs.
Two approaches, Deterministic Seismic Hazard Assessment (DSHA) and Probabilistic Seismic Hazard Assessment (PSHA), are commonly used for evaluating seismic hazard. Implicitly, DSHA adopts ‘‘deterministic’’ information during analysis (Mualchin 2005, Wang
et al. 2012), and PSHA accounts for the ‘‘probabilistic’’ characteristics of earthquake size,
location, and ground motion models (Cornell 1968). In broad definition, the deterministic considers each seismic source separately and determines the occurrence of an earthquake of specified size at a specified location. The probabilistic combines the contributions of all relevant sources and allows characterizing the rate at which earthquakes and particular levels of ground
15
motions occur (Giovinazzi 2005). A few case studies have been reported with the two methods (Atkinson and Goda 2013, Azzaro et al. 2013, Bommer 2002, Bozzoni et al. 2011, Moratto et
al. 2007, Ordaz et al. 2014, Wang and Huang 2014).
It is worth to note that the choice of the parameter to be employed for the ground motion characterization depends definitely on the quality of the analysis to be performed. Additionally, the selection of the most suitable parameter for the ground motion description must be coherent with the vulnerability model chosen for the seismic building behavior assessment, for instance; the employment of a physical-mechanical parameter could be for instance inappropriate if reference is made to an observational vulnerability model (Giovinazzi 2005).
II.2.1 Deterministic seismic hazard analysis (DSHA)
The Deterministic Seismic Hazard Analysis has been the earliest approach taken for seismic hazard analysis. This approach (DSHA) uses the geology and seismic history data to identify earthquake sources (single faults or fault zones) to define separately the earthquake scenarios by magnitude, distance between source and area, style of faulting and in some cases rupture direction (Gürboğa and Sarp 2013). The DSHA is proposed on the condition of choosing the worst-case earthquake scenario, usually related to the Maximum Credible Earthquakes (MCEs); the largest earthquakes that can reasonably be expected. The ground motion for the scenario earthquake is usually estimated by using attenuation relationship. These latter take into account the effects of earthquake waves traveling from the epicenter to the site on the ground motions. Local site conditions also need to be considered (Ade et al. 2011). Therefore, DSHA results in an estimation of the ground motion at the site of interest due to the specified scenario earthquake. A typical DSHA can be described in four-step process (Fig. II.1, (Gürboğa and Sarp 2013):
1. Identification and characterization of all sources capable of producing significant ground motion at the site. Providing an exhaustive documentation of the seismic history of the selected site, related to the geological faults, the magnitude of the maximum historical earthquakes and their distance from the site is required. The information can be acquired referring to specific data source, such as earthquake catalogues or seismo-tectonic studies. In general, the territory is divided with cells in order to define a grid. The center of each cell is constituted by a seismo-genetic source, where the maximum magnitude observed in the epicenter area and the distance from the studied region are fixed.
2. Selection of a source-to-site distance parameter for each source zone, generally assumed in order to represent the most unfavorable situation, where the shortest distance between the point or source zone and the site of interest is selected. The distance may be expressed either as an epicentral or hypocentral distance, depending on the measure of distance of the predictive relationship used in the following step.
3. Comparing the level of shaking produced by earthquakes (identified in step 1) assumed to occur at the distances identified in step 2. A controlling earthquake is selected (i.e, the earthquake that is expected to produce the strongest level of shaking) calculating by using an attenuation relationship enabling to estimate the ground shaking within the area of
16
interest, which is described in terms of its size (usually expressed as magnitude) and distance from the site.
4. Finally, the hazard can be defined as the maximum expected value, usually described by one or more ground motion parameters obtained from predictive relationships. Peak ground acceleration (PGA), peak velocity (PGV) and response spectrum ordinates (Sa)
are commonly used to characterize the seismic hazard.
Fig. II.1: Diagrams showing four steps of deterministic seismic hazard analysis (Gürboğa and Sarp 2013) II.2.2 Probabilistic seismic hazard analysis (PSHA)
Probabilistic seismic hazard analysis (PSHA) can be viewed as the assessment of an infinite number of deterministic hazard analyses taking into account all possible earthquakes which have occurred or can occur in the specified region for all possible scenarios of magnitude and distance. In the past 20 to 30 years, the use of probabilistic concepts has allowed uncertainties in the size, location and rate of recurrence of earthquakes and in the variation of ground motion characteristics with earthquake size and location to be explicitly considered in the evaluation of seismic hazards (Gürboğa and Sarp 2013). The PSHA aims to deal with such uncertainties which can be identified, quantified and combined in a rational manner to produce an explicit description distribution of future shaking provide a more complete picture of the seismic hazard.
A probabilistic seismic hazard assessment combines various elements: i) seismic source zones which represent areas of similar seismicity, ii) earthquake recurrence which defines the probability of exceeding a given magnitude for that source zone iii) and the ground motion prediction equations applied for each source zone wherein the total hazard is calculated by the integration of the contributions of each of these zones. The result is a plot of the annual probability of exceedance of accelerations (Gürboğa and Sarp 2013). For summarizing the PSHA, four steps procedure can be described (Fig. II.2, (Gürboğa and Sarp 2013):
17
1. Identically to the first step of DSHA, all earthquakes sources should be firstly identifying to define the spatial variation of earthquake activity, except that the distribution probability of potential rupture locations within the source must also be characterized (Fig. II.2). These source zones are based on the distribution of observed seismic activity together with geological and tectonic factors and represent areas where the seismicity is assumed to be homogenous; i.e. there is an equal chance that a given earthquake will occur at any point in the zone.
2. Next, the seismicity or temporal distribution of earthquake recurrence must be characterized to define the level of activity within a particular source zone. The recurrence relationship may accommodate the maximum size earthquake, but it does not limit consideration to that earthquake, as DSHA often do (Fig. II.1). There are, generally more small (low-magnitude) earthquakes than large (higher magnitude) earthquakes. Again observed seismicity is used to determine the earthquake recurrence relationships.
3. Ground-motion predictive equations (GMPEs) to define ground motion produced by earthquakes of any possible size occurring at any possible point in each source zone (define what ground motion should be expected at location A due to an earthquake of known magnitude at location B). Generally, ground-motion predictive equations are derived from past earthquake observations and also provide a measure of the variability of the ground motion parameter. The uncertainty inherent in the predictive relationship is also considered in a PSHA.
4. Finally, the uncertainties in earthquake location, earthquake size, and ground motion parameter prediction are combined using the calculation known as the total probability theorem to obtain the probability that the ground motion parameter can be exceeded during a particular time period.
18
II.3 Deterministic versus probabilistic approaches
Both probabilistic and deterministic methods have a role in seismic hazard and risk analyses. These two methods have differences, advantages, and disadvantages that often make the use of one advantageous over the other. Although different in methodology, these two methods can complement one another to provide additional insights to the seismic hazard or risk problem. In this context, deterministic events can be checked with a probabilistic analysis to ensure that the event is realistic (focus on a single earthquake), and probabilistic analyses can be checked with deterministic events to see that rational, realistic hypotheses of concern have been included in the analyses (McGuire 2001).
In any relevant seismic hazard or risk analysis the result will be used to make a decision. One method will have priority over the other, depending on how quantitative are the decisions to be made, depending on the seismic environment (whether the location is in a high, moderate, or low seismic risk region), and depending on the scope of the project (whether one is assessing a site risk, a multi-site risk, or risk to a region) (McGuire 2001). This might be the selection of design or retrofit criteria and levels, financial planning for earthquake losses (levels of insurance or reinsurance, or self-insurance), investments for redundant industrial systems, planning for emergency response and post-earthquake recovery, and planning for long-term recovery (McGuire 2001). Details of the factors of choice and how they are considered by deterministic and probabilistic methods are presented in the Table II.1, (McGuire 2001)
Table II.1: Representative applications of DSHA and PSHA approaches (McGuire 2001)
Decision Quantitative aspects of decision
Predominant approach
Seismic design levels Highly quantitative Probabilistic
Retrofit design Highly quantitative Probabilistic
Insurance/reinsurance Highly quantitative Probabilistic
Design of redundant industrial systems Quantitative or qualitative Both Training and plans for emergency response Mostly qualitative Deterministic
Plans for post-earthquake recovery Mostly qualitative Deterministic
Plans for long-term recovery, local Mostly qualitative Deterministic
Plans for long-term recovery, regional Mostly qualitative Probabilistic
II.4 Seismic activity of the northern of Algeria
II.4.1 Seismic events
In recent years, the interest of the scientific community regarding seismology and seismo-tectonics has greatly increased in Algeria, especially in the fields related to the seismic risk assessment and its possible reduction. As already stated, a good starting point towards the assessment of such risk is the seismic hazard of a site, which should be begun by the study of historical earthquakes and active sources.
Algeria is one of the most seismically active areas in the Mediterranean basin. Often, the seismicity of Algeria is characterized by shallow earthquakes, it is located in the first 20
19
kilometers. This seismicity is usually marked by low to moderate earthquakes. However, there were strong earthquakes occurred in the Tell Atlas striking different regions, such as those located in the vicinity of Algiers, which occurred on January 2, 1365 (IX), February 3, 1716 (XI), December 3, 1735 (VII), March 17, 1756 (VIII), November 8, 1802 (VIII), June 18, 1847 (VIII) and November 5, 1924 (VIII), and those located in the vicinity of the city of Oran, on October 9, 1790 (IX–X) and May 21, 1889 (VIII). The Djidjelli earthquake (1856, Io = IX),
Orléansville (1854, Ms 6.7) (Benouar 1994). Moreover, for the last 50 years, the El Asnam
region has suffered the most destructive and damaging earthquakes recorded in northern Algeria, namely those of September 9, 1954 (Ms 6.8) and October 10, 1980 (Ms 7.3). Also in
Constantine (1985, Ms 5.9; (Bounif et al. 1987), Tipasa-Chenoua (1989, Ms 6.0), Mascara
(1994, Ms 6.0). Moreover the well-known earthquake of Boumerdès on May 21, 2003, which
was a destructive earthquake of Mw = 6.8 (Ayadi and Bezzeghoud 2014).
Fig. II.3 illustrates the updated seismic catalog of Algeria: from 1910 to 2013 carried out by the national center of research in astronomy, Astrophysics and Geophysics (CRAAG).
Fig. II.3: The seismic activity in north of Algeria from 1980 to 2013 (CRAAG)
II.4.2 Active faults
The evidence for fault and fold development and on the style of deformation (compressive, strike-slip, …), have been determined on the basis of data collected during the two oceanographic surveys Maradja, 2003; Maradja2/Samra, 2005 which covered from west to east the entire Algerian margin. Different types of high-resolution data have been recorded by instruments on board. Fig. II.4 depicts the different active faults characterized in the north of Algeria (for more details see (Kherroubi et al. 2009)).
20
Fig. II.4: The active faults in the north of Algeria (Kherroubi et al. 2009)
II.4.3 Macroseismic intensity
Map of historical maximum intensities is a compilation of induced effects on the ground by important historical earthquakes in or near an area. The effects of the largest earthquakes on the ground resulted in maximum intensity observations and represented by isoseismals cards.
The map of maximum intensities (Fig. II.5) carried by Bezzeghoud (1996) was used as the reference card because it shows the different areas of high, medium and low seismic risk all over Algeria especially the northern part. It is achieved on the basis of macroseismic data available for all Algerians earthquakes from 1716 to 1989.
Earthquakes collected for the completion of the map of maximum intensities are intensities exceeding V. Indeed, it is accepted according to the MSK scale and updating EMS and the MM scale, a felt movement is considered strong from an intensity V. The light damages begin to I0
= VI and significant damage is to I0 = VIII; an intensity I0 = IX means that the earthquake is
destructive.
21
Before 1900, numerous authors conducted seismic studies following the macroseismic approach by evaluating the intensity in relation to the damage produced and the effects generated by the event (Ayadi and Bezzeghoud 2015). Isoseismal curves were drawn for each earthquake showing the extent of damage near the epicenter and the attenuation of the macroseismic intensity. An updated version of the latest one from Bezzeghoud (1996) (Fig. II.5) incorporated all the data available between 1365 and 2013, including also the strong events of the last two decades, such as Mascara (1994), Ain Temouchent (1999), Zemmouri (2003), Laalam (2001), and Beni Ilmane (2010) is performed by Ayadi and Bezzeghoud (2015). More than a thousand intensity data points were used in this study, however it considered only the maximum observed intensity (MOI) for each earthquake, which enabled to draw a map of seismic zonation that highlights the regions of high, medium, and low levels of seismic shaking in Algeria (Ayadi and Bezzeghoud 2015) (Fig. II.6).
Fig. II.6: Maximum observed intensity (MOI) map of north of Algeria (2014) (Ayadi and Bezzeghoud 2015)
II.5 Seismic activity in the north-eastern of Algeria
II.5.1 Seismic events
The seismicity of the northeast of Algeria is particularly concentrated in the region of Constantine and Guelma (see Fig. II.7). Indeed, for the region of Constantine, at least four earthquakes of maximum intensity VIII were recorded after 1900 (CGS 2011). The first occurred on September 16, 1907; the second on August 4, 1908, with a magnitude Ms = 5.2;
and the third on August 6, 1947, with a magnitude Ms = 5.0 (CGS 2011). Furthermore, on
October 17, 1985, the city of Constantine was shaken by the fourth and the strongest earthquake of magnitude Ms = 6.0 with maximum intensity (VIII to IX) (Bounif et al. 1987). In surrounding
villages, the greatest damage has been recorded mainly in houses and farms, which led to the death of five peoples and the injury of more than 300 (Bounif et al. 1987).
22
Regarding Guelma region, the strongest known earthquake is the one that occurred on February 10, 1937, with a maximum intensity of VIII and a magnitude of Ms = 5.2. According
to Benouar (1994), it occurred very near to two earlier destructive shocks that occurred in 1908 and 1928, which had caused major damages in the same zone. The earthquake was felt in an extensive area, from the eastern part of Constantine to Tabarca in Tunisia.
At sea, active seismicity is observed in north of Skikda. The most known undersea earthquake is that of Djidjelli of August 22, 1856 of VIII intensity according to the EMS scale (Harbi 2006, Harbi et al. 2011). Note also that located in north of Philippeville (Skikda) on September 19, 1935, of intensity VI EMS and magnitude Ms = 4.9 and that of the NE of Annaba
on March 20, 1962 of intensity VII EMS and magnitude Ms = 4.9 and finally the NE earthquake
of El Kala of intensity VI EMS and magnitude Ms = 5.0 (CGS 2011). Fig. II.7 presents the
spatial distribution of the earthquake events in north-eastern Algeria based on the max seismic (Harbi et al. 2010).
Fig. II.7: The spatial distribution of the seismic events in north-eastern Algeria(max magnitude) (Harbi et al. 2010)
23 II.5.2 Active faults
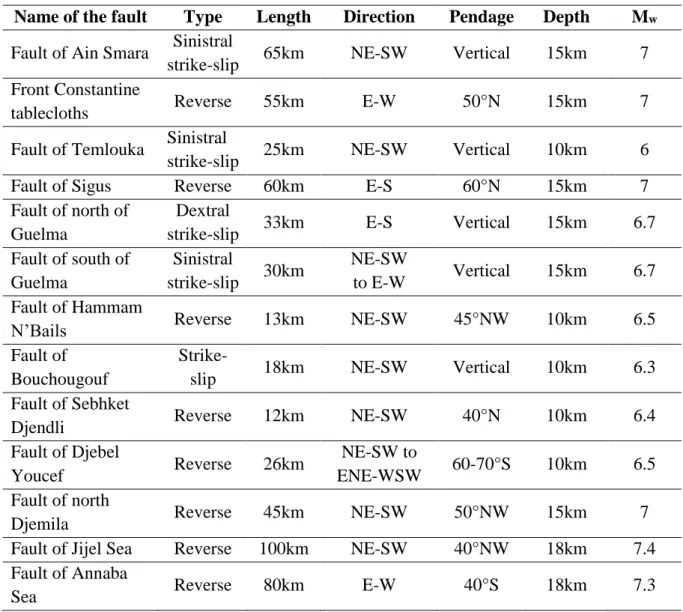
The data from the seismic history, the photo-geological analysis, field investigations and new data published on Neogene and Quaternary deposits of the northeast part of Algeria have helped to highlight a number of active and probably active faults (Fig. II.4). The geometrical characteristics of these faults are summarized in Table II.2 by the Algerian National Earthquake Engineering Centre (CGS 2011):
Table II.2: Seismic sources lines in the northeastern of Algeria and their characteristics (CGS 2011)
Name of the fault Type Length Direction Pendage Depth Mw Fault of Ain Smara Sinistral
strike-slip 65km NE-SW Vertical 15km 7
Front Constantine
tablecloths Reverse 55km E-W 50°N 15km 7
Fault of Temlouka Sinistral
strike-slip 25km NE-SW Vertical 10km 6
Fault of Sigus Reverse 60km E-S 60°N 15km 7
Fault of north of Guelma
Dextral
strike-slip 33km E-S Vertical 15km 6.7
Fault of south of Guelma Sinistral strike-slip 30km NE-SW to E-W Vertical 15km 6.7 Fault of Hammam
N’Bails Reverse 13km NE-SW 45°NW 10km 6.5
Fault of Bouchougouf
Strike-slip 18km NE-SW Vertical 10km 6.3
Fault of Sebhket
Djendli Reverse 12km NE-SW 40°N 10km 6.4
Fault of Djebel
Youcef Reverse 26km
NE-SW to
ENE-WSW 60-70°S 10km 6.5
Fault of north
Djemila Reverse 45km NE-SW 50°NW 15km 7
Fault of Jijel Sea Reverse 100km NE-SW 40°NW 18km 7.4
Fault of Annaba
Sea Reverse 80km E-W 40°S 18km 7.3
II.5.3 Macroseismic intensity
As already stated, the macroseismic intensity in the northeast of Algeria varies between low (such as Annaba city), and moderate intensity for the case of Skikda, Guelma and Constantine city. Regarding the two latter cities, the research outcomes proved that the middle of both the cities known by a very important seismicity wherein the macroseismic intensity is assumed to be very significant I ≥ VII according to EMS-98 scale. This fact is due to the high concentration of the active faults which are already listed in the table above. Fig. II.8 illustrates the maximum intensities of the north-eastern of Algeria carried out by CGS (2011).
24
Fig. II.8: Maximum intensities of the north-easthern of Algeria (CGS 2011)
II.6 Seismic activity of Annaba city
II.6.1 Seismic events
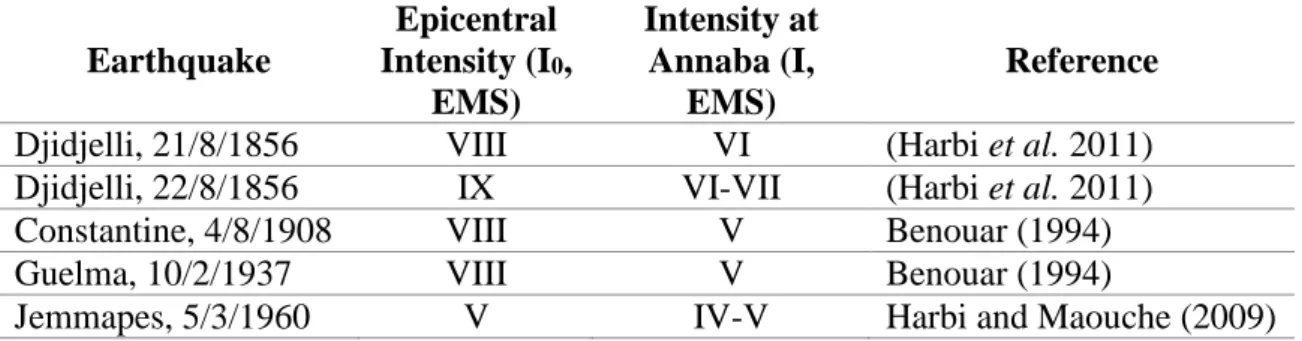
Annaba, the fourth important city in Algeria, belongs to a seismogenic zone is known by its low to moderate active seismicity (Mourabit et al. 2014). The only seismic event strongly felt in the region, on a quite large area of perceptibility, is the offshore earthquake of Herbillon, which occurred on September 19, 1935 (Harbi and Maouche 2009). Little is known about the tectonic activity of the region with regard to the activity of Eastern Algeria (Kherroubi et al. 2009). Annaba is close to two active seismogenic zones Guelma and Constantine (Harbi et al. 2003, Mourabit et al. 2014). As already mentioned, both zones experienced damaging earthquakes (Benouar 1994, Harbi et al. 2010). Furthermore, several seismic events that occurred in the surrounding region may have strong to damaging effects on Annaba city, as can be concluded from the analysis of Table II.3, where the epicentral intensity of the most important historical earthquakes felt in this area and their effect registered in Annaba city in term of intensity according to the European Macroseismic Scale (Grünthal 1998) is presented. It is worthwhile noting that two of the most destructive events of Eastern Algeria that occurred at Djidjelli (Jijel now) on 21 and 22 August 1856 and triggered tsunamis had effects on Annaba city. The shock of 21 August caused some cracks to the theatre and many private dwellings at Bône (Annaba now); the sea had withdrawn a meter, and it was reported that the "Islands of three brothers" located offshore Bône had almost disappeared under the waves (see (Harbi et
al. 2011) for more details). During the 22 August event the damage in Annaba was limited to
the collapse of a hotel, some chimneys and cracks in some dwellings and the sea rose by one meter and flooded during twelve hours a part of the "Champs de manœuvre" (Harbi et al. 2011). All these factors have to be taken into account for a better seismic hazard assessment and a reliable mitigation of seismic risk in the region.
25
Table II.3: List of the earthquakes that have strong to damaging effects at Annaba Earthquake Epicentral Intensity (I0, EMS) Intensity at Annaba (I, EMS) Reference
Djidjelli, 21/8/1856 VIII VI (Harbi et al. 2011)
Djidjelli, 22/8/1856 IX VI-VII (Harbi et al. 2011)
Constantine, 4/8/1908 VIII V Benouar (1994)
Guelma, 10/2/1937 VIII V Benouar (1994)
Jemmapes, 5/3/1960 V IV-V Harbi and Maouche (2009)
II.6.2 Active faults
The detailed morphology of the margin in the region of Skikda and Annaba is known from the seismic and bathymetric data of Maradja2 companion (2005) whose coverage was limited to the continental slope and the deep basin (Kherroubi et al. 2009). In term of active faults (Fig. 1), three segments of a thrust fault with similar length prevail, S1 (30 km length), S2 (30 km length) and S3 (20 km length) (CGS 2011, Kherroubi et al. 2009). Based on the scaling relations between the surface displacements and the length (Bonilla et al. 1984; Wells and Coppersmith 1994; Leonard 2010), if these submarine fault segments rupture during a single event, a magnitude of Mw = 7.5 is expected. This value may be even higher if the segment S4 is also
considered (Kherroubi et al. 2009) (Fig. II.9).
Fig. II.9: Active faults of Annaba Sea (Kherroubi et al. 2009)
II.6.3 Macroseismic intensity
It is worth mentioning that the largest event reported of intensity X, occurred in 1722 north of Seraidi (Annaba city) (Harbi 2006) remains uncertain in fact that damages reported by historical documents are limited. Furthermore, most events located offshore suffer possible large uncertainties (Kherroubi et al. 2009). In this context, in addition to the lack of information about the consequences experienced on the buildings stock of Annaba city, all these factors lead
26
to an underestimation of the peak intensity on the whole area (CGS 2011), and therefore, a moderate to low seismic hazard is assigned. Indeed, the deductions of Table II.3 is supported by Yelles-Chaouche et al. (2006), who assumed that the intensity allocated generally is VI (Fig. II.8) and does not exceed VII.
II.7 Seismic hazard assessment of Annaba city
II.7.1 Probabilistic estimation
According to the framework of Probabilistic Seismic Hazard Assessment (PSHA) of Annaba region performed by the National Earthquake Engineering Centre (CGS 2011), the mapped amount is the average value of the amplitude of ground motion (Peak Ground Acceleration) associated with three return periods 100, 200, and 500 years (CGS 2011) (Fig. II.10). In addition to the historical seismicity data of Annaba region, this study took also into account the seismological, the geophysical and the geological context. As already mentioned, this mode of representation of the seismic hazard by the probabilistic approach is widely responding across the world. The results of this seismic hazard estimation (Fig. II.10) show that the maximum expected acceleration values for the whole study area of Annaba city varies between 0.14g and 0.28g for return periods of 100 and 500 years respectively (CGS 2011).
The plotted map (Fig. II.10) represent the iso-acceleration or acceleration curves (CGS 2011) that count the likely level of activity in Annaba region which is usually the basic tool for seismic zoning, seismic regulations, seismic microzonation and an essential input for the engineer in the seismic design of structures.
Fig. II.10: Seismic hazard maps of Annaba city in terms of PGA for 100, 200 and 500 return periods (CGS 2011).
II.7.2 Deterministic estimation
For the Deterministic Seismic Hazard Assessment (DSHA) of Annaba city, the ELER (Earthquake Loss Estimation Routine) v.3.0 software intended for rapid estimation of earthquake shaking and losses in the Euro-Mediterranean region, which has been developed in the framework of EU FP-6 NERIES (Network of Research Infrastructures for European Seismology) Project (Hancilar et al. 2010) is used. Without going to details, as in the USGS ShakeMap, the ELER Earthquake Hazard Assessment (EHA) module uses earthquake epicenter, magnitude and if available fault information as input. To generate ground shaking intensity maps and maps with parameters of PGA, PGV, Sa and Sd at 0.2, 1.0 and 3.0s, the
27
Seismic hazard is deterministically computed based on empirical ground motion and/or macroseismic intensity prediction models.
Fig. II.11 presents the DSHA for Annaba city considering the active sea faults (Fig. II.9) and the significant seismic event located close to the old town (area under study). The results are shown in terms of peak ground acceleration (PGA).
Fig. II.11: DSHA for Annaba city
In the next step, and based on the same previous estimation of the seismic hazard (Fig. II.11), additionally we took into consideration the active faults that located in Guelma city. In the same way, Fig. II.12 illustrates the results in terms of peak ground acceleration (PGA) for the hole deemed region.
Fig. II.12: DSHA for Annaba region
Compared by the PSHA of CGS, it is clearly noted that more accounting huge number of seismic events and the possible existence of different active faults surrounding the target area, accurate and reliable outcomes can be obtained. Therefore, this fact proves the reliability of the probabilistic seismic hazard assessment principle (PSHA).