APPLICATION OF
ROCK ENGINEERING SYSTEMS TO
LARGE-SCALE CONFINED DESTRESS BLASTS
IN UNDERGROUND MINE PILLARS
Thèse présentée
à la Faculté des études supérieures de l’Université Laval dans le cadre du programme de doctorat en Génie minier pour l’obtention du grade de Philosophiæ Doctor (Ph.D.)
DÉPARTEMENT DE GÉNIE DES MINES, DE LA MÉTALLURGIE ET DES MATÉRIAUX
FACULTÉ DES SCIENCES ET DE GÉNIE UNIVERSITÉ LAVAL
QUÉBEC
2005
RÉSUMÉ
Cette thèse décrit le développement d’une nouvelle méthodologie qui quantifie les chances de succès d’un tir confiné à grande échelle de relâchement des contraintes dans un pilier de mine souterraine, pour une masse rocheuse et un régime de contraintes donnés.
L’approche est basée sur huit paramètres qui sont considérés comme contrôlant ultimement le processus, et dont l’influence et les interactions ont été quantifiées dans un premier temps avec la méthode des Systèmes d’ingénierie du roc (“Rock Engineering Systems”). Ces interactions et degrés d’influence ont ensuite été utilisés pour élaborer la nouvelle méthodologie, qui est basée sur un nouveau paramètre appelé l’Indice de relâchement, qui peut être ‘Faible’, ‘Moyen’, ‘Bon’ ou ‘Excellent’.
Il est conclu que cette méthodologie a une valeur pratique élevée de par sa capacité à concevoir adéquatement un tir confiné à grande échelle de relâchement des contraintes dans un pilier de mine, en prenant simplement des mesures qui résultent en une augmentation de l’Indice de relâchement et, donc, des chances de succès du tir.
SOMMAIRE
L’objectif de cette thèse était de développer une nouvelle méthodologie pour quantifier les chances de succès d’un tir confiné à grande échelle de relâchement des contraintes dans un pilier de mine souterraine, pour une masse rocheuse et un régime de contraintes donnés. Huit paramètres ont été retenus comme contrôlant ultimement le processus, les quatre premiers considérant le massif rocheux et les quatre autres divers aspects du sautage. Étant donné la quantité limitée de travaux accomplis dans ce domaine, il a été nécessaire de déterminer en premier lieu comment et dans quelle mesure ces paramètres interactent, et lesquels dominent le processus. L’approche des Systèmes d’ingénierie du roc (“Rock Engineering Systems”, ou RES), une technique matricielle qui permet de quantifier systématiquement l’interaction entre chaque paire de paramètres identifiés comme jouant un rôle dans un processus d’ingénierie, a été utilisée pour aborder cette question. Ces interactions et degrés d’influence ont ensuite été appliqués à l’élaboration de la nouvelle méthodologie, basée sur un nouveau paramètre appelé l’Indice de relâchement.
Cette approche consiste à quantifier dans un premier temps la mesure dans laquelle chacun des huit paramètres est favorable à la réussite d’un tir de relâchement des contraintes. Basé sur un éventail de seuils développé dans ces travaux, un simple indice de 0 (non favorable), 1 (relativement favorable) ou 2 (favorable) est assigné, qui est ensuite multiplié par l’influence qu’a le paramètre sur l’ensemble du système, telle que quantifiée par la méthode des RES. Cela donne un score pour chaque paramètre. Les scores de tous les paramètres sont ensuite additionnés, puis divisés par le score total maximum possible, ce qui donne un score total normalisé à partir duquel un Indice de relâchement de ‘Faible’, ‘Moyen’, ‘Bon’ ou ‘Excellent’ est obtenu. La rétro-analyse de deux récentes études de cas bien documentées a démontré que cette approche est valide et peut indiquer de manière fiable si une situation de hautes contraintes est susceptible d’être relaxée efficacement par un tir
confiné à grande échelle de relâchement des contraintes, et, le cas échéant, si la conception du tir est adéquate à cette fin.
Il est conclu que cette méthodologie a une valeur pratique élevée de par sa capacité à concevoir adéquatement un tir confiné à grande échelle de relâchement des contraintes dans un pilier de mine, en prenant simplement des mesures qui résultent en une augmentation de l’Indice de relâchement et, donc, des chances de succès du tir. Ces mesures n’incluent pas seulement l’optimisation des paramètres de tir, mais également le choix du moment propice auquel le tir devrait être tenté. Des modifications successives peuvent être apportées et l’Indice de relâchement réévalué, ce qui permet au design d’être éventuellement optimisé, de manière itérative.
SUMMARY
The objective of this thesis was to develop a novel methodology to quantify the likelihood of a large-scale confined destress blast in an underground mine pillar being successful, for a given rock mass condition and stress regime. Eight parameters were argued to ultimately control the process, the first four being related to the rock in which the destress blast is attempted, the last four to blasting issues. Given the limited amount of background work completed in this field, it was necessary to first determine how and to which extent these parameters interact, and which ones dominate the process. The Rock Engineering Systems (RES) approach, a matrix-based technique that allows to quantify in a systematic manner the interaction between each pair of parameters known to play a role in an engineering process, was applied to address this issue. These interactions and degrees of influence were then applied to derive the new methodology, based upon a new parameter named the “Destressability Index”.
The Destressability Index approach consists in first quantifying how conducive each of the eight parameters is to a successful choked destress blast. Based upon thresholds developed in this work, a simple rating of 0 (not conducive), 1 (somewhat conducive) or 2 (conducive) is first assigned, which is then multiplied by the influence of the parameter on the whole system, as quantified with the RES methodology. This provides a score for each parameter. The scores from all the parameters are then added and divided by the maximum possible total arithmetical score in order to produce a normalised total score from which a ‘Low’, ‘Medium’, ‘Good’, or ‘Excellent’ Destressability Index can be obtained. The back-analysis of two recent well-documented case studies have demonstrated that this approach is sound and can reliably indicate whether a high stress situation is conducive to being destressed by means of a large-scale confined destress blast, and, if so, whether the blast design itself is appropriate to achieve this goal.
It is argued that this methodology has a high practical value by allowing one to adequately design a large-scale confined panel destress blast by simply taking steps that result in an increase in the Destressability Index and, hence, in the chance of success. Such steps include not only optimising the blasting parameters, but also choosing when in the mining sequence the blast should be implemented. Successive changes can be proposed and the Destressability Index re-assessed, which allows the design to be eventually optimised in an iterative manner.
ACKNOWLEDGEMENTS
A number of individuals and organisations must be thanked for the support they generously provided throughout the completion of this work. First and foremost, the guidance and support offered by Professor John Hadjigeorgiou must be acknowledged. He made it possible for the author to pursue doctorate studies on a part-time basis while working full-time on demanding jobs at Brunswick Mine in Bathurst, then at Itasca Consulting Canada, Inc. in Sudbury. Many thanks, John, for a wisely established progress strategy, well-planned milestones, your patient guidance and the countless suggestions you provided over the six years it took to complete this work. The help of Professor Jacek Paraszczak with many of the administrative issues has also greatly facilitated this project, and is thankfully acknowledged.
Invaluable technical discussions were held during the preparation of this thesis with a number of outstanding engineers who provided much appreciated input, suggestions and help. Among them are, alphabetically, Dr. Richard Brummer, Professor John Hadjigeorgiou, Dr. Qian (Ken) Liu, Mrs. Anneta Sampson-Forsythe, Mr. Brad Simser and Dr. Graham Swan. The feedback provided by Professor John Hudson of Imperial College on the application of the Rock Engineering Systems methodology to large-scale confined panel destress blasts is also greatly appreciated.
Thanks must also be directed at Noranda, Inc., Falconbridge, Ltd. and Itasca Consulting Canada, Inc. More specifically to the Brunswick Mine management for their support during the early stages of this project in this note, the author feels particularly indebted to Mr. Jean Desrosiers, Mr. Bill Rogers and Mr. Glen Crowther. Many thanks also to the Fraser Mine management for allowing unpublished data from the December 2001 destress blast in the A5-Right pillar to be used in a case history in this thesis. The support and
encouragement of the Itasca Consulting Canada, Inc. management during the redaction of this thesis is also gracefully acknowledged.
Finally, the author would like to express his appreciation to Dr. Cameron McKenzie, Dr. John Heilig and Mr. David Sprott who made him realise during field work campaigns in the early 1990’s how much enjoyment rock engineering can provide. Last but not least, the author is grateful to his family for putting up with the great deal of supplemental work the completion of this degree has meant.
Sunday 6 March 2005 Sudbury, Ontario, Canada.
TABLE OF CONTENTS Page RÉSUMÉ ... I SOMMAIRE ... II SUMMARY ... IV ACKNOWLEDGEMENTS ... VI TABLE OF CONTENTS ... VIII LIST OF FIGURES ... XVI LIST OF TABLES ... XXIV LIST OF FORMULAE AND EQUATIONS ... XXVIII LIST OF SYMBOLS ... XXX
1. INTRODUCTION ... 1
2. VIOLENT ROCK FAILURE CONSIDERATIONS ... 7
2.1. STRESS ISSUES ... 8
2.1.1. General stress considerations ... 8
2.1.2. Variation of stress with depth ... 10
2.1.3. In situ vs. mining-induced stresses ... 12
2.2. GEOMECHANICAL CONDITIONS FOR THE VIOLENT FAILURE OF ROCK ... 14
2.2.1. Stress conditions required for violent failure ... 15
2.2.2. Rock mass properties required for violent failure ... 19
2.2.3. Loading system characteristics required for violent failure ... 22
2.2.4. Idealised energy considerations ... 26
2.3. THE VARIOUS TYPES OF ROCKBURSTS ... 29
2.3.1. Strain bursts ... 29
2.3.3. Fault-slip bursts ... 30
2.4. METHODOLOGIES TO ASSESS THE ROCKBURST POTENTIAL OF ROCK ... 31
2.5. GEOMECHANICS-BASED MEASURES TO ALLEVIATE VIOLENT ROCK MASS FAILURE .. 32
3. DESTRESS BLASTING MECHANISMS ... 36
3.1. GENERAL DEFINITION OF DESTRESS BLASTING ... 37
3.2. THE MECHANISMS OF DESTRESS BLASTING ... 37
3.2.1. Destress blasting mechanism as per Crouch ... 38
3.2.2. Destress blasting mechanism as per Hedley ... 40
3.2.3. Energy considerations ... 42
3.2.4. Additional comments on the destress blasting mechanisms ... 46
3.3. PERFORMANCE CRITERIA FOR DESTRESS BLASTING ... 47
4. DESTRESS BLASTING TYPES AND HISTORICAL PRACTICES ... 51
4.1. THE VARIOUS TYPES OF DESTRESS BLASTING ... 53
4.1.1. Destress blasting in development headings ... 54
4.1.2. Preconditioning ... 54
4.1.3. Destress blasting of remnant pillars ... 56
4.1.4. Destress blasting of active faults ... 58
4.2. SELECTED CASE HISTORIES ... 59
5. POTENTIAL DESTRESS BLAST DESIGN METHODOLOGIES ... 69
5.1. CURRENT CHOCKED DESTRESS BLAST DESIGN PHILOSOPHIES ... 70
5.2. CURRENT BLAST ENGINEERING APPROACHES AND THEIR APPLICABILITY TO DESTRESS BLASTING ... 72
5.2.1. Rules-of-thumb ... 72
5.2.2. Empirical techniques ... 73
5.2.3. Analytical techniques ... 79
5.2.5. Hybrid methods ... 83
5.3. GENERAL COMMENTS ON THE CURRENT DESTRESS BLAST DESIGN METHODOLOGIES ... 83
6. ROCK ENGINEERING SYSTEMS AND THEIR APPLICATION TO BLASTING 87 6.1. GENERAL DESCRIPTION OF THE ROCK ENGINEERING SYSTEMS APPROACH ... 88
6.2. APPLICATION OF THE RES APPROACH TO BLASTING THE WORK OF LATHAM & LU ... 93
7. LARGE-SCALE CONFINED PILLAR DESTRESS BLASTING AND ROCK ENGINEERING SYSTEMS ... 101
7.1. ADVANTAGES OF THE APPLICATION OF THE RES METHODOLOGY ... 102
7.2. PARAMETERS THAT CONTROL VIOLENT ROCK MASS FAILURE UNDER HIGH STRESS CONDITIONS ... 103
7.3. PARAMETERS PLAYING A ROLE IN DESTRESS BLASTING ... 105
7.3.1. Rock- and stress-related parameters ... 105
7.3.1.1. Stiffness, strength and brittleness ... 106
7.3.1.2. Degree of fracturing ... 106
7.3.1.3. Proximity to static failure... 107
7.3.1.4. Additional comments on the rock-related parameters ... 108
7.3.2. Blasting-related parameters ... 108
7.3.2.1. Orientation of the destress blast ... 110
7.3.2.2. Width of the destress blast ... 111
7.3.2.3. Amount of explosive energy ... 112
7.3.2.4. Confinement of the explosive charges ... 112
7.4. ROCK ENGINEERING SYSTEMS AND LARGE-SCALE CONFINED PILLAR DESTRESS BLASTING ... 114
7.4.1. Global interaction between each pair of parameters ... 116
7.4.1.1. Effects of P1 the stiffness of the rock, on all the other parameters ... 118
7.4.1.3. Effects of P3 the degree of fracturing of the rock mass, on all the other
parameters ... 120
7.4.1.4. Effects of P4 the proximity to failure of the rock, on all the other parameters ... 122
7.4.1.5. Effects of P5 the orientation of the destress blast, on all the other parameters ... 123
7.4.1.6. Effects of P6 the width of the destress blast, on all the other parameters ... 126
7.4.1.7. Effects of P7 the unit explosive energy in the destress blast, on all the other parameters ... 128
7.4.1.8. Effects of P8 the confinement of the explosive charges, on all the other parameters ... 129
7.4.1.9. Effects of P9 the results of the destress blast, on all the other parameters ... 130
7.4.2. Properties that describe the RES interaction matrix parameters ... 131
7.4.2.1. Intact rock material scale vs. rock mass scale ... 132
7.4.2.2. Parameter P1 stiffness of the rock ... 132
7.4.2.3. Parameter P2 brittleness of the rock ... 134
7.4.2.4. Parameter P3 degree of fracturing of the rock mass ... 136
7.4.2.5. Parameter P4 proximity to failure of the rock mass ... 137
7.4.2.6. Parameter P5 orientation of the destress blast ... 139
7.4.2.7. Parameter P6 width of the destress blast ... 139
7.4.2.8. Parameter P7 unit explosive energy ... 139
7.4.2.9. Parameter P8 confinement of the explosive charges... 139
7.4.2.10. Parameter P9 result of the destress blast ... 140
7.4.2.11. Summary of the properties retained to represent the parameters of the RES matrix at the intact rock material and the rock mass scales ... 140
7.4.3. Coding of the RES interaction matrices at the intact rock material and the rock mass scales ... 142
8. DESTRESSABILITY INDEX FOR LARGE-SCALE CONFINED DESTRESS
BLASTS IN UNDERGROUND MINE PILLARS ... 150
8.1. GENERAL DESCRIPTION OF THE DESTRESSABILITY INDEX METHODOLOGY ... 152
8.2. ASSESSMENT OF THE DESTRESSABILITY INDEX AT THE INTACT ROCK MATERIAL SCALE ... 155
8.2.1. Ranges of property values for the rating of each parameter and scoring system ... 155
8.2.2. Calculation example ... 160
8.2.2.1. Step I Calculation of the required design values ... 160
8.2.2.2. Step II Rating of the parameters ... 161
8.2.2.3. Step III Assessment of the Destressability Index value ... 162
8.3. ASSESSMENT OF THE DESTRESSABILITY INDEX AT THE ROCK MASS SCALE ... 163
8.3.1. Ranges of property values for the rating of each parameter and scoring system ... 163
8.3.2. Calculation example ... 168
8.3.2.1. Step I Calculation of the required design values ... 168
8.3.2.2. Step II Rating of the parameters ... 170
8.3.2.3. Step III Assessment of the Destressability Index value ... 171
9. FIRST CASE STUDY DESTRESS BLAST IN THE 29-9 PILLAR AT BRUNSWICK MINE ... 173
9.1. INTRODUCTION AND BACKGROUND ... 175
9.2. DESTRESS BLAST SITE AND ASSOCIATED CONSTRAINTS ... 178
9.3. DESIGN OF THE DESTRESS BLAST ... 180
9.4. INSTRUMENTATION USED ... 191
9.4.1. Mine-wide seismic monitoring system ... 192
9.4.2. Vibrating wire stress cells ... 192
9.4.3. Multi-point extensometers ... 194
9.4.5. Two-dimensional seismic tomographic imaging ... 196
9.4.6. High frequency geophones ... 198
9.5. RESULTS OF THE DESTRESS BLAST ... 199
9.5.1. Field performance of the destress blast ... 199
9.5.2. Visual post-blast assessments ... 201
9.5.3. Seismic response to the destress blast ... 203
9.5.4. Borehole camera observations ... 205
9.5.5. Results from the stress cells ... 206
9.5.6. Results from the multi-point extensometers ... 209
9.5.7. Results from the cross-hole seismic surveys ... 211
9.5.8. General conclusions from the observations and measurements ... 217
9.6. DESTRESSABILITY INDEX ASSESSMENT... 218
9.6.1. At the scale of the intact rock material ... 218
9.6.1.1. Step I Calculation of the required design values ... 220
9.6.1.2. Step II Rating of the parameters ... 220
9.6.1.3. Step III Assessment of the Destressability Index ... 221
9.6.2. At the scale of the rock mass ... 222
9.6.2.1. Step I Calculation of the required design values ... 223
9.6.2.2. Step II Rating of the parameters ... 224
9.6.2.3. Step III Assessment of the Destressability Index ... 225
10. SECOND CASE STUDY DESTRESS BLAST IN THE 42-1-080 PILLAR AT THE FRASER COPPER MINE ... 227
10.1. INTRODUCTION AND BACKGROUND ... 229
10.2. DESTRESS BLAST SITE AND ASSOCIATED CONSTRAINTS ... 232
10.3. DESIGN OF THE DESTRESS BLAST ... 233
10.4. INSTRUMENTATION USED ... 244
10.4.2. Multi-point extensometers ... 246
10.4.3. Strain gauge in the shotcrete pillar ... 248
10.4.4. High frequency geophones ... 248
10.5. RESULTS OF THE DESTRESS BLAST ... 250
10.5.1. Field performance of the destress blast ... 250
10.5.2. Visual post-blast assessments ... 254
10.5.3. Seismic reaction to the destress blast ... 255
10.5.4. Additional observations ... 259
10.5.5. Results from the stress cells ... 260
10.5.6. Results from the multi-point extensometers ... 263
10.5.7. Results from the strain gauge in the instrumented shotcrete pillar ... 265
10.5.8. General conclusions from the observations and measurements ... 265
10.6. DESTRESSABILITY INDEX ASSESSMENT... 265
10.6.1. At the scale of the intact rock material ... 266
10.6.1.1. Step I Calculation of the required design values ... 268
10.6.1.2. Step II Rating of the parameters ... 268
10.6.1.3. Step III Assessment of the Destressability Index ... 269
10.6.2. At the scale of the rock mass ... 270
10.6.2.1. Step I Calculation of the required design values ... 271
10.6.2.2. Step II Rating of the parameters ... 271
10.6.2.3. Step III Assessment of the Destressability Index ... 272
11. CONCLUDING REMARKS AND FUTURE WORK ... 275
11.1. SUMMARY OF THE WORK AND ESSENTIAL PHASES OF THE RESEARCH ... 275
11.2. GENERAL CONCLUSIONS AND INNOVATIVE CONTRIBUTION TO KNOWLEDGE ... 279
11.3. FURTHER PERSPECTIVES AND POSSIBLE FUTURE WORK ... 282
11.3.1. Parameters of the RES interaction matrix ... 283
11.3.3. Properties chosen to represent the system parameters ... 283
11.3.4. Rating of the parameters ... 285
11.3.5. Evaluation of the destressability rating ... 285
11.3.6. Parametric analysis ... 286
11.3.7. Other further perspectives and potential future work... 286
APPENDICES ... 288
A. METHODOLOGIES AT THE INTACT ROCK MATERIAL SCALE FOR THE ASSESSMENT OF THE ROCKBURST POTENTIAL ... 289
A.1. The Bursting Liability Index ... 289
A.2. The Brittleness Index Modified (BIM) ... 290
A.3. The Decrease Modulus Index ... 291
A.4. The fragility of the intact rock ... 292
A.5. The Burst Efficiency Ratio ... 292
B. METHODOLOGIES AT THE ROCK MASS SCALE FOR THE ASSESSMENT OF THE ROCKBURST POTENTIAL ... 294
B.1. Activity Index ... 294
B.2. Seismic techniques ... 295
B.3. Microseismic monitoring ... 298
B.3.1.Magnitudes, and distribution in space and time ... 298
B.3.2.Scale invariance and fractal-based approaches ... 299
B.3.3.Gutenberg-Richter plots ... 301
B.3.4.Seismic source parameter analyses ... 303
B.4. Energy-based approach ... 308
B.5. ERR Energy Release Rate ... 311
B.6. ESS Excess Shear Stress ... 312
B.7. ERP Evaluation of Rockburst Potential ... 313
C. SELECTED CASE HISTORIES OF DESTRESS BLASTING... 316 C.1. South Africa ... 316 C.2. United States ... 320 C.3. Canada ... 333 C.4. Australia ... 346 C.5. Sweden ... 349 C.6. Germany ... 351 C.7. Poland ... 355
D. THE ROCK QUALITY DESIGNATION INDEX (RQD) ... 358
E. THE ROCK MASS RATING SYSTEM (RMR) ... 360
F. THE GEOLOGICAL STRENGTH INDEX (GSI) ... 364
G. THE ROCK TUNNELLING QUALITY INDEX (Q RATING) ... 370
G.1. Standard rock tunnelling Quality index, Q ... 370
G.2. Modified rock tunnelling Quality index, Q’ ... 377
H. DESTRESSABILITY INDEX DEVELOPMENT SPREADSHEETS ... 379
REFERENCES ... 384
INDEX OF TOPICS ... 406
INDEX OF REFERENCED AUTHORS ... 410
LIST OF FIGURES Page Figure 1. (a) Generalised stress tensor; and, (b) principal stress tensor. ... 9
Figure 2. (a) General reference system; and, (b) rotated reference system that corresponds to the major (1 ), intermediate (2 ) and minor (3 ) principal stress components. ... 10
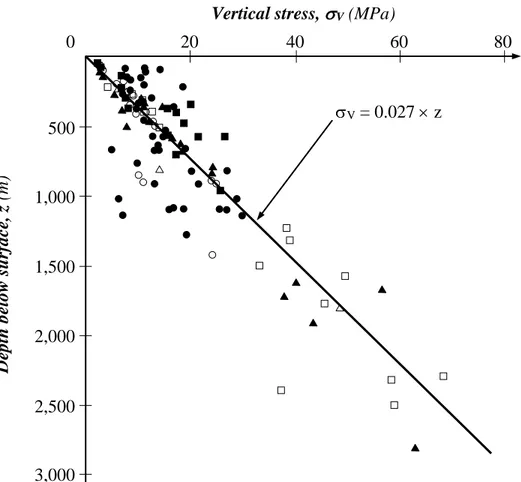
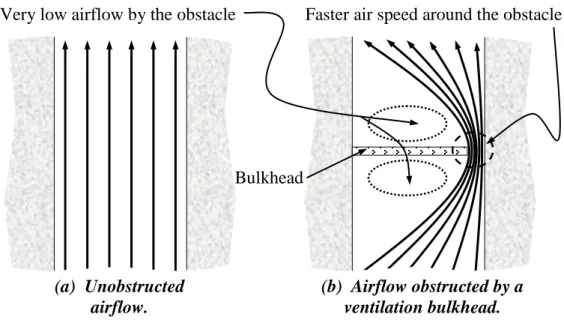
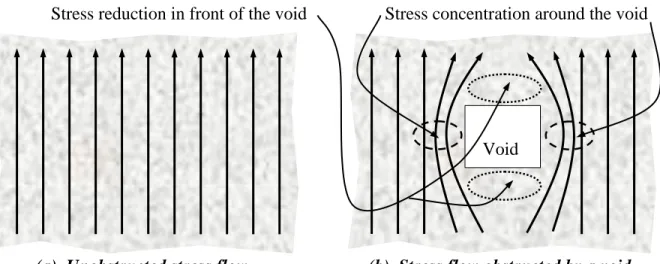
Figure 3. Vertical stress measurements from mining and civil engineering projects around the world. (After Hoek et al., 1995.) ... 11 Figure 4. Conceptual sketch illustrating how an obstacle alters the airflow in a wind tunnel.
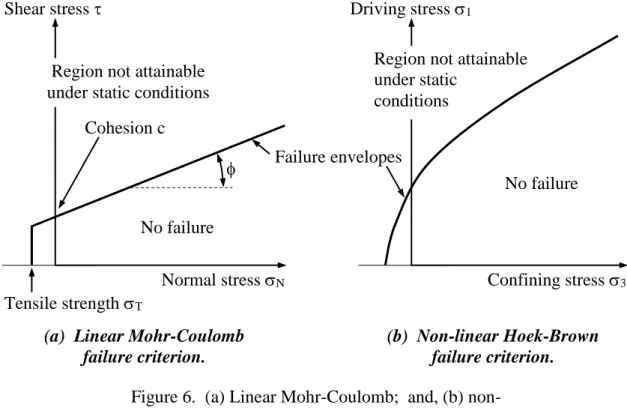
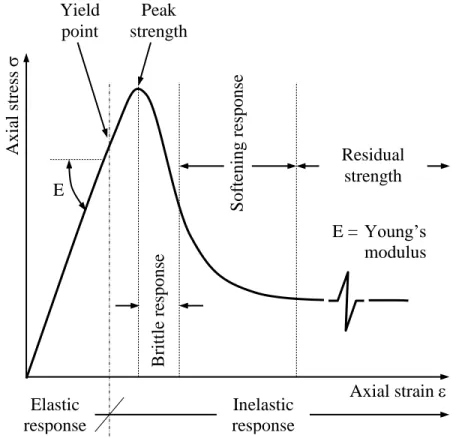
... 13 Figure 5. Conceptual sketch illustrating how an excavation alters the stress flow inside a solid body. ... 14 Figure 6. (a) Linear Mohr-Coulomb; and, (b) non-linear Hoek-Brown failure criteria for rock. ... 16 Figure 7. Schematic illustration in the (1 3 ) space with a Mohr-Coulomb failure criterion of various possible stress paths to failure, and their consequences on the type of failure to expect. (Adapted from Andrieux et. al., 2003.) ... 17 Figure 8. Idealised characteristic compressive stress-strain curve for a typical
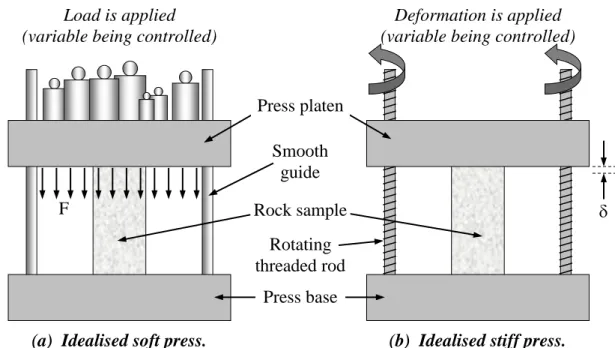
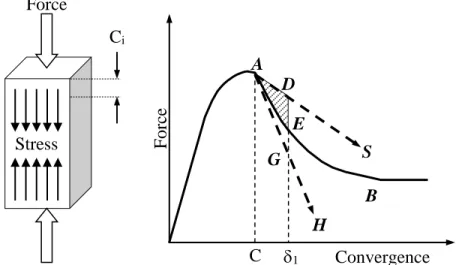
strain-softening hard rock at a given (low) level of confinement. ... 20 Figure 9. Failure and residual envelopes in the ( N ) space that describe the strength of the intact and failed material under various levels of confinement. ... 22 Figure 10. (a) Idealised soft press; and, (b) idealised stiff press, showing which variable is controlled in each case. ... 23 Figure 11. Brittle rock specimen deformation in a soft vs. stiff testing machine. (Adapted from Blake et al., 1998.) ... 24 Figure 12. Idealised load-deformation behaviour of a pillar under uniaxial compressive load. (After Simon et al., 1998.) ... 26 Figure 13. Schematic side view of a conceptual drift illustrating the mechanism of strain bursting. ... 29 Figure 14. Schematic side view of a conceptual pillar illustrating the mechanism of pillar bursting. ... 30 Figure 15. Schematic view of a conceptual advancing mining front illustrating the mechanism of fault-slip type bursting. ... 31 Figure 16. The possible outcomes of a destress blast. (Adapted from Crouch, 1974.) ... 39 Figure 17. Stress-displacement history of a pillar during a destress blast. (After Hedley, 1992.) ... 41 Figure 18. Energy components involved during a pillar destress blast. (Adapted from Hedley, 1992.)... 44 Figure 19. Difference in the load bearing capacity of a blasted rock mass that is (a) undisturbed vs. (b) disturbed. (Adapted from Andrieux et al., 2003.)... 47 Figure 20. Schematic representation of the behaviour of the resistivity, sonic velocity, permeability and acoustic emission as a function of axial deformation in an axially loaded intact sample of brittle hard rock. (After Bieniawski, 1967.) ... 48 Figure 21. Conceptual plan views (not to scale) showing layouts for (a) face-parallel; and, (b) face-perpendicular preconditioning in a South African longwall mining sequence. (Adapted from Toper, 2002.) ... 56 Figure 22. The effect of an external destressing slot on a highly stressed ore block. ... 57
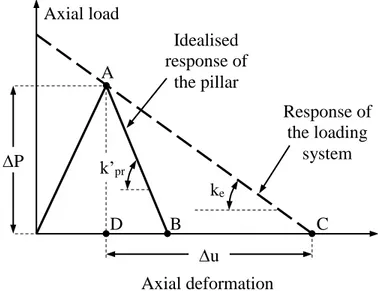
Figure 23. Conceptual representation of the outside zones of influence that can be considered around a large-scale choked pillar destress blast. ... 65 Figure 24. Examples of various destress blast situations and the corresponding outside zones of influence considered. (Schematic plan views, not to scale.) ... 66 Figure 25. Comparison of the energy levels implemented in various documented destress blasts. (After Brummer, 2001.) ... 75 Figure 26. Schematic isometric view (not to scale) showing the external lateral zones of influence considered for a regularly shaped destress blast. ... 76 Figure 27. The basic principle of the interaction matrix. (Adapted from Hudson, 1992.) . 89 Figure 28. Four by four interaction matrix for a construction project in hard rock, with four leading diagonal terms: rock structure, rock stress, water flow and construction. (After Hudson, 1992.) ... 90 Figure 29. Coding of the interaction matrix, and cause and effect coordinates. (Adapted from Latham & Lu, 1999.)... 91 Figure 30. Generic example of a CE plot. (Adapted from Latham & Lu, 1999.) ... 92 Figure 31. The blasting process in rock. (Adapted from Hudson & Harrison, 1997.) ... 94 Figure 32. The change of the rock mass block size distribution prior to (“Stereoblock” curve), and after (“Split” and “CANMET”) blasting. (After Grenon et al., 1998.) .... 95 Figure 33. The concept of blastability. (After Latham & Lu, 1999.) ... 95 Figure 34. Results of the blastability interaction matrix coding. (After Latham & Lu, 1999.) ... 98 Figure 35. The cause-effect plot for the interaction matrix-coding example described by Latham & Lu (1999) and shown in Figure 34. ... 99 Figure 36. The concept of distance away from the failure envelope. (After Andrieux et al., 2004.) ... 107 Figure 37. The theoretical potential of a diagonal blasting sequence to promote shear fractures in the destressed zone. (Adapted from Andrieux & Brummer, 2002.) ... 109 Figure 38. Schematic illustration of the amount of stress blocking effect achieved as a function of the blast orientation with respect to 1 . (After Andrieux et al., 2004.) .. 111 Figure 39. Schematic cross-section through a conceptual destress blast showing the concept of disturbance width. (Adapted from Andrieux et al., 2004.) ... 112 Figure 40. Amount of useful work performed by the detonation gases in the case of early (left hand side) and late (right hand side) venting. (After Andrieux et al., 2004.) .... 113 Figure 41. Initial interaction matrix constructed for large-scale confined panel destress blasting. ... 115 Figure 42. Final interaction matrix constructed for large-scale confined panel destress blasting. ... 116 Figure 43. General qualitative interactions between each pair of parameters in the
large-scale confined panel destress blasting interaction matrix. ... 117 Figure 44. Conceptual representation of the failure envelopes associated with various degrees of rock mass fracturing, and how they change the proximity to failure for a given stress state. ... 121
Figure 45. Schematic representation showing how the angle representing the orientation of the destress blast is defined. ... 124 Figure 46. Schematic view showing how the effective length of the destress blast increases as the orientation of the destress blast becomes more perpendicular to the direction of the targeted stress component. ... 125 Figure 47. Schematic views showing how a wider destress blast (b) results in a smaller angle of incidence being required to achieve the same effective destressed width. ... 127 Figure 48. Iteration example for the coding of the interaction matrix at the intact rock material scale, early in the process. ... 144 Figure 49. Coding of the interaction matrix for large-scale choked pillar destress blasts.
Case where the rock properties are considered at the intact rock material scale. ... 145 Figure 50. Coding of the interaction matrix for large-scale choked pillar destress blasts.
Case where the rock properties are considered at the rock mass scale. ... 145 Figure 51. CE plot for the interaction matrix for large-scale choked panel destress blasting. Case where the rock properties are considered at the intact rock material scale. ... 146 Figure 52. CE plot for the interaction matrix for large-scale choked panel destress blasting. Case where the rock properties are considered at the rock mass scale. ... 146 Figure 53. Schematic isometric illustration (not to scale) of the various properties and quantities shown in Table 15. ... 159 Figure 54. Plan view of the south end of the 1000 Sill level showing the various mining zones. (After Andrieux et al., 2000.) ... 176 Figure 55. Plan view of the south end of 1000 Sill showing the seismic activity recorded in this region between 28 April 1999 and 28 October 1999 within 30m of the level. .... 177 Figure 56. Schematic longitudinal section (not to scale) of the WOZ lens looking west, showing the 29-9 Pillar where the destress blast took place. (After Andrieux et al., 2000.) ... 179 Figure 57. Vibration contours obtained with the VCR software. (After Andrieux et al., 2000.) ... 182 Figure 58. (a) Longitudinal section of the 29-9 Pillar looking west; and, (b) cross-section at Ring 8 looking north. (After Andrieux et al., 2000.) ... 183 Figure 59. Schematic plan view (not to scale) showing the blasting sequence retained in the 29-9 Pillar at Brunswick Mine. (After Andrieux et al., 2000.) ... 186 Figure 60. Designed explosive energy input per tonne of targeted rock mass in the 29-9 Pillar at Brunswick Mine. ... 189 Figure 61. Photograph looking northwest from the pillar access showing the placement of the 7% cement paste backfill. (After Andrieux et al., 2000.) ... 191 Figure 62. Schematic view (not to scale) down an installation borehole showing the various components of a vibrating wire stress cell. ... 193 Figure 63. The definition of rise time and arrival time. ... 196 Figure 64. Cross-section through the 29-9 Pillar looking north and showing the projected location of the various instrumentation. (After Andrieux et al., 2000.) ... 197
Figure 65. Plan view of the south end of the 1000 Sill level showing the location of the four wall-mounted triaxial high frequency geophone arrays around the 29-9 Pillar. . 198 Figure 66. Blast vibration record for the station located 30m away from the destress blast in the 29-9 Pillar. (After Andrieux et al., 2000.) ... 200 Figure 67. Photograph looking west taken on 1000 Sill in the access cross-cut to the 29-9 Pillar. (After Andrieux et al., 2000.)... 201 Figure 68. Photograph looking north in the 29-9 Pillar overcut on 1000 Sill. (After Andrieux et al., 2000.) ... 202 Figure 69. Photograph looking north in the 29-9 Pillar overcut on 1000 Sill. This picture was taken further north from the area depicted in Figure 68. (After Andrieux et al., 2000.) ... 203 Figure 70. Plan view of the south end of 1000 Sill showing the seismic activity recorded in this region within 30m of the level between (a) 28 April 1999 and 28 October 1999; and, (b) 29 October 1999 and 28 April 2000. ... 204 Figure 71. Photograph taken during the post-blast camera survey in the downhole, at a depth of 34.4m. (After Andrieux et al., 2000.) ... 206 Figure 72. Complete datalogger results for the uphole and the downhole Geokon stress gauges. (After Andrieux et al., 2000.) ... 207 Figure 73. Datalogger results for the uphole and the downhole Geokon stress gauges from 23 October to 4 November 1999. (After Andrieux et al., 2000.) ... 208 Figure 74. Displacements measured by the downhole multi-point extensometer. (After Andrieux et al., 2000.) ... 210 Figure 75. Cross-section looking north through the 29-9 Pillar showing the geometry of the cross-hole tomographic arrays. ... 211 Figure 76. Cross-section looking north through the 29-9 Pillar showing the parallel raypaths used for the first series of seismic analyses. (After Andrieux et al., 2000.)212 Figure 77. (a) Rise time change as a function of source depth; and, (b) arrival time change as a function of source depth. (After Andrieux et al., 2000.) ... 212 Figure 78. (a) Cross-correlated velocity difference image (cross-section looking north thought the 29-9 Pillar); and, (b) photograph looking south taken in the 29-9 Pillar overcut on 1000 Sill. (After Andrieux et al., 2000.) ... 214 Figure 79. Influence of the distance between the tomographic holes on the assessment of the P-wave velocity of propagation difference before and after the destress blast. .... 215 Figure 80. Schematic view showing a layer of lower P-wave velocity material (medium “B”) sandwiched between two layers of a higher P-wave velocity medium (medium “A”). ... 215 Figure 81. Theoretical variation of the P-wave travel time as a function of the relative thickness of the zone of interest. ... 217 Figure 82. Composite plan view of the 42-1-1620 Stope, Cut #21, showing the location of the major rockbursts experienced in the 39 Sill west of the 42-1-133 Ramp Access, from July 1999 to March 2001. ... 230 Figure 83. Schematic plan view showing the A5 stringers and the area targeted by the destress blast. ... 232
Figure 84. Schematic elevation view (not to scale) looking at the east wall of the proposed hanging wall drilling drift, and showing the offset blasthole collars... 234 Figure 85. Elevation views looking north of (a) the south row; and, (b) the north row of destress blastholes, as designed. ... 235 Figure 86. Representation of the outside zones of influence retained around a large-scale choked pillar destress blast. ... 236 Figure 87. Designed explosive energy input per tonne of targeted rock in the 42-1-080 area. ... 237 Figure 88. Sketch (not to scale) of the en-echelon firing sequence retained for the destress blast. ... 238 Figure 89. Schematic plan view showing the location of the three Geokon stress cells used to track stress changes following the destress blast. ... 245 Figure 90. Installation of the three Geokon vibrating wire stress cells schematic diagrams looking down the instrumented holes and showing the orientation of the gauges. .... 246 Figure 91. Schematic plan view showing the location of the two MPBX multi-point extensometers used to track ground movement following the destress blast. ... 247 Figure 92. Schematic plan view showing the location of the shotcrete post instrumented with a strain gauge. ... 248 Figure 93. Schematic plan view showing the location of two of the three surface-mounted geophone stations. The third station was located in the 42-1 refuge station. ... 249 Figure 94. Blast-induced vibrations recorded on the south wall of the 080 Remuck Bay, 42m away from the blast. ... 251 Figure 95. Vibrations recorded within 3 seconds of the destress blast on the south wall of the 080 Remuck Bay, 42m away. ... 253 Figure 96. Photograph taken on the morning of 28 December 2001 looking south at the entrance of the destress blast drill drift. ... 254 Figure 97. Seismic response of the rock mass to the destress blast, between 15:50 24 December and 01:00 31 December 2001. ... 256 Figure 98. Seismic activity rate in the 42-1620W Block between the destress blast and 31 December 2001. ... 257 Figure 99. Cumulative static stress drop in the 42-1620W Block between the destress blast and 31 December 2001. ... 258 Figure 100. Cumulative apparent volume in the 42-1620W Block between the destress blast and 31 December 2001. ... 259 Figure 101. Results from the Geokon stress cells installed near the 42-1-080 Access. .... 261 Figure 102. Conceptual cross-section (not to scale) looking west through the destressed pillar, showing how a reduction of the sill pillar effective thickness effectively results in a stress re-orientation at a given point of observation. ... 262 Figure 103. Results from the MPBX extensometers installed near the 42-1-080 Access. 264 Figure 104. Suggested alternative methodology for the calculation of the charge confinement ratio. ... 284
Figure 105. Determination of the Wet index from an unconfined compressive test. (Adapted from Simon et al.,1998.) ... 290 Figure 106. Determination of the BIM from a uniaxial compressive test. (After Simon et al., 1998.) ... 291 Figure 107. Schematic representation of the behaviour of the sonic velocity as a function of axial deformation in an intact sample of brittle hard rock. (After Bieniawski, 1967.) ... 296 Figure 108. Various types of seismic surveys for assessing the stress state of the rock mass.
... 297 Figure 109. (a) Longitudinal section showing the seismic activity recorded in 1999 on the north side of the 1000m Level at Brunswick Mine; and, (b) number of seismic events recorded yearly from 1992 to 1999 in the same region. (After Andrieux & Simser, 2001.) ... 299 Figure 110. Pn space-time clustering analysis of seismic events recorded 19 February 1997 on the 1000m Level at Brunswick Mine. (After Gaudreau, 1997 a.) ... 301 Figure 111. Example of a Gutenberg-Richter plot case of the 1000 South Bulk Zone at Brunswick Mine. (Adapted from Simser & Falmagne, 2004.) ... 302 Figure 112. Shift in the average apparent stress of the seismic events recorded (a) in the South Bulk Zone ; and, (b) in the South Regional Pillar, before and after the July 2001 mass-blast in the South WOZ at Brunswick Mine. (After Simser & Falmagne, 2004.) ... 305 Figure 113. The concept of the seismic energy and the average seismic energy for a given seismic moment. (Adapted from Simser et al., 1998.) ... 306 Figure 114. Moving average Energy Index vs. cumulative apparent volume in the South Pyramid on the 850m Level at Brunswick Mine. (After Simser, 2000.) ... 307 Figure 115. (a) Pre-mining; and, (b) post-mining static states in a conceptual 2-D solid medium subjected to a biaxial stress field. (After Brady & Brown, 1993.) ... 309 Figure 116. Relationship between the volumetric Energy Release Rate, the number of rockbursts and the danger associated with them. (After Cook, 1977.) ... 312 Figure 117. Plan view of the test stope at the Western Deep Levels Mine showing the location of the four preconditioning test panels, as well as the layout of the seismic system. (After Toper et al., 1997). ... 318 Figure 118. Destress blast pattern used in 1970 in the 40-135 overhand cut-and-fill test stope at the Galena Mine. (After Blake, 1972). ... 321 Figure 119. Results of a seismic velocity survey conducted by firing a number of small charges at the stope back while monitoring wave arrivals at a number of geophone locations in the sill drift above. (After Blake, 1972.) ... 322 Figure 120. Longitudinal view of the destress blastholes used in 1972 in two destress blasts in numerous sill pillars at the Crescent Mine. (After Board & Fairhurst, 1983.) ... 323 Figure 121. Longitudinal view of the 101 and 103 stopes showing the typical sill pillar destressing layout used at the Lucky Friday Mine. (After Jenkins & McMahon, 1987.) ... 324
Figure 122. Longitudinal view of the large panel preconditioning blast at the Star Mine. (After Board & Fairhurst, 1983.) ... 326 Figure 123. Preconditioning blasthole rings drilled off (a) the #10 X/C on Level 7700;
and, (b) the #8 X/C on Level 7900 at the Star Mine. (After Board & Fairhurst, 1983.) ... 327 Figure 124. (a) Plan view; and, (b) cross-section of the destressing method implemented at the Star Mine in timbered cut-and-fill stopes. (After Jenkins & McMahon, 1987.) . 328 Figure 125. Schematic longitudinal view through the Grouse Vein at the Star Mine showing the location of the destress blastholes. (After Board & Fairhurst, 1983.) ... 329 Figure 126. Closure measurements in the sill pillar region of the Grouse Vein at the Star Mine before and after the destress blast. (After Board & Fairhurst, 1983.) ... 331 Figure 127. IRAD stress cell measurements in the sill pillar region of the Grouse Vein at the Star Mine before and after the destress blast. (After Board & Fairhurst, 1983.) . 331 Figure 128. Schematic longitudinal view (not to scale) showing the layout of the unsuccessful 1990 pillar destress attempt at Galena Mine. (After Board & Fairhurst, 1983.) ... 332 Figure 129. Plan view of a typical INCO destress blast design for drift rounds. (After Garood, 1984.) ... 333 Figure 130. Plan view of the typical destress blasthole layout implemented in the Creighton No. 11 Shaft. (After Garood, 1984.) ... 334 Figure 131. Schematic views of the typical destressing pattern implemented on the 2195m Level at the Creighton Mine. (Adapted from O’Donnell, 1992.) ... 335 Figure 132. Longitudinal view looking west cut through the destress slot in the 25 Pillar at Stobie Mine. (After O’Donnell, 1999.)... 337 Figure 133. Destressing approach implemented at the Falconbridge #5 Shaft in narrow
cut-and-fill veins. (After Slade, 1968.) ... 338 Figure 134. Longitudinal view of the destress blast layout implemented at the Lake Shore Mine in 1962 for the recovery of the remnant 40026-2 Pillar. (After Harling, 1965.) ... 340 Figure 135. Longhole destressing approach implemented at the Lake Shore Mine when approaching the active Lake Shore Fault. (After Harling, 1965.) ... 341 Figure 136. Longitudinal section showing the destress layout in the 58-40 Sill Pillar at Macassa Mine. (After Hanson et al., 1987.) ... 342 Figure 137. Longitudinal (top) and plan views, and cross-section showing the destress blast layout implemented in the 3420E Stope at Sigma Mine. (After Labrie et al., 1996.) ... 344 Figure 138. Destress layout implemented in the remnant of the 1604 East Stope at the Campbell Red Lake Mine. (After Blake et al., 1998.)... 345 Figure 139. (a) Longitudinal section; and, (b) plan view showing the general location of the destress slot next to the I2 Stope at Mount Charlotte Mine. (Adapted from Mikula et al., 1995.) ... 347
Figure 140. Schematic views (not to scale) showing (a) the general arrangement of the destress and presplit blastholes; and, (b & c) their loading parameters. (After Mikula et al., 1995.) ... 348 Figure 141. Schematic illustration (not to scale) showing the modelled effect of a 2.5, 5 and 10% reduction in the elastic modulus of a destressed zone located on the footwall side of a cut-and-fill stope in a high sub-horizontal stress field. (After Blake et al., 1998). ... 350 Figure 142. Standardised coal sample test for the assessment of burst-proneness in the German Ruhr coal fields. (After Bräuner, 1994.) ... 353 Figure 143. Typical results of the standardised coal sample test showing burst-prone (Type I) and non-burst prone (types II and III) seams. (After Bräuner, 1994.) ... 353 Figure 144. Schematic plan view showing the typical test and destress hole layout ahead of a German burst-prone underground coal mine panel. (Adapted from Will, 1982.) .. 354 Figure 145. Results of a typical test hole ahead of the coal face the volume of cuttings is highest near the peak stress region. (After Bräuner, 1994.) ... 355 Figure 146. Schematic view (not to scale) illustrating the procedure for the determination of the RQD index. (Adapted from Deere & Deere, 1988.) ... 359 Figure 147. Destressability Index development spreadsheet at the intact rock material scale RES interaction matrix worksheet. ... 380 Figure 148. Destressability Index development spreadsheet at the intact rock material scale Destressability Index calculation worksheet. ... 381 Figure 149. Destressability Index development spreadsheet at the rock mass scale RES interaction matrix worksheet. ... 382 Figure 150. Destressability Index development spreadsheet at the rock mass scale Destressability Index calculation worksheet... 383
LIST OF TABLES
Page Table 1. Summary of the general potential for violent failure to occur for various
conceptual combinations of stress conditions, rock properties and loading system stiffness. ... 25 Table 2. Comparative reported data from 21 selected large-scale choked destress blasts in underground pillars. ... 61 Table 3. Coding values of the blastability interaction matrix. (After Latham & Lu, 1999.)
Table 4. Properties used to characterise the parameters used in the large-scale choked pillar destress blasting RES interaction matrix. Case where the rock properties are at the intact material scale. ... 141 Table 5. Properties used to characterise the parameters used in the large-scale choked pillar destress blasting RES interaction matrix. Case where the rock properties are at the rock mass scale. ... 141 Table 6. Range of rock elastic modulus values for the rating of parameter P1 (stiffness of the rock), for the interaction matrix at the intact rock material scale. ... 155 Table 7. Range of BIM values for the rating of parameter P2 (brittleness of the rock), for the interaction matrix at the intact rock material scale. ... 156 Table 8. Range of RMR values for the rating of parameter P3 (degree of fracturing of the rock mass), for the interaction matrix at the intact rock material scale. ... 156 Table 9. Range of proximity to failure values for the rating of parameter P4 (proximity to failure of the rock), for the interaction matrix at the intact rock material scale. ... 156 Table 10. Range of angle values for the rating of parameter P5 (orientation of the destress blast with respect to 1 ), for the interaction matrix at the intact rock material scale. 156 Table 11. Range of number of blasting rings for the rating of parameter P6 (width of the target zone), for the interaction matrix at the intact rock material scale. ... 157 Table 12. Range of explosive energy per unit mass values for the rating of parameter P7
(unit explosive energy), for the interaction matrix at the intact rock material scale. . 157 Table 13. Range of charge confinement ratios for the rating of parameter P8 (confinement of the explosive charges), for the interaction matrix at the intact rock material scale. ... 157 Table 14. Assessment of the Destressability Index as a function of the overall normalised parameter score at the intact rock material scale. ... 158 Table 15. List of the basic properties and quantities required for the assessment of the Destressability Index at the intact rock material scale. ... 158 Table 16. Rating and score associated with each parameter for the example assessment of the Destressability Index at the intact rock material scale. ... 162 Table 17. Range of rock mass elastic modulus values for the rating of parameter P1
(stiffness of the rock), for the interaction matrix at the rock mass scale. ... 163 Table 18. Range of B1 values for the rating of parameter P2 (brittleness of the rock), for the interaction matrix at the rock mass scale. ... 163 Table 19. Range of RMR values for the rating of parameter P3 (degree of fracturing of the rock mass), for the interaction matrix at the rock mass scale. ... 164 Table 20. Range of proximity to failure values for the rating of parameter P4 (proximity to failure of the rock), for the interaction matrix at the rock mass scale. ... 164 Table 21. Comparison between the ranges of proximity to failure values for the rating of parameter P4 at the intact material and rock mass scales, with no confinement... 165 Table 22. Range of angle values for the rating of parameter P5 (orientation of the destress blast with respect to 1 ), for the interaction matrix at the rock mass scale. ... 165
Table 23. Range of number of blasting rings for the rating of parameter P6 (width of the target zone), for the interaction matrix at the rock mass scale. ... 165 Table 24. Range of explosive energy per unit mass values for the rating of parameter P7
(unit explosive energy), for the interaction matrix at the rock mass scale. ... 166 Table 25. Range of charge confinement ratios for the rating of parameter P8 (confinement of the explosive charges), for the interaction matrix at the rock mass scale. ... 166 Table 26. Assessment of the Destressability Index as a function of the overall normalised parameter score at the rock mass scale. ... 167 Table 27. List of the basic properties and quantities required for the assessment of the Destressability Index at the rock mass scale. ... 167 Table 28. Rating and score associated with each parameter for the example assessment of the Destressability Index at the rock mass scale. ... 171 Table 29. Drilling data summary for the destress blast in the 29-9 Pillar at Brunswick Mine. ... 184 Table 30. Effects on a “typical” rock mass of various vibration levels. (After Chiappetta et al., 1987.) ... 185 Table 31. Detonator numbers and resulting delays used to achieve the blasting sequence retained. (After Andrieux et al., 2000.) ... 187 Table 32. Loading data for the destress blast in the 29-9 Pillar at Brunswick Mine. ... 188 Table 33. Principal final field statistics of the destress blast in the 29-9 Pillar at Brunswick Mine. ... 189 Table 34. Location of the anchors along the two extensometers installed in the 29-9 Pillar at Brunswick Mine. ... 195 Table 35. Description of the boreholes used for the cross-hole seismic surveys. ... 197 Table 36. Distance between the four high frequency geophones and the destress blast in the 29-9 Pillar at Brunswick Mine. ... 199 Table 37. Description of the mining events that triggered the selected stress jumps shown in Figure 72. ... 207 Table 38. Summary of the readings from the downhole extensometer. (After Andrieux et al., 2000.) ... 209 Table 39. Theoretical variations in the travel time of a P-wave as a function of its velocity in medium “B” and the thickness of this medium. ... 216 Table 40. List of the basic properties and quantities required for the assessment of the Destressability Index at the intact rock material scale in the 29-9 Pillar. ... 219 Table 41. Rating and score associated with each parameter for the assessment of the Destressability Index at the intact rock material scale in the 29-9 Pillar. ... 221 Table 42. List of the basic properties and quantities required for the assessment of the Destressability Index at the rock mass scale in the 29-9 Pillar. ... 222 Table 43. Rating and score associated with each parameter for the assessment of the Destressability Index at the rock mass scale in the 29-9 Pillar. ... 225 Table 44. Summary of the largest seismic events recorded in the 39 Sill west of the
Table 45. Designed vs. actual drilling for Ring #1. ... 239 Table 46. Designed vs. actual drilling for Ring #2. ... 239 Table 47. Designed vs. actual drilling for Ring #6. ... 240 Table 48. Designed vs. actual drilling for Ring #7. ... 240 Table 49. Loading parameters for Ring #1. ... 242 Table 50. Loading parameters for Ring #2. ... 242 Table 51. Loading parameters for Ring #6. ... 242 Table 52. Loading parameters for Ring #7. ... 243 Table 53. Principal final field statistics of the destress blast in the 42-1-1620 Stope. ... 243 Table 54. Location of the various anchors along the two multi-point extensometers installed in the back of the 42-1-080 Access. ... 247 Table 55. Distance from the destress blast of the three triaxial surface-mounted
blast-induced vibration recording stations. ... 249 Table 56. List of the basic properties and quantities required for the assessment of the Destressability Index at the intact rock material scale in the A5-Right pillar. ... 266 Table 57. Rating and score associated with each parameter for the assessment of the Destressability Index at the intact rock material scale in the A5-Right pillar. ... 269 Table 58. List of the basic properties and quantities required for the assessment of the Destressability Index at the rock mass scale in the A5-Right pillar. ... 270 Table 59. Rating and score associated with each parameter for the assessment of the Destressability Index at the rock mass scale in the A5-Right pillar. ... 272 Table 60. Normalised destressability scores obtained for both case histories, at both the intact rock material and rock mass scales. ... 280 Table 61. Relation between the BIM and the potential for violent rock failure. (After Aubertin et al., 1994.) ... 291 Table 62. Classes of Activity Index Ai and their effects on the behaviour of the rock mass.
(After Tao, 1988.) ... 295 Table 63. Summary of the seismic data recorded before and after the preconditioning of Panel E. (Adapted from Toper et al., 1997.)... 318 Table 64. The Rock Mass Rating system. (After Bieniawski, 1989.) ... 361 Table 65. RQD determination example. ... 362 Table 66. Characterisation of rock masses on the basis of interlocking and joint alteration.
(After Hoek et al., 1995.) ... 366 Table 67. Estimate of Geological Strength Index GSI based upon geological descriptions.
(After Hoek et al., 1995.) ... 367 Table 68. Description and rating of the individual parameters used in the tunnelling Quality index Q. (After Barton et al., 1974.) ... 373 Table 69. Relationship between the Q rating and the quality of the rock mass. (After Barton et al., 1974). ... 377
LIST OF FORMULAE AND EQUATIONS
Page Equation (1). Ground stress magnitude gradient …..……….……….11 Equation (2). The Mohr-Coulomb linear failure criterion ……...……...…..………15 Equation (3). The Hoek-Brown non-linear failure criterion (also see Eq. [65]) …..….16 Equation (4). Potential energy dissipated by a pillar at failure ……..………26 Equation (5). Potential energy dissipated by a pillar at failure (as per stiffness) ….…….26 Equation (6). Static energy dissipated by a pillar at failure ……….27 Equation (7). Minimum excess energy in a pillar at failure ……….27 Equation (8). Load drop in a pillar at failure (assuming no residual strength) .………..27 Equation (9). Maximum excess energy in a pillar at failure ……..………....27 Equation (10). Uniaxial compressive strength of a pillar at the rock mass scale (at zero
confinement) …..……….….……….………...……..……….27
Equation (11). Maximum excess energy in a pillar at failure (with H-B failure criterion) .28 Equation (12). Energy balance due to mining ………….……….42 Equation (13). Energy released by the excavation process ……….……….42 Equation (14). Energy balance due to mining (considering failure and ground support) ...42 Equation (15). Balance between the static strain energy stored in a pillar before and
after a blast, and the dynamic energy injected in it …….………43 Equation (16). Balance between the static strain energy stored in a system before and
after a blast, and the dynamic energy injected in and consumed by this system .….43 Equation (17). Mass of the external zone of influence of a choked destress blast ...…...75 Equation (18). Total, or “effective” mass targeted by a choked destress panel blast ....76 Equation (19). Energy available from one explosive charge ……….……….…77 Equation (20). Young’s modulus at the rock mass scale (After Nicholson &
Bieniawski, 1990) ……….133
Equation (21). Young’s modulus at the rock mass scale (After Bieniawski, 1989) …..133 Equation (22). Young’s modulus at the rock mass scale (After Serafim & Pereira,
1983) ………….……….133 Equation (23). Young’s modulus at the rock mass scale (After Barton, 1988) ….……133 Equation (24). Rock mass brittleness index B1 …....………..………135 Equation (25). Uniaxial compressive strength of a rock mass (with confinement) …...135 Equation (26). Tensile strength of a rock mass ……….……….135 Equation (27). Hoek-Brown parameter m at the rock mass scale (also see Eq. [66]) …...135 Equation (28). Hoek-Brown parameter s at the rock mass scale (also see Eq. [67])…….135 Equation (29). Geological Strength Index GSI ……….….135
Equation (30). Proximity to static failure at the intact rock material scale …….……...138 Equation (31). Proximity to static failure at the rock mass scale ……….…...138 Equation (32). Estimation of the peak particle velocity of a blast-induced vibration
(square root scaling) ………...……….…..184 Equation (33). Estimation of the peak particle velocity of a blast-induced vibration
(square root scaling, with values suggested without field measurements) ………185 Equation (34). Cross-correlation of two complex functions ……….….213 Equation (35). Vector sum of three orthogonal signals …..……….….250 Equation (36). Stress drop associated with a seismic event ……….…….…….257 Equation (37). Seismic moment of a seismic event …..……….…………257 Equation (38). Apparent volume of a seismic event (from energy) .……….…….258 Equation (39). Bursting Liability Index (Wet) ………..………...289 Equation (40). Brittleness Index Modified (BIM) ……...……….…….290 Equation (41). Decrease Modulus Index (Dmi) ….………...292 Equation (42). Fragility rating BI of a rock sample .………292 Equation (43). Fragility rating BII of a rock sample ….………292 Equation (44). Burst Efficiency Ratio Ber .……..……….…....292 Equation (45). Maximum energy stored in a sample during loading ….……….292 Equation (46). Activity Index Ai ….…...………..………294 Equation (47). Gutenberg-Richter frequency-magnitude relationship ….………302 Equation (48). Unconditional probability of occurrence of a seismic event being larger
than a magnitude M, during a future time period t …...……....………...……..303 Equation (49). Probability that a seismic event has a magnitude greater than M …....303 Equation (50). Apparent stress of a seismic event …….………..304 Equation (51). Apparent volume of a seismic event (from apparent stress) ….…...…...306 Equation (52). Total energy released by the excavation process ….………309 Equation (53). Total energy released by the excavation process (with vibrational
component) ………..…….………...310
Equation (54). Energy Release Rate ERR (as a function of excavation area) ….…..…311 Equation (55). Energy Release Rate ERR (as a function of excavation volume) ……..311 Equation (56). Static shear strength of a fault ……….………….……....…..312 Equation (57). Dynamic shear stress along a fault ………...………..312 Equation (58). Excess Shear Stress (ESS) …..……….………..312 Equation (59). Equivalent post-peak stiffness of a pillar per unit length off plane …..…314 Equation (60). Equivalent post-peak stiffness of a pillar per unit length off plane (for
pillars with a near square cross-section and under perfectly elastic conditions) …..314 Equation (61). Evaluation of Rockburst Potential (ERP) ……….……..……...314 Equation (62). Stiffness of a loading system ………...…..…………..…..314 Equation (63). Bursting Potential Ratio (BPR) ……….…………..…...314
Equation (64). Rock Quality Designation RQD ………....359 Equation (65). Generalised Hoek-Brown failure criterion for jointed rock masses (also
see Eq. [3]) …….……….………...…365 Equation (66). Hoek-Brown parameter m at the rock mass scale (also see Eq. [27]) …..365 Equation (67). Hoek-Brown parameter s at the rock mass scale for GSI values > 25 (also see Eq. [28]) ………...………....368 Equation (68). Exponent a of the generalised Hoek-Brown failure criterion for jointed
rock masses for GSI values > 25 ……….………..…368 Equation (69). Hoek-Brown parameter s at the rock mass scale for GSI values < 25 …..368 Equation (70). Exponent a of the generalised Hoek-Brown failure criterion for jointed
rock masses for GSI values < 25 ………...………..….……….368 Equation (71). Rock tunnelling quality index Q ………...….………370 Equation (72). Modified rock tunnelling quality index Q’ ………...……….…377
LIST OF SYMBOLS
a Intercept of the Gutenberg-Richter plot
a Exponent of the generalised Hoek-Brown failure criterion
A Rock Stress Factor, or area
ABS Absolute Bulk Strength of an explosive product
Ai Activity Index
AWS Absolute Weight Strength of an explosive product
b Slope of the Gutenberg-Richter plot
B Burden in front of a blasthole B1 Rock mass brittleness index BI , BII Fragility ratings of an intact rock
sample
Ber Burst Efficiency Ratio BIM Brittleness Index Modified
BPR Bursting Potential Ratio
Attenuation factor in the USBM blast-induced vibration scaling relationship
c Cohesion, or cohesive strength C Unloaded length at the collar of a
blasthole
d Diameter of an explosive charge D Diameter of a blasthole
df Dimension of a fractal distribution
Df Similarity dimension (of a
self-similar fractal distribution) Dmi Decrease Modulus Index
Displacement, or infinitesimally small variation (of a quantity) (Large) variation (of a quantity) Ai Transformation area of a given
blast design, for the purpose of assessing its blastability
Stress drop associated with a seismic event
E Young’s modulus (also called the elastic modulus), or energy
Ea Average seismic energy liberated by a seismic event of a given seismic moment Mo
Ec Energy available in one explosive charge
Ed Static energy dissipated by the failure of a pillar
ED Energy dissipated in the Bursting Liability Index test
EI Energy Index of a seismic event Ep Potential energy that must be
dissipated by a system at failure Ep Net change in potential energy in
the system after a destress blast ER Elastic energy recovered in the
Bursting Liability Index test ERP Evaluation of Rockburst Potential ERR Energy Release Rate
Es Seismic energy liberated by a seismic event
ESQ Expert Semi-Quantitative (matrix coding) method
ESS Excess Shear Stress on a fault (also referred to as e )
Ex Explosive energy used to push back the pillar walls during a large destress blast
E’m Post-peak stiffness of the encasing rock mass
Strain
r Axial deformation at failure of a sample subjected to a uniaxial compressive test
Friction angle
0 Maximum energy stored inside a sample during the loading phase of a uniaxial compressive test 1 Energy of the particles ejected at
failure from a sample subjected to a uniaxial compressive test
G Rigidity of the rock mass (stiffness modulus)
GSI Geological Strength Index of a rock mass
H Height
H-B Hoek-Brown failure criterion Ja Joint alteration number Jn Joint set number
Jr Joint roughness number Jv Volumetric joint count Jw Joint water reduction factor
K Amplitude factor in the USBM blast-induced vibration scaling relationship
k1 Ratio of (1 / 3 ) k2 Ratio of (2 / 3 )
ke Stiffness of a loading system k’pr Equivalent post-peak stiffness of a
pillar
l Length of an explosive charge L Length
m Hoek-Brown constant related to the degree of block interlocking in the rock
m Laboratory , or mi Value of the Hoek-Brown constant m at the
laboratory, or intact rock material scale
m Rock Mass , or mb Value of the Hoek-Brown constant m at the rock mass scale
M “Generic” magnitude of a seismic event (either Richter or Nuttli) Me External zone of influence of a
destress blast
MN Nuttli Magnitude of a seismic event
Mo Moment of a seismic event
MR Richter Magnitude of a seismic event
MT Total mass, or “effective” mass, targeted by a destress blast
M(r) Total number of seismic events within a counting sphere
d Dynamic coefficient of friction s Static coefficient of friction
N Number of blasting rings in a destress blast
Pi Parameter i of a Rock Engineering System interaction matrix
Pn Clustering index (of seismic events)
PPV Peak Particle Velocity of a vibration
PTF Intact Proximity To (static) Failure of an intact sample of rock PTF Rock Mass Proximity To (static)
Failure of a rock mass
Q Rock tunnelling Quality index Q’ Modified rock tunnelling Quality
index
RBS Relative Bulk Strength of an explosive product
RES Rock Engineering Systems
RMR Rock Mass Rating
RQD Rock Quality Designation
RWS Relative Weight Strength of an explosive product
e Density of an explosive product r Density of rock
s Hoek-Brown constant associated with the degree of fracturing of the rock
s Laboratory Value of the Hoek-Brown constant s at the scale of the intact rock material (always = 1.000) s Rock Mass Value of the Hoek-Brown
constant s at the scale of the rock mass
S Spacing between blastholes on the same row
Sf Self-similar fractal distribution
SRF Stress Reduction Factor Stress
1 Major principal stress component 2 Intermediate principal stress
component
3 Minor principal stress component ’1 Effective major principal stress
component at failure
’2 Effective intermediate principal stress component at failure
’3 Effective minor principal stress component at failure
1 Actual Mining-induced major principal stress component at a time of interest.
2 Actual Mining-induced intermediate principal stress component at a time of interest
3 Actual Mining-induced minor principal stress component at a time of interest
a Apparent stress of a seismic event c Compressive strength (unconfi-ned, or uniaxial) of the intact rock material (also sometimes referred to as ci )
ci Compressive strength (unconfi-ned, or uniaxial) of the intact rock material (more often referred to as c )
cR Unconfined (or uniaxial) compres-sive strength at the rock mass scale (same as c Rock Mass)
c Rock Mass Unconfined (or uniaxial) compressive strength at the rock mass scale (same as cR)
N Normal stress
T Tensile strength (also sometimes referred to as To )
Summation (of quantities)
T Unloaded length at the toe of a blasthole
To Tensile strength of the intact rock material
Shear stress
d Dynamic shear stress on a fault e Excess shear stress on a fault (also
referred to as ESS)
s Static shear strength of a fault Uc Stored static strain energy increase
in the remaining (un-mined) rock, after mining
UC Increase in strain energy in the surrounding rock after a destress blast
UCS Unconfined Compressive
Strength, or Uniaxial Compressive Strength (also referred to as c or cR , depending upon the scale considered)
Ue Excess energy
Uf Energy consumed in fracturing the rock mass (either naturally, around an excavation, and/or artificially, by blasting)
Um Strain energy that was stored in material that has been mined (removed)
Um1 Strain energy stored in a system before a destress blast
Um1 Strain energy originally stored in the failed rock material around an excavation
Um2 Strain energy stored in a system after a destress blast
Ur Energy released by the excavation of a void in rock
Us Energy consumed by the ground support system
Uv Vibrational energy released at failure in a rock mass in the case of a rapid excavation
V Volume, or source volume of a seismic event
Va Apparent volume of a seismic event
VOD Velocity Of Detonation of an explosive product
Vp Velocity of propagation of P (compressive) seismic waves Vs Velocity of propagation of S
(shear) seismic waves Poisson’s ratio
Wet Bursting Liability Index
Wk Dynamic (seismic) energy released by the mining process WK Dynamic (seismic) energy that
vibrates the rock mass after a destress blast
Wr Energy released, or dissipated, in the mining process
Wt Change in potential energy of the system as a result of mining WT Change in the potential energy of
a system from before and after a destress blast