Pépite | Contributions à la chaîne logistique e-commerce : Intégration dans l'e-fulfillment et tarification de services de livraison
129
0
0
Texte intégral
(2) Thèse de Bayrem Tounsi, Lille 1, 2016. © 2016 Tous droits réservés.. lilliad.univ-lille.fr.
(3) Thèse de Bayrem Tounsi, Lille 1, 2016. Acknowledgments. First, I express my gratitude to my two supervisors Dr. Luce Brotcorne and Dr. Yezekael Hayel. All along the thesis, they provided me support and encouragements. The work with them was stimulating and instructive, in a very good atmosphere. I would like to thank Pr. Yves Crama and Dr. Patrick Maill´e for being part of my committee and reviewing the present manuscript. Their corrections and suggestions helped me to improve my manuscrit. I thank Dr. Dominique Feillet, Dr. Olivier P´eton, Pr. Frederic Semet and Pr. Clarisse Dhaenens for being part of my committee. On the RESPET project, I had the opportunity to work with other researchers. I thank Pr. Frederic Semet, Dr. Dominique Quadri and Dr. Diego Cattaruzza. I thank Pascal Olivier for his cooperation and for organizing a visit to DHL warehouse. During my thesis I was pleased to meet and know numerous people. I thank my friends and colleagues in INOCS and DOLPHIN teams, and in LIA. I wish to all of them success. I would like to express my warm thanks to Diego, Maria and Maxime for their help and support during my defense’s rehearsal. I finally thank Inria personnel, particularly Julie and Aurore, for their kindness and their availability every time I had a request.. © 2016 Tous droits réservés.. lilliad.univ-lille.fr.
(4) Thèse de Bayrem Tounsi, Lille 1, 2016. © 2016 Tous droits réservés.. lilliad.univ-lille.fr.
(5) Thèse de Bayrem Tounsi, Lille 1, 2016. Contents 1 Introduction 1.1 Third party logistics . . . . . . . . . 1.2 E-commerce supply chain . . . . . . 1.2.1 E-fulfillment network . . . . . 1.2.2 Transportation in e-commerce 1.3 Contributions . . . . . . . . . . . . . 2. . . . . .. . . . . .. . . . . .. . . . . .. . . . . .. . . . . .. . . . . .. . . . . .. Integration in E-fulfilment optimization 2.1 Introduction . . . . . . . . . . . . . . . . . . . . . . . 2.2 Warehouse description . . . . . . . . . . . . . . . . . 2.2.1 Replenishment . . . . . . . . . . . . . . . . . 2.2.2 Order picking . . . . . . . . . . . . . . . . . . 2.2.3 Packages shipping . . . . . . . . . . . . . . . . 2.2.4 Picking and shipping coordination . . . . . . . 2.2.5 Resources optimization . . . . . . . . . . . . . 2.2.6 The integrated picking and shipping problem . 2.3 State of the art . . . . . . . . . . . . . . . . . . . . . 2.3.1 Lot-sizing . . . . . . . . . . . . . . . . . . . . 2.3.2 Functional coordination . . . . . . . . . . . . 2.3.3 Decisions Integration . . . . . . . . . . . . . . 2.4 Problem definition, notation and model . . . . . . . . 2.5 A three-phase matheuristic . . . . . . . . . . . . . . . 2.5.1 Phase I - Production capacity . . . . . . . . . 2.5.2 Phase II - Reassignment and postponement . 2.5.3 Phase III - Dock management . . . . . . . . . 2.5.4 Speed-up techniques . . . . . . . . . . . . . . 2.6 Computational results . . . . . . . . . . . . . . . . . 2.6.1 Instance generation . . . . . . . . . . . . . . . 2.6.2 Discussion . . . . . . . . . . . . . . . . . . . . 2.7 Conclusions . . . . . . . . . . . . . . . . . . . . . . .. 3 Dynamic optimization with rolling horizon 3.1 Introduction . . . . . . . . . . . . . . . . . . . 3.2 Multi-period rolling horizon procedure . . . . 3.2.1 Rolling horizon mechanism . . . . . . . 3.2.2 Policy Vs solution . . . . . . . . . . . . 3.2.3 Start and end of horizon biases . . . . 3.2.4 Rolling horizon length . . . . . . . . . 3.2.5 Bounds with fully revealed information. © 2016 Tous droits réservés.. . . . . .. . . . . . . .. . . . . . . .. . . . . . . .. . . . . . . .. . . . . .. . . . . . . . . . . . . . . . . . . . . . .. . . . . . . .. . . . . .. . . . . . . . . . . . . . . . . . . . . . .. . . . . . . .. . . . . .. . . . . . . . . . . . . . . . . . . . . . .. . . . . . . .. . . . . .. . . . . . . . . . . . . . . . . . . . . . .. . . . . . . .. . . . . .. . . . . . . . . . . . . . . . . . . . . . .. . . . . . . .. . . . . .. . . . . . . . . . . . . . . . . . . . . . .. . . . . . . .. . . . . .. . . . . . . . . . . . . . . . . . . . . . .. . . . . . . .. . . . . .. . . . . . . . . . . . . . . . . . . . . . .. . . . . . . .. . . . . .. 1 1 2 3 3 6. . . . . . . . . . . . . . . . . . . . . . .. 9 10 10 11 11 12 12 13 13 15 15 16 17 18 26 28 29 29 30 36 36 37 46. . . . . . . .. 49 50 51 51 53 53 54 54. lilliad.univ-lille.fr.
(6) Thèse de Bayrem Tounsi, Lille 1, 2016. iv. Contents 3.3 3.4. 3.5. 3.6. 3.7. Mathematical formulation . . . . . . . . . . . . . . Deterministic approaches . . . . . . . . . . . . . . . 3.4.1 Pessimistic and optimistic policies . . . . . . 3.4.2 Policy with linearised resource cost (PLRC) 3.4.3 Policy with resource productivity . . . . . . 3.4.4 Resource productivity computation . . . . . Scenario based approaches . . . . . . . . . . . . . . 3.5.1 Expected value Solution . . . . . . . . . . . 3.5.2 Random Value Solution . . . . . . . . . . . 3.5.3 Quantile Value Solution . . . . . . . . . . . Numerical results . . . . . . . . . . . . . . . . . . . 3.6.1 Instances generation . . . . . . . . . . . . . 3.6.2 Algorithm Comparison . . . . . . . . . . . . 3.6.3 Demand variability . . . . . . . . . . . . . . 3.6.4 Sensitivity analysis . . . . . . . . . . . . . . Conclusion . . . . . . . . . . . . . . . . . . . . . . .. . . . . . . . . . . . . . . . .. 4 Last mile delivery services pricing with congestion 4.1 Introduction . . . . . . . . . . . . . . . . . . . . . . . 4.2 Last mile delivery . . . . . . . . . . . . . . . . . . . . 4.2.1 Delivery services . . . . . . . . . . . . . . . . 4.2.2 Quality of service . . . . . . . . . . . . . . . . 4.3 State-of-the-art: methodologies . . . . . . . . . . . . 4.3.1 Discrete choice models . . . . . . . . . . . . . 4.3.2 Bi-level programming . . . . . . . . . . . . . . 4.4 Delivery services choice model . . . . . . . . . . . . . 4.4.1 Utility functions . . . . . . . . . . . . . . . . . 4.4.2 Logit model . . . . . . . . . . . . . . . . . . . 4.4.3 Disadvantages of Logit . . . . . . . . . . . . . 4.4.4 Nested Logit . . . . . . . . . . . . . . . . . . . 4.5 Stochastic user equilibrium . . . . . . . . . . . . . . . 4.5.1 Equivalent optimization problem . . . . . . . 4.5.2 SUE computation . . . . . . . . . . . . . . . . 4.6 Sensitivity analysis . . . . . . . . . . . . . . . . . . . 4.6.1 General result . . . . . . . . . . . . . . . . . . 4.6.2 The case of nested Logit SUE . . . . . . . . . 4.7 The delivery services pricing problem . . . . . . . . . 4.7.1 Problem formulation . . . . . . . . . . . . . . 4.7.2 Gradient descent algorithm (GDA) . . . . . . 4.7.3 Bi-level local search (BLS) . . . . . . . . . . . 4.7.4 Sensitivity analysis based local search (SLS) . 4.8 Numerical results . . . . . . . . . . . . . . . . . . . .. © 2016 Tous droits réservés.. . . . . . . . . . . . . . . . .. . . . . . . . . . . . . . . . . . . . . . . . .. . . . . . . . . . . . . . . . .. . . . . . . . . . . . . . . . . . . . . . . . .. . . . . . . . . . . . . . . . .. . . . . . . . . . . . . . . . . . . . . . . . .. . . . . . . . . . . . . . . . .. . . . . . . . . . . . . . . . . . . . . . . . .. . . . . . . . . . . . . . . . .. . . . . . . . . . . . . . . . . . . . . . . . .. . . . . . . . . . . . . . . . .. . . . . . . . . . . . . . . . . . . . . . . . .. . . . . . . . . . . . . . . . .. . . . . . . . . . . . . . . . . . . . . . . . .. . . . . . . . . . . . . . . . .. . . . . . . . . . . . . . . . . . . . . . . . .. . . . . . . . . . . . . . . . .. 55 59 59 60 61 61 62 63 63 63 64 64 65 68 68 69. . . . . . . . . . . . . . . . . . . . . . . . .. 71 72 73 73 74 74 75 75 77 78 79 80 81 82 82 84 85 86 87 90 90 91 92 94 95. lilliad.univ-lille.fr.
(7) Thèse de Bayrem Tounsi, Lille 1, 2016. Contents. 4.9. v. 4.8.1 Stochastic user equilibrium . . . . . . . . . . . . . . . . . . . . 96 4.8.2 Services design problem . . . . . . . . . . . . . . . . . . . . . 98 Conclusion . . . . . . . . . . . . . . . . . . . . . . . . . . . . . . . . . 102. Conclusions and perspectives. 103. Bibliography. 107. © 2016 Tous droits réservés.. lilliad.univ-lille.fr.
(8) Thèse de Bayrem Tounsi, Lille 1, 2016. © 2016 Tous droits réservés.. lilliad.univ-lille.fr.
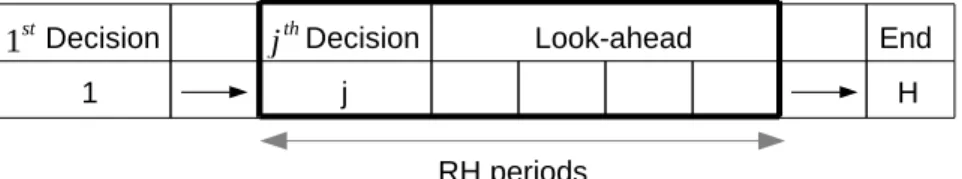
(9) Thèse de Bayrem Tounsi, Lille 1, 2016. List of Figures. © 2016 Tous droits réservés.. 1.1. The e-fulfillment network . . . . . . . . . . . . . . . . . . . . . . . . .. 2.1. The warehouse structure . . . . . . . . . . . . . . . . . . . . . . . . . 11. 3.1 3.2 3.3 3.4 3.5. Rolling horizon procedure . . . The time discretization . . . . . Penalty pattern . . . . . . . . . The expected demand scenario . Results of sensitivity analysis .. . . . . .. . . . . .. . . . . .. . . . . .. . . . . .. . . . . .. . . . . .. . . . . .. . . . . .. 51 56 56 65 69. 4.1 4.2 4.3 4.4 4.5 4.6 4.7 4.8 4.9. Last-mile delivery services system . . . . . . . . . . . . GDA main steps . . . . . . . . . . . . . . . . . . . . . Local search progress. . . . . . . . . . . . . . . . . . . . Delivery system with two services . . . . . . . . . . . . Options comparaison in Logit and nested Logit models services comparaison in Logit and nested Logit models Leader revenue depending on tariffs t11 and t21 . . . . . Nesting coefficient φ2 on revenue . . . . . . . . . . . . Dispersion parameter θ on revenue . . . . . . . . . . .. . . . . . . . . .. . . . . . . . . .. . . . . . . . . .. . . . . . . . . .. . . . . . . . . .. . . . . . . . . .. . . . . . . . . .. . . . . . . . . .. 77 92 93 95 96 97 99 101 101. . . . . .. . . . . .. . . . . .. . . . . .. . . . . .. . . . . .. . . . . .. . . . . .. . . . . .. . . . . .. . . . . .. . . . . .. 4. lilliad.univ-lille.fr.
(10) Thèse de Bayrem Tounsi, Lille 1, 2016. © 2016 Tous droits réservés.. lilliad.univ-lille.fr.
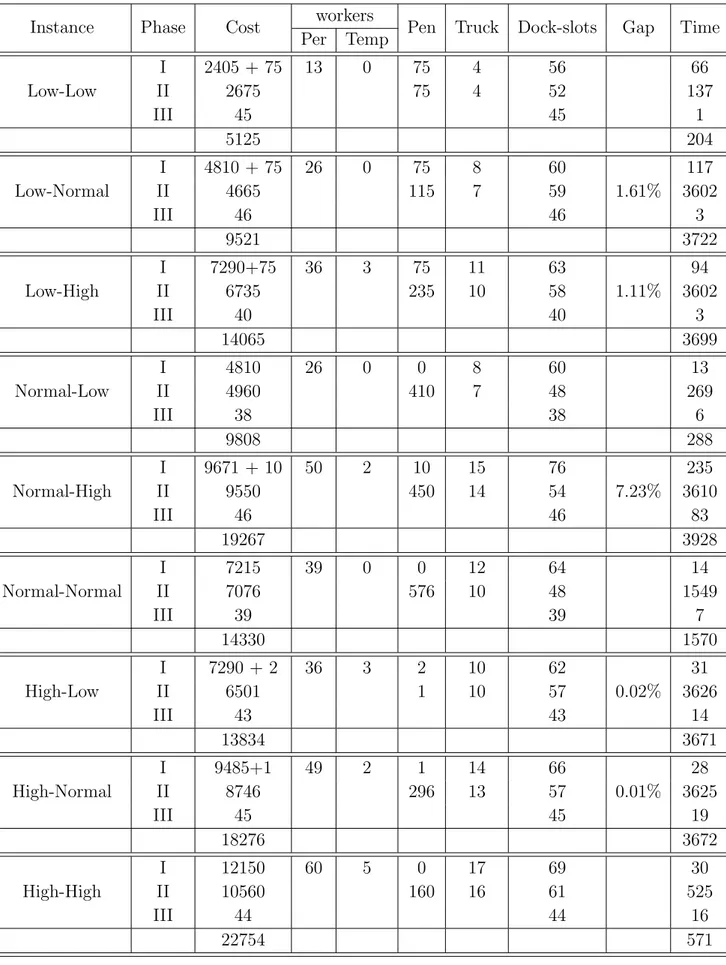
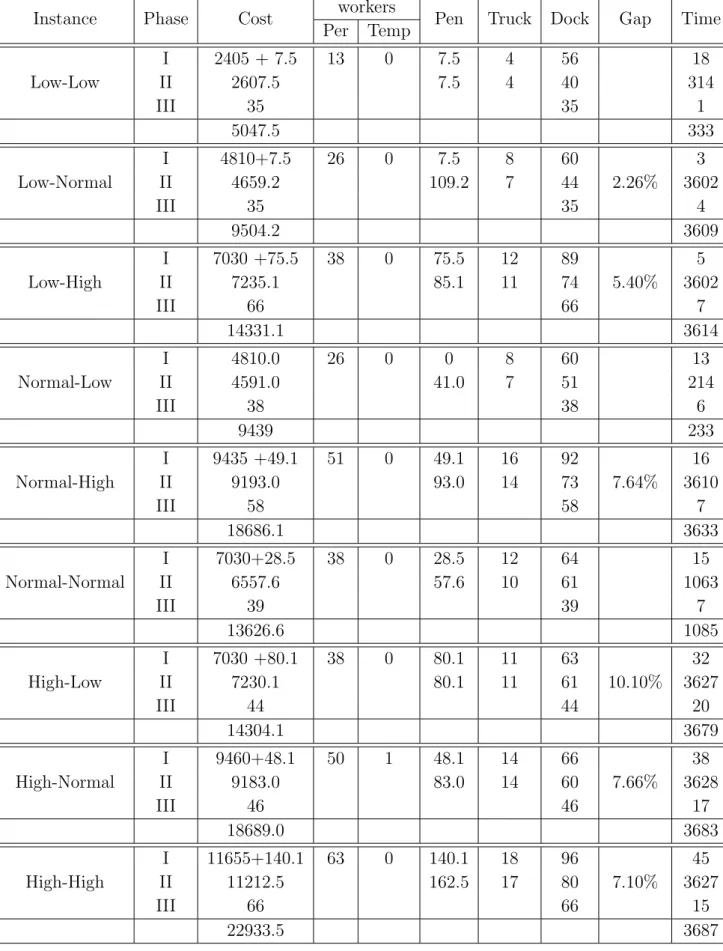
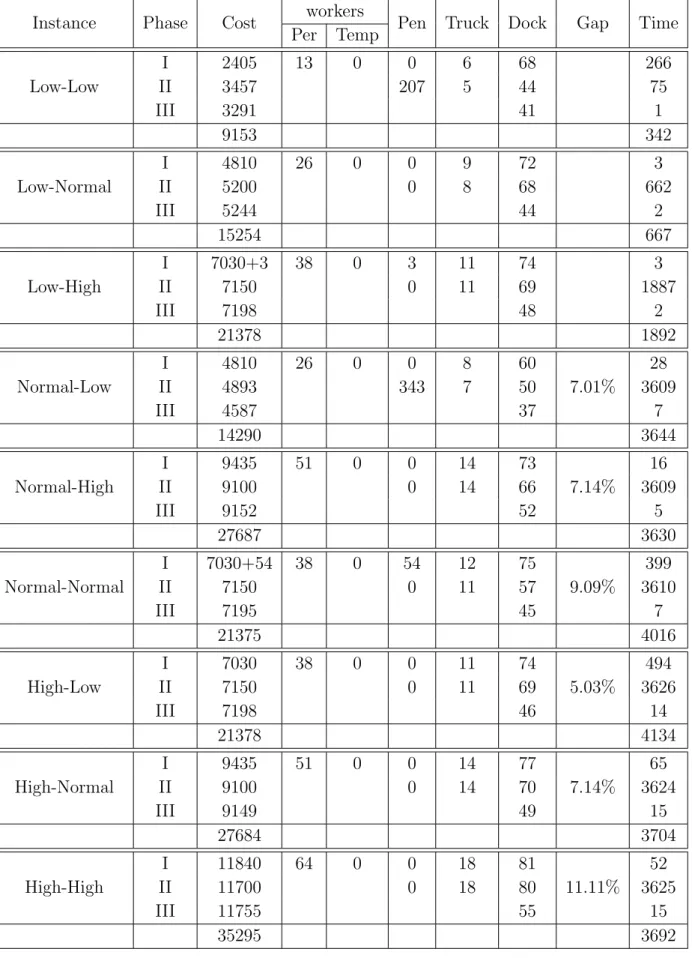
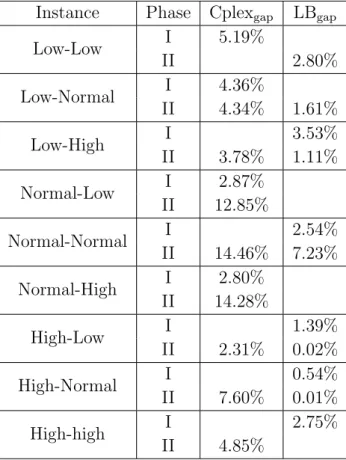
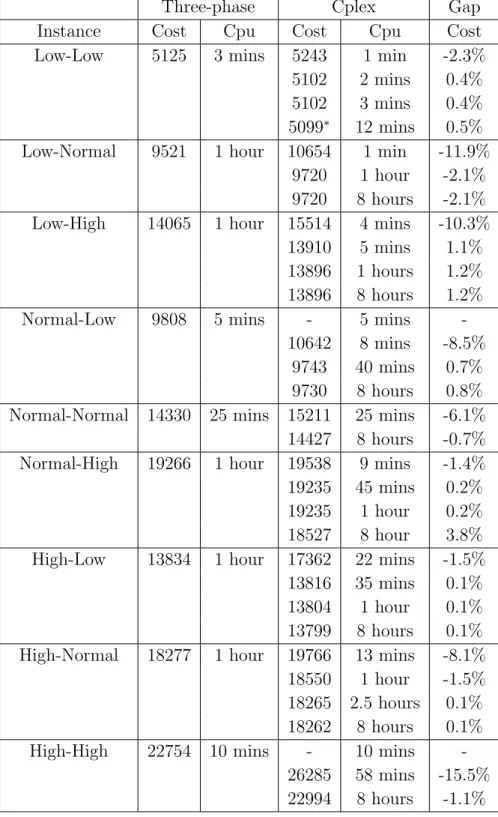
(11) Thèse de Bayrem Tounsi, Lille 1, 2016. List of Tables 2.1 2.2. © 2016 Tous droits réservés.. 2.3 2.4 2.5 2.6. Results on the basic-instances . . . . . . . . . Algorithm performance on 5 instances created instance Normal-Low . . . . . . . . . . . . . . Results on reduced penalties . . . . . . . . . . Results on free normal to express change . . . Lower-bound effectiveness . . . . . . . . . . . Comparison with Cplex 12.6 . . . . . . . . . .. . . . from . . . . . . . . . . . . . . .. . . . . . . . . . the same basic. . . . . . . . . . . . . . . . . . . . . . . . . . . . . . . . . . . . . . . . . . . . .. 3.1 3.2 3.3. Average demand distribution . . . . . . . . . . . . . . . . . . . . . . . 64 Delivery modes parameters . . . . . . . . . . . . . . . . . . . . . . . . 65 Bounds, deterministic solutions and stochastic solutions. . . . . . . . 67. 4.1 4.2 4.3 4.4 4.5. Sensitivity analysis at t11 = t12 = t21 = t22 = 3. Comparison of estimated SUE and exact SUE. Heuristics comparison with default radius. . . Heuristics comparison with improved radius. . Heuristics comparison for a large instance with. . . . . . . . . . . . . . . . . . . . . . . . . 6 options.. . . . . .. . . . . .. . . . . .. . . . . .. . . . . .. . . . . .. . 39 . . . . .. . . . . .. 40 42 43 44 45. 98 98 99 100 102. lilliad.univ-lille.fr.
(12) Thèse de Bayrem Tounsi, Lille 1, 2016. © 2016 Tous droits réservés.. lilliad.univ-lille.fr.
(13) Thèse de Bayrem Tounsi, Lille 1, 2016. List of Tables. xi. Title: Contributions in the e-commerce supply chain: Integration in e-fulfilment and delivery services pricing. Abstract: All over the world, the growth of e-commerce has led to an increasing importance of the inherent supply chain. This thesis is dedicated to the study of two phases of the e-fulillment process. In the first part, we focus on picking and shipping operations conducted in the warehouse at the e-fulfilment process uphill. We propose a global model based on picking and shipping coordination, and tacticaloperational integration. The solution method proposed is based on decomposition of the problem into three phases and it was shown to significantly outperform commercial solver. Then, we propose a second model based on a mechanism with rolling horizon that captures the information knowledge and decision making dynamics. We present deterministic and stochastic approaches incorporated in the rolling horizon procedure in order to find good policies under demand uncertainty. In the second part of the thesis, we study a last mile delivery system offering two classical type of services: home delivery and pick up at relay station. We address a service pricing problem that takes into account the customers behaviour. Customers are sensitive to the tariff of a delivery service, but also to its quality. We propose a bi-level model where at the upper level, the provider control the services tariffs. At the lower level, users react by choosing their delivery service according to a utility function which includes the provider tariff and the perceived congestion. We model the customers reaction using a nested logit model and compute the resulting stochastic user equilibrium. Based on a local search that exploits a sensitivity analysis of the equilibrium choice probabilities, a new heuristic algorithm for the bi-level services pricing problem is proposed and compared to others existing approaches. Keywords: E-commerce logistics, coordination, integration, matheuristic, rolling horizon, stochastic, bi-level, discrete choice models, heuristics.. © 2016 Tous droits réservés.. lilliad.univ-lille.fr.
(14) Thèse de Bayrem Tounsi, Lille 1, 2016. © 2016 Tous droits réservés.. lilliad.univ-lille.fr.
(15) Thèse de Bayrem Tounsi, Lille 1, 2016. Chapter 1. Introduction. In developed countries, e-commerce logistics represent the latest big driver of change in logistics and physical distribution networks. The logistic industry has been innovating and mutating in order to follow the continuous growth of e-commerce. In France, for example, on-line sales have risen by 20% in 2013 and by 11% in 20141 . E-commerce logistics has evolved substantially over the past 40 years or so, impacting the organisation of the supply chain, involved actors, interactions between them and processes. Since the beginning of the 21st century, e-commerce began to rapidly expand with pure-play (internet only) retailers leading the way in developing e-fulfillment distribution networks 2 . In this thesis, we are interested in e-commerce business that generates physical flows, where the supply chain efficiency is a crucial success key. Along with the maturation of the on-line market and the generalized use of information and communication systems, the e-commerce supply chain has to meet new challenges related to all levels of infrastructure design, resources management and operations optimization. This introduction describes first a major actor in e-commerce supply chain; the third party logistics. Then, general description of the e-commerce supply chain is given. Finally, the contributions of the thesis are depicted.. 1.1. Third party logistics. In traditional commerce, customers buy and pick their goods in a shop. In ecommerce, customers order on-line and goods are delivered to them. What happens during the time a customer waits for his goods is crucial to his overall experience. The challenge of e-fulfillment is that many undesirable events can occur between the time an order is placed and when the customer receive the goods. Retailers improve continuously their business to offer good products at attractive prices, but they can miss the order, not have inventory to ship, enter a wrong shipping address. Not to mention that the package may never get there or the item can be damaged when it does arrive. Some of these mistakes can be eliminated when using a service whose logistic is the core competence and that specializes in the e-fulfillment defined as the steps 1. http://www.fevad.com/espace-presse/les-ventes-sur-internet-en-hausse-de-16-au-2emetrimestre-2013 2 http://cerasis.com/2014/04/30/e-commerce-logistics/. © 2016 Tous droits réservés.. lilliad.univ-lille.fr.
(16) Thèse de Bayrem Tounsi, Lille 1, 2016. 2. Chapter 1. Introduction. involved in receiving, processing and delivering orders to end customers. The development of e-commerce induced the emergence of third party logistics providers (3PL). A third-party logistics provider is a firm which provides outsourced logistics services for part, or all of its customers’ supply chain management functions 3 . Services include warehousing and distribution, but also administration and customs procedures. The relation between a 3PL and its clients can vary from providing the basic logistics activities to a full integration of logistics function. For the clients, this organisation results in cost and time saving, low capital commitment, focusing on the core business and flexibility. The global 3PL market reached 750 billion USD in 2014, and grew by 157 billion USD in the US while demand growth for 3PL services in the US (7.4%) outpaced the growth of the US economy in 2014 4 . E-fulfillment services help retailers provide a better customer experience by offering faster shipping times, guarantee well-packed items, consistent on-time delivery, and an easy return process. Nowadays, the fulfillment is a competitive advantage. Retailers with a reliable and efficient fulfillment process gain a competitive advantage in the market. The 3PL, like our project partner5 , offers a global support dedicated to ecommerce shop, including the conception of logistic sites and equipments, the modelling and the optimization of process, the management of demand variation and peaks, etc.. 1.2. E-commerce supply chain. In commerce, supply chain management (SCM), the management of the flow of goods and services, involves the movement and storage of raw materials, of work-inprocess inventory, and of finished goods from point of origin to point of consumption. Interconnected or interlinked networks, channels and node businesses combine in the provision of products and services required by end customers in a supply chain. Supply-chain management has been defined as the design, planning, execution, control, and monitoring of supply chain activities with the objective of creating net value, building a competitive infrastructure, leveraging worldwide logistics, synchronizing supply with demand and measuring performance globally 6 . All along the different phases thousands of decisions and more are taken related to planning and operations management. Classically in SCM, three levels of decisions are defined [Anthony 1965]: -Strategic level : includes long term decisions that establish the bases of the 3. https://en.wikipedia.org/wiki/Thirdparty logistics http://www.3plogistics.com/big-deal-2014-3pl-results-and-2015-estimates/ 5 http://www.dhl.fr/fr/logistique/solutions de chane logistique/ce que nous faisons/efulfillment.html 6 https://en.wikipedia.org/wiki/Supply chain management 4. © 2016 Tous droits réservés.. lilliad.univ-lille.fr.
(17) Thèse de Bayrem Tounsi, Lille 1, 2016. 1.2. E-commerce supply chain. 3. development of the supply chain, like for example the design of the supply chain structure. -Tactical level : includes mean term decisions that deal with the organisation of regular activities, like for example the quantities of flows and resources. -Operational level : includes short term decisions that gives detailed instructions for immediate execution, like for example jobs scheduling. The issues of SCM are different as we are in a Business to Business (B2B) case or a Business to Consumer (B2C) one, regarding problem characteristics and service requirements. The durations of decisions vary from an application to the other. They depend on many parameters like data acquisition frequency or resources’ characteristics. In e-commerce for example, operational decisions are set every hour since orders are made continuously and need to be processed. While tactical decisions like the number of temporary workers to use can be set at daily base. The e-commerce supply chain (ESC) is a complex system that involves a wide and multi-modal transportation network and manages several physical flows. Several studies highlighted the strengths needed for efficient ESC : reliability, flexibility and profitability.. 1.2.1. E-fulfillment network. The design of the distribution network is the core of big investment and the distribution strategy. The facilities location have to find trade-off between costs and delivery efficiency. Figure 4.1 depicts an example of an e-fulfillment network. Traditional ecommerce activity is based on a warehouse that stores all products and cover a wide geographical area (a country or even more). We detail in chapter 2 the structure and the operations of the warehouse. The transportation network is structured with delivery centres which handle the final delivery. These centres are the starting point of the last mile delivery segment that ends at the customer’s home or at a designated collection point. Shoppers online want to choose the location of the delivery. Last studies shows that 66% of french e-shoppers prefer the delivery at a relay point 7 . The relay point is usually a shop that makes a partnership with the retailers to offer the possibility to receive and deposit delivered goods so that end customer can pick them later.. 1.2.2. Transportation in e-commerce. In e-commerce, the main physical flow is the fulfilment flow, or direct, flow. It insures the replenishment and the delivery of online ordered goods. The direct flow is divided in two physical flows : upstream and downstream [Agatz 2008]. 7. © 2016 Tous droits réservés.. http://www.fevad.com. lilliad.univ-lille.fr.
(18) Thèse de Bayrem Tounsi, Lille 1, 2016. 4. Chapter 1. Introduction. Warehouse. Delivery center. Delivery center. Relay. Relay customers. customers. Figure 1.1: The e-fulfillment network The upstream flow replenishes the warehouse by products coming from providers to be stocked in the warehouse. These operations are usually done long time before products are up for sale online. We do not consider this flow in this thesis, and even if it is part of the fulfilment, we will use fulfilment to refer to the downstream flow. As in any supply chain, transportation is more than crucial in e-fulfillment. Once shipped from the warehouse, parcels make a long journey to reach the end customer. The journey is made of consecutive segments and combines different transportation modes. In e-commerce transportation includes also the management of the returned parcels.. 1.2.2.1. Long-haul transportation. The downstream flow is initiated every time an order is received by the warehouse. The order is picked and the formed parcels are shipped from the warehouse to be delivered to the customer. The warehouse is designed to cover customers scattered in a wide geographical area. Parcels shipped to the same region are consolidated in pallets and shipped according to a transportation mode. The first segment is the transportation from the warehouse to a regional delivery centre. Transportation is usually performed by Less-Then-Truckload carrier. The long haul freight transportation generally analyses multicommodity transportation systems at a regional, national or global level [Crainic 2003]. It combines several modes including rail, truck, ship, etc. The performance of such system is evaluated regarding different, and sometimes conflicting criteria like cost, safety and pollution. It rises strategic design decisions related to the network and services design involving big investments. It also includes planning and management issues related to resources allocation and journeys’ scheduling.. © 2016 Tous droits réservés.. lilliad.univ-lille.fr.
(19) Thèse de Bayrem Tounsi, Lille 1, 2016. 1.2. E-commerce supply chain 1.2.2.2. 5. Last-mile delivery. The second e-fulfilment segment is the transportation of parcels from the regional centre to end users. At the regional delivery center, parcels are shipped directly to end users home or dropped in relay stations, generally shops. The second segment is then the last segment in direct contact with the end user. Generally, distances done in this phase are small compared to the previous phase. Thus we speak about Last-Mile delivery problem. For both delivery options, trips need to be planned to serve a set of destinations. But the delivery problem is different as the option is home delivery or at a relay station. For home delivery a trip serves a big number of customers, scattered and with little delivered parcels (often only one). Inversely, a trip for delivery to a relay station includes a limited number of depots with many delivered parcels. Moreover, home delivery must be done during a time window defined by either the delivery company or the customer. While the delivery at a relay station is free of such constraint. Thus, the delivery resources and the planning of the trip are specific to each option. Home delivery can be addressed as a variant of the vehicle routing problem with a fleet of vehicles and customer time windows like in [Cattaruzza 2015a]. Vehicles can perform more than one trip. The planning deals with the clustering of customers into trips and the routing of each trip. Regarding drivers, trips must respect the maximum legal driving time per day and the legal time breaks. Delivery at relay station is close to city’s freight distribution systems or city logistics. City logistics rely on consolidation to provide the best trade-off between operations efficiency and resources utilization [Crainic 2009]. At the delivery center parcels are sorted by relay station, then vehicles load are composed to serve a set of stations.. 1.2.2.3. Returns. For online customers, the ability to easily return purchased items is an important part of the buying decision. For online sellers, the ability to effectively handle these returns is critical to customer satisfaction. Customers should know how and where to send returns, while the e-fulfilment service should set how returns will be handled once they arrive back at the warehouse. Customers can return items in different ways. They can post them back to the warehouse and then get the shipping cost refunded. Or they can drop it at a relay station, and the e-fulfillment company handles the transportation of returns to the warehouse. The management of the return flow in e-commerce leads naturally to additional transportation issues that are close to what is known as Reverse Logistics. Advanced systems combine the delivery with returns by planning a pick up and drop trips.. © 2016 Tous droits réservés.. lilliad.univ-lille.fr.
(20) Thèse de Bayrem Tounsi, Lille 1, 2016. 6. 1.3. Chapter 1. Introduction. Contributions. Our contributions aim to give a general understanding of e-commerce supply chain and also to design efficient tools for e-fulfilment management. We focus particularly on two issues: - The coordination and integration of decisions in e-fulfilment management. - The design of last-mile delivery services under customer choice. More precisely, our first contribution, presented in chapter 2, deals with warehouse management, by investigating the benefits of two capital innovations. The first is the coordination between order picking and shipping schedules. These two phases are classically done separately and sequentially, which leads in high activity to strained situations. The proposed model is an approach for enhancing the supply chain flexibility by considering alternative actions like order postponement or shipping mode change. The second innovation of the model is the integration of tactical and operational decision over a multi-period planning horizon. In fact the optimization of processed quantities enables smoothing peaks and better resources usage, but ignoring the operational constraints results in infeasible solution. The tactical-operational integration is a safe approach for a better resource usage and consequently global cost reduction and profitability. The proposed model is computationally challenging. Several costs of different nature are taken into account including labour and trailers. Also there are penalties related to orders postponement or mode changes. The model looks for a planning through both tactical and operational decisions. It incorporates a large set of constraints related to order picking and to shipping schedules. The classical solution methods fail to provide an optimal solution. We then propose an advanced heuristic method capable of providing good solution at reasonable computation time. The second contribution, presented in chapter 3, focus on a main difficulty of e-fulfillment management related to the uncertainty of demand. In practice, a planning decision aims to take decisions related to future activities based on data. Although forecast models are usually used for a-priori data estimation, there are always errors compared to a-posteriori revealed data. Those errors can be more or less important and deteriorate the optimality of the planning or lead to constraint violation. Such situations are of course undesirable since they affect seriously the reliability of the supply chain. We introduce a second model with rolling horizon that reflects better the information acquisition process. The model also enables us to include stochastic information of future periods in different fashions. We evaluate the performance of stochastic methods and deterministic policies with classical lower and upper bounds.. © 2016 Tous droits réservés.. lilliad.univ-lille.fr.
(21) Thèse de Bayrem Tounsi, Lille 1, 2016. 1.3. Contributions. 7. The third contribution, presented in chapter 4, studies last-mile delivery system with two family of services: home delivery and pick up at relay station. In this part of the e-commerce supply chain several decision actors interact. There are two interactions. The first one is between the delivery company and the customers. The second interaction is between the customers themselves through congestion effect. The originality of our contribution is twofold. The first is the formulation of company-customers interaction as a bi-level model. At the upper level, the provider controls services’ tariffs. At the lower level, customers react by choosing their delivery service according to a utility function. The second originality is the integration of customers behaviour. In addition to tariffs, the utility function includes a congestion measure depending on the service. Due to correlation between services of the same family we use a nested Logit model and compute the resulting stochastic user equilibrium. A sensitivity analysis of the SUE is then conducted, it gives explicit expression of the derivatives of customers’ decisions with respect to services’ tariffs. Based on a local search that exploits the derivatives information, a new heuristic algorithm for the bi-level services design problem is developed and compared to others existing approaches. The e-commerce supply will continue to attract research and we expect more innovation in e-commerce logistics regarding demand forecast, delivery and real time order tracking.. © 2016 Tous droits réservés.. lilliad.univ-lille.fr.
(22) Thèse de Bayrem Tounsi, Lille 1, 2016. © 2016 Tous droits réservés.. lilliad.univ-lille.fr.
(23) Thèse de Bayrem Tounsi, Lille 1, 2016. Chapter 2. Integration in E-fulfilment optimization. The works presented in this chapter were published in the conference Odysseus 2015 [Cattaruzza 2015b].. Contents 2.1. Introduction. 2.2. Warehouse description . . . . . . . . . . . . . . . . . . . . . . 10. 2.3. 2.2.1. Replenishment . . . . . . . . . . . . . . . . . . . . . . . . . .. 11. 2.2.2. Order picking . . . . . . . . . . . . . . . . . . . . . . . . . . .. 11. 2.2.3. Packages shipping . . . . . . . . . . . . . . . . . . . . . . . .. 12. 2.2.4. Picking and shipping coordination . . . . . . . . . . . . . . .. 12. 2.2.5. Resources optimization. . . . . . . . . . . . . . . . . . . . . .. 13. 2.2.6. The integrated picking and shipping problem . . . . . . . . .. 13. State of the art . . . . . . . . . . . . . . . . . . . . . . . . . . . 15 2.3.1. Lot-sizing . . . . . . . . . . . . . . . . . . . . . . . . . . . . .. 15. 2.3.2. Functional coordination . . . . . . . . . . . . . . . . . . . . .. 16. 2.3.3. Decisions Integration . . . . . . . . . . . . . . . . . . . . . . .. 17. 2.4. Problem definition, notation and model . . . . . . . . . . . . 18. 2.5. A three-phase matheuristic . . . . . . . . . . . . . . . . . . . 26. 2.6. 2.7. © 2016 Tous droits réservés.. . . . . . . . . . . . . . . . . . . . . . . . . . . . . 10. 2.5.1. Phase I - Production capacity . . . . . . . . . . . . . . . . . .. 28. 2.5.2. Phase II - Reassignment and postponement . . . . . . . . . .. 29. 2.5.3. Phase III - Dock management . . . . . . . . . . . . . . . . . .. 29. 2.5.4. Speed-up techniques . . . . . . . . . . . . . . . . . . . . . . .. 30. Computational results. . . . . . . . . . . . . . . . . . . . . . . 36. 2.6.1. Instance generation . . . . . . . . . . . . . . . . . . . . . . . .. 36. 2.6.2. Discussion . . . . . . . . . . . . . . . . . . . . . . . . . . . . .. 37. Conclusions . . . . . . . . . . . . . . . . . . . . . . . . . . . . . 46. lilliad.univ-lille.fr.
(24) Thèse de Bayrem Tounsi, Lille 1, 2016. 10. 2.1. Chapter 2.. Integration in E-fulfilment optimization. Introduction. An e-commerce business is based on a warehouse that stores all products and covers a wide geographical area (a country or even more). The warehouse is the heart of e-commerce activities where upstream supply chain phases, replenishment and storage, and downstream supply chain phases, orders picking and shipping, are closely conducted [Agatz 2008] [Gu 2006]. In this chapter we focus on downstream process in order to investigate the potential advantages on cost reduction of jointly scheduling orders picking and shipments. Main costs of e-fulfillment are related to resources required for performing orders picking, workers, and for shipping, trucks. In a standard organisation, where picking and shipping are not jointly determined, activity peaks results in bottleneck situations. To handle such situations temporary workers are usually hired to enhance the permanent team. Such policy is however costly. Thus we define a new global approach based on the integration of resources determination and operation planning. The latter includes the coordination between picking and shipping. In addition, different delivery options, called modes, are offered to customers. Each mode is associated with different trucks that guarantee different delivery times (packages are delivered within 3-5 business days for the normal mode, and within 24 hours for the quick mode). The coordination enlarges the set of possible actions that improve the process flexibility and resources productivity. First, orders can be postponed and prepared during a day later than the one of arrival. Second, an order is allowed to be assigned to a mode different from its default one. Our approach looks for a global efficient planning that takes into account the impact of postponements and mode changes on the process of future demand. In section 2.2 we describe the e-fulfilment process, and we give a state of the art of related works in section 2.3. A mathematical formulation of the integrated e-fulfilment problem is introduced in section 2.4. The section 2.5 is dedicated to decomposition based matheuristic proposed for solving the problem. In section 2.6 we describe the numerical experimentations and comment the results. Finally, we conclude the chapter in section 2.7.. 2.2. Warehouse description. The warehouse is at the heart of an e-commerce business. This platform requires a flawless organisation including replenishment, inventory management, order picking and shipping. Warehouse management systems are continuously elaborated and optimized in order to improve efficiency and profitability and meet the online sales growth. We can distinguish three principal zones in a classical warehouse: storage zone, packing workshops and shipping docks (see figure 2.1).. © 2016 Tous droits réservés.. lilliad.univ-lille.fr.
(25) Thèse de Bayrem Tounsi, Lille 1, 2016. 2.2. Warehouse description. 11 Warehouse. Storage zone. Docks. Workshop. Picked Packets. Packages. Figure 2.1: The warehouse structure We now describe the main phases of e-fulfilment that are carried out in the warehouse.. 2.2.1. Replenishment. The replenishment of the warehouse is the first phase of e-fulfillment. Goods are received, counted, inspected, labelled, indexed in the warehouse management software and stored. Replenishment is optimized based on inventory management theory to find the good trade-off between reactivity and profitability. The problem of managing the inventory can be addressed for example using multi-echelon theory [yu Kevin 2005], [Alptekinoglu 2005]. It aims to determine the base-stock levels and the warehouse replenishment (from providers) strategies in a way that minimizes transportation, inventory handling and backordering costs. E-commerce enables shoppers to make orders at any time and from anywhere and thus it helps increase the sales. As a consequence, the inventory management is more challenging. After replenishment, the warehouse is ready to receive and process orders. In this thesis we do not study e-commerce replenishment issues, we rather focus on the downstream flow that deals with the process of orders.. 2.2.2. Order picking. When a customer orders a set of items, the latter are picked off the shelves by one of the workers and transported to an order packing workshop. There, a worker makes a quality control, selects the packaging materials, scans items, adds protection and bill, seals the box, and then moves it to one of the shipping dock. Different order picking methods can be employed in a warehouse, for example single-order picking, batching and sort-while-pick, batching and sort-after-pick, single-order picking with zoning, and batching with zoning [Gu 2006]. Many ecommerce retailers outsource their order fulfilment, as they simply don’t have the. © 2016 Tous droits réservés.. lilliad.univ-lille.fr.
(26) Thèse de Bayrem Tounsi, Lille 1, 2016. 12. Chapter 2.. Integration in E-fulfilment optimization. in-house experience, expertise or technology to process orders efficiently.. 2.2.3. Packages shipping. Once an order has been picked and packed, it is moved to a shipping dock and loaded in the corresponding truck. The shipping truck depends on the delivery option (quick/ normal). In addition, some goods, like fragile or big ones, are transported by a specific service. Also for a given mode, different levels of service are generally offered, since some customers are ready to pay more if they can receive their goods earlier. The 3PL is responsible for efficient journey’s design for each order under tariff and delay commitment. The 3PL manages several transportation contracts with different partners, each of them having its own conditions regarding tariffs and volumes. This particular environment, that we call multi-mode shipping, impacts the warehouse structure, order picking process and also the use of human resources.. 2.2.4. Picking and shipping coordination. Traditionally order picking and shipping are done separately. Orders are processed in the order of their reception, while a zone close to the docks is dedicated to packages before shipping. This situation may lead sometimes to bottlenecks in high activity period. A problem in an order’s process, or related to a shipping truck impacts the overall activity. This leads us to suggest the coordination of the two phases. Coordination can be defined as the simultaneous consideration of two or more processes or functions, that are usually sequential and interdependent, in order to improve global efficiency. Performing jointly order picking and shipping leads in some situations to improve resources use regarding the demand configuration. The use of resources at the picking phase (workers) can be planned with respect to the available shipping resources (trucks) and their departure schedule. In this way, a situation where picked orders can not be shipped because of missing truck’s capacity can be avoided. When the decision of picking an order is taken, simultaneously the shipping is scheduled. On the ground, the loading of trucks is jointly done with the order picking. This implies that the two phases are more connected and inter-dependant. For example, the picking of an order cannot start unless a truck of the assigned mode is at docks. The coordination opens a field to improve flexibility and resource use. Order processing is no more a simple first in first out process without taking into account global needs and resources. Coordination enables consolidation and helps avoiding extreme and difficult situations. For example an order can be postponed if it is costly at the moment, an order can be switched to a different shipping mode from the one selected by customer. Some of these decisions may not be costless, they also can cause customer disappointment, but they lead to improve the overall performance.. © 2016 Tous droits réservés.. lilliad.univ-lille.fr.
(27) Thèse de Bayrem Tounsi, Lille 1, 2016. 2.2. Warehouse description. 2.2.5. 13. Resources optimization. As in every business profitability comes with optimization of resources. The resource levels should lead to the best trade-off between customers satisfaction and costs. In some application, when resources are scarce, an order can only be partially satisfied. This can be acceptable by the customer. In e-commerce, an unmet order results in the loss of customer, and a negative image of the retailer. On the other hand, an unused resource or a resource not used at its best productivity is a wasted profit. In e-fulfilment the demand is known a very short time before the start of processing and it fluctuates from day to day. This aspect highlights the specificity of e-fulfilment with respect to production problems or transportation problems where demand is known in advance. Resources required in e-fulfillment are mainly workers and trucks. Workers are in charge of the picking and shipping operations. They are of two types: permanent and temporary. The number of permanent is known in advance. Temporary workers can be hired to work at least for one shift that represent a fixed number of hours. Temporary workers have a higher cost than permanent ones, and they are used to handle activity peaks. The average productivity of a worker is computed as the average amount of order fulfilled by a worker in an hour. Picking requires more time than packing and loading, and the number of picked products is a linear function of the number of workers. We thus assume that an increase in demand would increase the total number of workers linearly. In the problem studied in this section, the number of trucks is determined for each shipping mode. Traditionally the number of trucks per day is set in advance in a contract over a given term. It is crucial to determine appropriately the number of trucks. Undersized truck capacity would induce unmet demand. Since the shipping capacity bounds the quantity of packages picked, undersized capacity can also result in an underuse of workers. On the other side oversized capacity generates high costs. In extreme cases, it is possible to increase ad hoc the number of trucks at a prohibitive additional cost. After describing the main operations in picking and shipping phases, and highlighting difficulties and challenges, we introduce in the following section our approach that provides a global framework for e-fulfilment optimization.. 2.2.6. The integrated picking and shipping problem. We highlighted earlier that the success of an e-fulfilment system depends on its flexibility and profitability. Our approach aims to improve these criteria by coupling two features: the integration of tactical and operational decisions and the coordination between picking and shipping phases. The integration considers simultaneously tactical and operational decisions. The first are related to the determination of the number of workers and the number of trucks. The second include orders processing and trucks moves (docking and. © 2016 Tous droits réservés.. lilliad.univ-lille.fr.
(28) Thèse de Bayrem Tounsi, Lille 1, 2016. 14. Chapter 2.. Integration in E-fulfilment optimization. undocking). We use later IPSP to refer to the integrated picking and shipping problem. The problem is defined over several days to allow postponement of orders process. The tactical-operational integration takes into account picking and shipping process in the resource allocation. Indeed considering only the global demand to compute the required resources may lead to the violation of some constraints and consequently to an infeasible planning. For example the manager needs to know the number of workers at each shift and not just the workforce corresponding to the global demand. Also all orders assigned to a mode have to be processed before a fixed departure time slots. In addition, docks are at a limited number. So it is necessary to control the movement of trucks and to know docks state (busy or free). Looking at operations process, orders contain one or more items and they generate one or more packages. The process of one order can be divided and partially made during different time. Thus order process is addressed by a lot-sizing model. More precisely we consider a planning horizon of several periods where a period represents a working day. A period is composed of T time slots, a slot representing a duration of one hour in practice. For workers management, a period is also divided into disjoint and consecutive shifts. During each shift, a given number of permanent and temporary workers are in charge of processing orders. Each period is associated with a given number of orders. The process of an order is to determine the exact number of packages that are prepared at each slot, for every order of every period. A demand with a volume greater than one can be prepared during different and not necessarily consecutive slots. As new packages are made they are immediately loaded in trucks. The packages of one order can be made during different slots and loaded in different trucks, but they have to be assigned to the same delivery mode. The coordination between picking and shipping implies that when packages are made, a truck of the corresponding mode is present at the docks to be charged. The warehouse is equipped with a limited number of docks that bounds the number of trucks that can be simultaneously charged. Each truck contains only packages of orders associated with a specific delivery mode. Then, if different modes are involved at a given slot, at least one truck for each mode has to be present at the docks. Moreover, at each slot the number of packages that are processed takes into account the total workers productivity the total trucks capacity. The coordination between picking and shipping in IPSP enables mode change. Indeed, it is possible to deliver an order with different mode than the one chosen by the customer. In that case a penalty needs to be paid. This penalty represents the extra cost needed to deliver the order in the case the change is from the normal mode to the express mode. It quantifies the dissatisfaction of the customer for a delivery delay in the opposite case. In addition, as the problem addressed is multi-period problem, the possibility to postpone the process of an order to a future period is also allowed. As a counterpart, a penalty is paid when the postponement causes a. © 2016 Tous droits réservés.. lilliad.univ-lille.fr.
(29) Thèse de Bayrem Tounsi, Lille 1, 2016. 2.3. State of the art. 15. delay. When an order is postponed to a future period, all its packages are made during that period. Mode change and order postponement occur when they improve resources use. The two strategies can also be combined, when an order associated with the normal mode can be delivered with the express mode of the day after. In summary, IPSP looks for an operational plan that minimizes the total cost of orders picking and shipping over a number of periods computed as the sum of workers (fixed and temporary) cost, trucks cost and the penalties generated by mode changes and order postponements. In addition, considering that the number of docks is a critical resource, the solution of IPSP minimizes their total use computed as the sum of occupied docks at each slot.. 2.3. State of the art. In this section a revue of literature related to IPSP is presented. We focus on lot-sizing problems, coordination problems and integration problems.. 2.3.1. Lot-sizing. The joint picking and shipping process studied in this chapter is close to capacitated multi-item lot sizing problem classically used to model and solve production, manufacturing and inventory problems [Karimi 2003] [Gicquel 2008] [Lee 2013]. In its general form the lot-sizing problem aims to determine the quantities of one product or of a set of products to meet the demand at each period of an interval of time, having that no shortage is allowed. The solution finds the optimal trade-off between production costs, set-up costs and inventory costs. Producing large quantities reduces setup cost but in the same time increases inventory costs. The problem can be uncapacitated or capacitated when a constraint on the total quantities produced at each period have to remain under a bounding level. The capacitated lot-sizing problem (CLSP) is known to be NP-hard [Karimi 2003]. As in lot-sizing, the solution of IPSP determines periodically produced quantities. However, the difference is about the decisions frequency which is higher in IPSP. Another common point between CLSP and IPSP is the existence of flow conservation constraints. In CLSP, these constraints insure transition between production and inventory, while in IPSP, the balance is between production and loading. IPSP differs from CLSP in that several capacities are involved and they are variable. In [Helber 2013] a variant of lot-sizing is considered where in addition to an available capacity, an overtime is added when needed. When demand shortage is allowed, it is possible to delay the process of a part of the demand. This usually adds a backlog cost in the objective function and the resulting problem is more difficult to solve. An other feature that affect the modelling and the complexity of CLSP is the setup cost structure. For example,. © 2016 Tous droits réservés.. lilliad.univ-lille.fr.
(30) Thèse de Bayrem Tounsi, Lille 1, 2016. 16. Chapter 2.. Integration in E-fulfilment optimization. a carry-over setup cost is only applied if the product was not produced in the last period. In some application the setup cost depends on the production sequence. Lot-sizing problems involves cost function with different structures. The initial CLSP considers only costs with linear functions. While the costs in [Lee 2013] include a piecewise linear function and a piecewise constant function. The complexity of the problem and the solution approach depends on the structure of the considered costs. The IPSP consider three main costs: the cost of workers, the cost of trucks and the penalties. The cost of workers and the cost of trucks are piecewise constant functions of the number of processed orders. Each function has a particular structure depending on the resource characteristics (unit cost, capacity, productivity). Such resource cost are classically used in CLSP. The cost of penalties function is a linear function of the postponed orders and it is similar to backlogging cost.. 2.3.2. Functional coordination. Coordination is a key function in modern management. A big company for example is composed by a set of departments, and each one is in charge of one phase of the final output. Phases are sequential and interdependent. In IPSP for example, for a package to be loaded for shipping, the corresponding order has to be picked before. Thus it is necessary that the planning of one department activity takes into account some informations from dependant departments to insure a satisfying fluidity that is beneficial for the global process. Typically a person or a group, a coordinator, is in charge of insuring the planning of activities and the communication between departments. Coordination is as well addressed as an optimization problem where two or more planning, corresponding to different process phases, are jointly determined taking into account inter-dependencies and optimizing a global objective. The terms of synchronization or integration are also used to refer to coordination. Although in this thesis we make a distinction between coordination and integration. Our understanding for the latter is detailed in the next section 2.3.3. In [Chen 2010] author survey works on production and distribution coordination. This problem can be identified in many applications where production and distribution are consecutive in a short time: e-commerce, perishable products, computer, etc. In [Z.L. Chen 2005], the production planning, modeled as a scheduling problem, is coordinated with a distribution problem, modeled as a vehicle routing problem. In [Baptiste 2008] production is coordinated with shipment schedules: production lines prepare batches that are subsequently charged into trucks and shipped to final destinations. The problem consists in planning the production in order to ship full truck and minimize the delivery costs. In [Wang 2005] the problem is to coordinate production scheduling of jobs with the selection of delivery mode. The objective is to minimize delivery cost under. © 2016 Tous droits réservés.. lilliad.univ-lille.fr.
(31) Thèse de Bayrem Tounsi, Lille 1, 2016. 2.3. State of the art. 17. job delivery dates. the production stage is modeled as a scheduling problem on one machine. The delivery stage consider that jobs can be immediately shipped after production, while in other application, shipping can only starts at fixed dates. In the problems addressed in [Cetinkaya 2005] [Lee 2003] inventory replenishment is coordinated with outbound shipments schedule in a multi-period problem. The optimal solution specifies how often, and in what quantities, the stock should be replenished at the warehouse, and how often an outbound shipment should be released so that transportation scale economies are realized and customer requirements are satisfied at a minimal cost. Transport costs are the cost of used cargo and penalties due to early delivery and late delivery. IPSP differs from the cited works in that coordinated phases, order picking and shipping, are modelled with higher level of detail, at the operational level.. 2.3.3. Decisions Integration. The second main feature of the proposed approach in this chapter is decision integration. Decisions in e-fulfilment, as it is the case in many planning problems, are of three levels. Classically, first, strategic decisions are determined and implemented for a long term. Then, with a higher frequency, mean term tactical decisions are taken. Strategic and tactical decisions define the environment in which operational decisions which execute concretely the process are determined on a daily or hourly base. Decision integration is the joint determination of decisions of different levels. Decisions integration is different from functional coordination in that the first is vertical while the second is horizontal. An integrated problem includes for example strategic and tactical decisions or tactical and operational decisions. Since IPSP belongs to the second case, we limit the literature revue here to tactical-operational integration. Tactical decisions in IPSP are related to the resources: workers and trucks. They include the number of truck for every mode and the number of permanent and temporary workers for every shift. While the operational decisions include at every slot processed orders and truck moves in the docks. Tactical-operational integration in planning problems attracts increasing interest as an approach to match resources with process requirements. It can be motivated by demand uncertainty which makes resources design a complex issue. Indeed, one traditional strategy of coping with demand’s fluctuation is to build up inventory during periods with low demand and meeting the demand in excess of production capacity from inventory [Atamturk 2001]. For various reasons (inventory costs, product value, ...) it is excluded for some companies to carry an inventory. Moreover in modern labour market, it is possible to use interim workers to enhance long term contracted workers during activity peaks making possible the practice of dynamic capacity adjustments. In such environment, companies look for efficient planning that integrates capac-. © 2016 Tous droits réservés.. lilliad.univ-lille.fr.
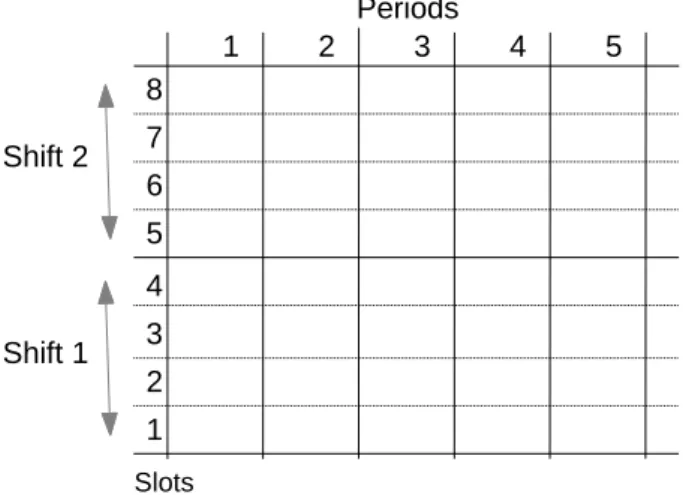
(32) Thèse de Bayrem Tounsi, Lille 1, 2016. 18. Chapter 2.. Integration in E-fulfilment optimization. ity allocation, subcontracting, production and inventory. This leads to integration of tactical and operational decisions. Pac et al. [Pac 2009, Alp 2006] studied inventory management with dynamic continuous capacity adjustments for handling the fluctuations more effectively. In [Pac 2009] authors address a dynamic approach for integrated problem involving tactical decisions (permanent workforce size and contracted number of workers) and operational decisions (temporary workers and produced quantities). A particular situation where a delay needs to be respected before temporary workers are available is studied in [Mincsovics 2009]. Pinker and Larson [Pinker 2001] develop a model for flexible workforce management in environments with uncertainty in the demand and in the supply of labor. The idea is to determine first regular workers and contingent workers levels over all the planning horizon. Jointly at each period, the allocation of temporary workers and overtime are decided to handle the stochastic demand under possible regular workers absenteeism. An application of joint workforce planning and operations management in mail treatment can be found in [Judice 2004]. The process of mails through a sequence of units is determined using short slots of time, while the staff planning is determined using shifts composed by a number of slots.. 2.4. Problem definition, notation and model. In this section, the IPSP is mathematically formulated. We consider a planning horizon of H periods, a period representing a period in practice, indexed in H = {0, . . . , H − 1}. For each period h ∈ H we need to process a number of orders Dh (indexed in Dh = {0, . . . , Dh − 1}). Orders revealed on period h need to be prepared ¯ = 0 indicates ¯ periods, indexed in H ¯ = {0, . . . , H ¯ − 1}. h in one of the following H that orders are not postponed. There are V available delivery modes, indexed in V = {0, . . . , V − 1}. Each order d ∈ Dh of period h is characterized by its • volume volhd , the number of packages it is composed; • mode vhd ; • time slot at which the order becomes known (release date of the order) rhd ; ¯ ¯ and assigning it to mode v. • penalty phvhd v for processing the order at period h + h ¯ = 1 corresponds to a postponement while vhd 6= v corresponds to a mode change h (p0vhd vhd = 0).. We assume that the penalty for postponing a package from a period h to a period ¯ or changing its mode is identical for all orders. h+h Each delivery mode v is characterized by its • departure slot tv . No truck associated with mode v will be available after tv .. © 2016 Tous droits réservés.. lilliad.univ-lille.fr.
(33) Thèse de Bayrem Tounsi, Lille 1, 2016. 2.4. Problem definition, notation and model. 19. All the trucks have the same capacity Q and the same cost ctruck . Moreover, Nmax is the number of available docks at the warehouse, thus at most Nmax trucks can be simultaneously loaded. Each period h is divided into the same number of shifts S, and each shift into the same number of slots T¯. It follows that each period is divided into T = S T¯ slots. Each shift s of period h is characterized by its • starting slot starths ; • ending slot endhs ; • cost for a permanent worker cper hs ; • cost for a temporary worker ctemp hs ; • number of packages a permanent worker can prepare prodper hs ; • number of packages a temporary worker can prepare prodtemp hs ; • maximum number of permanent workers emax hs . Trucks are managed according to the following truck movement policy. Each truck is assigned to one and only one mode and will distribute only packages assigned to that mode. Trucks can be made available at the docks at any slot. When a truck gets full during a slot, it is undocked by the end of that slot, and the dock it has occupied becomes free for use at the beginning of the next slot. Thus if a truck associated with a delivery mode gets full during a slot, and in the same time packages continue to be processed and assigned to that mode during the same slot, a new empty truck (or more) is (are) docked, and at that slot more than one dock are used by the same mode. If the truck is not fully loaded at the end of a slot, it remains docked for the next slot. Non-full trucks for mode v are undocked in two cases: at slot tv or if no more packages for mode v will be assigned to the corresponding mode during the following slots of the period. This policy achieves the least docks occupation having that an undocked truck will not be docked again. Over the planning horizon, IPSP aims to determine the number of workers and trucks, an order process planning that consists in identifying the exact slot during which each package of each order is processed, and a truck management planning (i.e., when to dock and undock truck) in order to minimize the sum of the workers cost, trucks cost, penalties, and the docks occupation. We introduce now the variables of the model. For each period h ∈ H, for each ¯h ∈ H, ¯ for each d ∈ Dh , for each mode v ∈ V and for each shift s ∈ S we have: • The tactical variables: per – zhs the number of permanent workers working on shift s of period h; temp – zhs the number of temporary workers working on shift s of period h;. © 2016 Tous droits réservés.. lilliad.univ-lille.fr.
(34) Thèse de Bayrem Tounsi, Lille 1, 2016. 20. Chapter 2.. Integration in E-fulfilment optimization. • and the operational variables: ¯. ¯ – xhv hd equals 1 if the order d of period h is prepared in period h + h and affected to mode v, 0 otherwise; – yhvt equals 1 if the number of empty trucks for mode v during period h at a slot t¯ ≥ t is not null, 0 otherwise; ¯ hvt ¯ indicates the number of packages of order d prepared in slot t of period h + h – fhd assigned to mode v;. – whvt is the number of docked trucks for mode v at period h in slot t; – uvt h is the number of empty trucks for mode v that are docked at period h in slot t; – khvt is the residual capacity of trucks at period h in slot t for mode v.. Before analysing deeply the model, it can be noted from variables x and f that orders are processed individually. The model offers a highly precise tracking of orders process information, and it is possible to return for each order the exact slot of its process. Such precise tracking is required in e-commerce for the management of the whole delivery journey of the order and also for the management of customer relationship. The objective function (2.1) is to minimize the cost of processing all the orders. This cost is given by the sum of four terms computed over the planning horizon. The first term is the sum of all penalties due each time the process of an order is postponed to a future period, or each time the delivery mode of an order is changed. The second term in the objective function is the total labour cost computed as the sum of all workers costs, while the third is the cost of the used trucks. The fourth term is a measure of the docks occupation, and it is incremented each time one of the dock is occupied by a truck during one time-slot. We express this term in dock-slot as it is the case when measuring an amount of work using man-hour or man-day units. Constraints (2.2) ensure that all the packages that compose an order are prepared. Constraints (2.3) and Constraints (2.4) impose that each order is assigned to only one mode and processed entirely during the same period. Constraints (2.5) forbid to prepare orders before their release date. Constraints (2.6) is the packages flow conservation: processed packages are loaded in an already docked truck with residual capacity or in an empty truck. These constraints are formulated differently for the first slot of each period. The reader can note the update of the trucks residual capacity at every slot. Constraints (2.7) (resp. Constraints (2.8)) force variables yhvt to be one (resp. zero) if (resp. if no) additional trucks for the mode v will be used. © 2016 Tous droits réservés.. lilliad.univ-lille.fr.
(35) Thèse de Bayrem Tounsi, Lille 1, 2016. 2.4. Problem definition, notation and model. 21. during the slot t or the slots after t of period h. X X per per X X XX ¯ ¯ temp phvhd v volhd xhv + (chs zhs + ctemp (IP SP ) min hd hs zhs )+ ¯ H ¯ v∈V h∈H d∈Dh h∈. + ctruck s.t.. h∈H s∈S. XXX. uvt h +. XXX. whvt. h∈H v∈V t∈T h∈H v∈V t∈T ¯ hvt fhd = volhd ∀h ∈ H, ∀d ∈ ¯ H ¯ v∈V t∈T h∈ X ¯ ¯ hvt fhd ≤ volhd xhv ∀h ∈ H, ∀d ∈ Dh , hd t∈T XX ¯ xhv ∀h ∈ H, ∀d ∈ Dh hd = 1 ¯ ¯ v∈V h∈H. XXX. (2.1) Dh. (2.2). ¯ ∈ H, ¯ ∀v ∈ V ∀h. (2.3) (2.4). 0vt = 0 ∀h ∈ H, ∀d ∈ Dh , ∀v ∈ V, 0 ≤ t < rhd fhd X X ¯ v0 v0 hv0 ∀h ∈ H, ∀v ∈ V f(h− ¯ + kh = Quh h)d. (2.5). ¯ H ¯ d∈Dh−h ¯ h∈ ¯ h−h≥0. X. X. ¯. v(t−1). hvt vt f(h− ¯ + kh = kh h)d. + Quvt h. ∀h ∈ H, ∀v ∈ V, 0 < t ≤ tv. ¯ H ¯ d∈Dh−h ¯ h∈ ¯ h−h≥0. (2.6) tv X. ¯. vt uvt h ≤ tv Nmax yh. ∀h ∈ H, ∀v ∈ V, 0 ≤ t¯ ≤ tv. (2.7). t=t¯ ¯ yhvt. ≤. tv X. ∀h ∈ H, ∀v ∈ V, 0 ≤ t¯ ≤ tv. uvt h. (2.8). t=t¯ v0 Quv0 h ≤ Qwh. Quvt h +. v(t−1) kh. v(t−1). Quvt h + kh X. ∀h ∈ H, ∀v ∈ V ≤ Qwhvt + Q(1 − yhvt ) v(tv −1). − kh. whvt ≤ Nmax. ≤ Qwhvt. ∀h ∈ H, ∀v ∈ V, 0 < t ≤ tv (2.9). ∀h ∈ H, ∀v ∈ V, 0 < t ≤ tv (2.10). ∀h ∈ H, ∀t ∈ T. (2.11). v∈V. X. X X. ¯. per temp temp hvt f(h− ≤ prodper ¯ hs zhs + prodhs zhs h)d. ¯ H ¯ d∈Dh−h ¯ v∈V h∈ ¯ h−h≥0. ∀h ∈ H, ∀s ∈ S, starths ≤ t ≤ endhs (2.12) per zhs ≤ emax hs. ∀h ∈ H, ∀s ∈ S. temp per zhs ≤ zhs ∀h ∈ H, ∀s ∈ S ¯ ¯ xhv hd ∈ {0, 1} ∀h ∈ H, ∀d ∈ Dh , ∀h ∈ yhvt ∈ {0, 1} ∀h ∈ H, ∀v ∈ V, ∀t ∈ T per temp zhs , zhs ∈ N ∀h ∈ H, ∀s ∈ S ¯ hvt ¯ ∈ H, ¯ fhd ∈ N ∀h ∈ H, ∀d ∈ Dh , ∀h © 2016 Tous droits réservés.. (2.13) (2.14) ¯ ∀v ∈ V H,. (2.15) (2.16) (2.17). ∀v ∈ V, ∀t ∈ T. whvt , khvt , uvt h ∈ N ∀h ∈ H, ∀v ∈ V, ∀t ∈ T. (2.18) (2.19). lilliad.univ-lille.fr.
(36) Thèse de Bayrem Tounsi, Lille 1, 2016. 22. Chapter 2.. Integration in E-fulfilment optimization. Constraints (2.9) and (2.10) combined enable to apply the truck movement policy explained earlier in this section. They update variables whvt that represent the exact number of docks occupied by the trucks associated to each mode at each slot. For constraints (2.9) a particular formulation that corresponds to the first slot of each period is given first. These formulations are different from the general form because they do not implicate trucks residual capacities. In constraint (2.9), a new truck docked at a given slot (variables uvt h ) imply naturally as much occupied docks. While a truck docked earlier remains on dock only if more trucks associated with the same mode are expected to be used in the upcoming slots (yhvt = 1). Constrains (2.10) complete the truck movement policy by handling the particular case, not handled by constraint (2.9), where at a give slot, a truck docked earlier should remain on dock because a quantity of packages, inferior than the current residual capacity, is expected in the upcoming slots without the need for an additional truck. Note that it is possible to formulate constraints (2.9) and (2.10) differently in a more compact way, by expressing variables yhvt in terms of expected upcoming packages instead of expected upcoming trucks. The proposed formulation was preferred because it presents a good separability, in the sense that constraints (2.7) and (2.8) implicate variables associated with the same period only. Constraints (2.11) impose a limit on the number of docks that are available. Constraints (2.12) impose that the number of packages to be prepared in each slot should not exceed the production capacity of the workers. Constraints (2.13) impose a limit on the number of permanent workers. Constraints (2.14) ensure that there are not more temporary workers than permanent workers. Otherwise, we assume that permanent workers should be on duty. Constraints (2.15)–(2.19) define the integrality or binary requirements. Based on the proposed formulation, we give in the following the complexity property of IPSP. Proposition 1 The Packaging and Shipping Problem (IPSP) is N P-hard. We prove the N P-hardness of (IPSP) by reduction from the knapsack problem (KP). Given a knapsack with volume B and a set N of N items, indexed from 1 to N , each with a volume bi and a value ci , the KP consists in selecting a subset N¯ of N under the budget constraint which imposes that the total volume is less than or P equal to B, such that i∈N¯ ci is maximised. It can be formulated as follows: (KP). N P. max. ci x i. (2.20). bi x i ≤ B. (2.21). i=1. s.t.. N P i=1. xi ∈ {0, 1}, ∀i ∈ N. (2.22). where binary variable xi is equal to 1 if the i-th item has been selected, and zero otherwise. The objective function (2.20) is to maximize the value of the selected. © 2016 Tous droits réservés.. lilliad.univ-lille.fr.
(37) Thèse de Bayrem Tounsi, Lille 1, 2016. 2.4. Problem definition, notation and model. 23. items. Constraint (2.21) is the budget constraint, while Constraints (2.22) impose variables to be binary. For each instance of the KP we construct the following IPSP instance. For each item i ∈ N , we construct an order d, such that d ∈ D0 (i.e., it is an order associated with the first period of the horizon), vol0d = bi , r0d = 0 and it is assigned to a unique mode v. The horizon is made of two periods, i.e., H = {0, 1}. Orders received the ¯ = {0, 1}. Each period is made period 0, can be processed during period 1, i.e., H by one shift indexed with zero, i.e., S = {0}. Shifts are made by only one slot, then T = {0}. This implies only one slot forms the period. No order is received during period 1. For sake of simplicity, in this section we omit the index related to the period and the shift as well as the mode index. At most one permanent worker is available for each shift, namely, emax = emax =1 0 1 P with a null cost. Productivity is i∈N voli of the permanent worker working during period 0 (this worker can process all orders arrived in period 0), and B for the permanent worker of period 1. On the other side, temporary workers have a null productivity and their cost is fixed to a strict positive constant, i.e., 1. Due to construction, mode change is not possible (only one mode is available). Postponing order d to period 1 generates a penalty. ¯ phd. =. ( cd c˜d = − vol d 0. ¯ = 1, if h ¯ = 0. if h. (2.23). The cost of a truck is set to zero, i.e., ctruck = 0. truck capacity is set to i∈N voli : a truck can contain all the orders received in period 0. It is supposed that only one dock is available, Nmax is set to 1. Other time parameters like the shift starting period, are trivially fixed. This transformation of a KP instance into a IPSP instance is polynomial in time and takes O(|N |) operations. P. For the obtained instance, the model (IPSP) is reduced to (2.24)–(2.42). Note that variables related to the truck management are not present in the objective function. Then, we can suppose variables w, u and y fixed to 1 and get rid of them. Note that this assumption verifies Constraints (2.29)–(2.33).. © 2016 Tous droits réservés.. lilliad.univ-lille.fr.
(38) Thèse de Bayrem Tounsi, Lille 1, 2016. 24. Chapter 2.. min s.t.. XX. ¯. phd vold xhd +. ¯ H ¯ d∈D0 h∈ X ¯ fdh = ¯ H ¯ h∈. X. ¯. Integration in E-fulfilment optimization. X. per temp temp (cper zh ) h zh + ch. (2.24). h∈H. vold. ¯. xhd = 1. ∀d ∈ D0. (2.25). ∀d ∈ D0. (2.26). ¯ H ¯ h∈ ¯ h fd ≤. ¯ ¯∈H ¯ vold xhd ∀d ∈ D0 , ∀h X X ¯ fdh + kh = Quh ∀h ∈ H. (2.27) (2.28). ¯ H ¯ d∈D0 h∈ ¯ h−h=0. uh ≤ Nmax yh yh ≤ uh. ∀h ∈ H. (2.29). ∀h ∈ H. (2.30). Quh ≤ Qwh + Q(1 − yh ) Quh ≤ Qwh. ∀h ∈ H. (2.31). ∀h ∈ H. (2.32). wh ≤ Nmax ∀h ∈ H X X ¯ per temp temp fdh ≤ prodper zh h zh + prodh ¯ H ¯ d∈D0 h∈ ¯ h−h=0 zhper ≤ 1 ∀h ∈ H zhtemp ≤ zhper ∀h ∈ H ¯ ¯ xhd ∈ {0, 1} ∀d ∈ D0 , ∀h. (2.33) ∀h ∈ H. (2.34). (2.35) (2.36) ¯ ∈H. (2.37). yh ∈ {0, 1} ∀h ∈ H. (2.38). zhper , zhtemp ∈ N ∀h ∈ H ¯ ¯∈ fdh ∈ N ∀d ∈ D0 , ∀h. (2.39) ¯ H. (2.40). wh , kh , uh ∈ N ∀h ∈ H. (2.41). Moreover, since periods are constituted by only one period, variables kh become useless and Constraints (2.28) can be replaced by X X. ¯. fdh ≤ Q. ∀h ∈ H. (2.42). ¯ H ¯ d∈D0 h∈ ¯ h−h=0. Due to construction, Constraints (2.42) are trivially satisfied (a truck can contain the full orders received in period 0). Finally, due to construction, we are sure that in the optimal solution only one fix worker works each period (z0per = z1per = 1), while no temporary workers will be hired (z0temp = z1temp = 0). Constraints (2.35)–(2.36) are trivially verified. The model reduces to. © 2016 Tous droits réservés.. lilliad.univ-lille.fr.
Figure


+7
Documents relatifs