HAL Id: hal-01091280
https://hal.inria.fr/hal-01091280v2
Submitted on 8 Sep 2016
HAL is a multi-disciplinary open access
archive for the deposit and dissemination of
sci-entific research documents, whether they are
pub-lished or not. The documents may come from
teaching and research institutions in France or
abroad, or from public or private research centers.
L’archive ouverte pluridisciplinaire HAL, est
destinée au dépôt et à la diffusion de documents
scientifiques de niveau recherche, publiés ou non,
émanant des établissements d’enseignement et de
recherche français ou étrangers, des laboratoires
publics ou privés.
Management in the Cloud
Stefania Costache, Samuel Kortas, Christine Morin, Nikos Parlavantzas
To cite this version:
Stefania Costache, Samuel Kortas, Christine Morin, Nikos Parlavantzas. Market-based Autonomous
Application and Resource Management in the Cloud. [Research Report] RR-8648, Inria. 2014, pp.35.
�hal-01091280v2�
ISRN INRIA/RR--8648--FR+ENG
RESEARCH
REPORT
N° 8648
Autonomous Application
and Resource
Management in the
Cloud
Stefania Costache , Samuel Kortas , Christine Morin, Nikos
Parlavantzas
RESEARCH CENTRE
Stefania Costache
∗, Samuel Kortas
∗, Christine Morin
†, Nikos
Parlavantzas
‡§
Project-Team MYRIADS
Research Report n° 8648 — December 2014 — 36 pages
Abstract: Managing private High Performance Computing (HPC) clouds, although it has
dif-ferent advantages due to improved infrastructure utilization and application performance, remains difficult. This difficulty comes from providing concurrent resource access to selfish users who might have applications with different resource requirements and Service Level Objectives (SLOs). To overcome this challenge, we propose Merkat, a market-based SLO-driven cloud platform. Merkat relies on a market-based model specifically designed for on-demand fine-grain resource allocation to maximize resource utilization and it uses a combination of currency distribution and dynamic resource pricing to ensure proper resource distribution. To scale the application’s resource demand according to the user’s SLO, Merkat uses autonomous controllers, which apply adaptation policies that: (i) dynamically tune the amount of CPU and memory provisioned for the virtual machines in contention periods or (ii) dynamically change the number of virtual machines. Our evaluation with simulation and on the Grid’5000 testbed shows that Merkat provides flexible support for different application types and SLOs and good user satisfaction compared to existing centralized systems, while the infrastructure resource utilization is improved.
Key-words: cloud computing, resource management, autonomous systems
§The authors are in alphabetic order. ∗EDF R&D, Clamart, France
†INRIA Rennes-Bretagne Atlantique, Rennes, France ‡INSA, Rennes, France
une approche fondée sur un marché
Résumé : Les organisations qui possèdent des infrastructures de calcul à
haute performance (HPC) font souvent face à certaines difficultés dans la ges-tion de leurs ressources. En particulier, ces difficultés peuvent provenir du fait que des applications de différents types doivent pouvoir accéder concurrem-ment aux ressources tandis que les utilisateurs peuvent avoir des objectifs de performance (SLOs) variés. Pour résoudre ces difficultés, cet article propose un cadre générique et extensible pour la gestion autonome des applications et l’allocation dynamique des ressources. L’allocation des ressources et l’exécution des applications sont régies par une économie de marché respectant au mieux des objectifs de niveau de service (SLO) tout en tirant parti de la flexibil-ité d’un nuage informatiqueé et en maximisant l’utilisation des ressources. Le marché fixe dynamiquement un prix aux ressources, ce qui, combiné avec une politique de distribution de monnaie entre les utilisateurs, en garantit une utili-sation équitable. Simultanément, des contrôleurs autonomes mettent en œuvre des politiques d’adaptation pour faire évoluer la demande en ressource de leur application en accord avec les objectifs (SLO) fixés par l’utilisateur. Les poli-tiques d’adaptation peuvent : (i) adapter dynamiquement leur demande en terme de CPU et de mémoire pour les machines virtuelles en période de con-tention pour l’obcon-tention de ressources (ii) et changer dynamiquement le nombre de machines virtuelles. Nous avons évalué cette plate-forme par simulation et sur l’infrastructure Grid’5000. Nos résultats ont montré que cette solution: (i) offre un support flexible aux applications de différents types ayant des demandes variés en terme de niveau de service; (ii) augmente l’utilisation des ressources de l’infrastructure; (iii) conduit à une meilleure satisfaction des utilisateurs par rapport aux solutions centralisées existantes.
Mots-clés : nuages informatiques, allocation de ressources, systèmes
1
Introduction
HPC infrastructures, composed of a large number of computers, are acquired and used by an increasing number of organizations. The efficient use of these infrastructures is a key challenge for many of these organizations, which strive to minimize the cost of maintaining the infrastructure while satisfying the con-straints of applications running on it. Recently, to ease their infrastructure’s management, some of these organizations choose to virtualize and transform them in "private clouds", managed by specialized frameworks [20, 36, 43, 30, 18]. The main difficulty that these resource management frameworks need to address is allocating the resources needed for each application.
First, resource allocation has to be done with respect to the infrastructure’s capacity limitations. Having enough capacity to meet all user requests in the highest demand periods is rarely the case, as expanding the resource pool is expensive. To differentiate between user requests in these periods, most of these frameworks [20, 36, 43, 18] rely on priority classes, i.e., users are given a priority class for their applications. However, in this case the users might abuse their rights and run less urgent applications with a high priority, taking resources from users who really need them.
Second, resource allocation has to be done by considering the application and user requirements. Some applications might have a resource demand that varies frequently, based on the load they need to process, e.g., web applications, while others can simply adapt their demand to the current resource availabil-ity, e.g., bags of tasks or MapReduce applications. At the same time, while some applications can achieve better performance by scalling horizontally, i.e., scaling the number of nodes, others might benefit from scaling their resource demand vertically, i.e., scaling the resource amount per node [4]. Disregarding these characteristics can lead to poor resource utilization and application per-formance. Finally, users might have different SLOs for their applications. Some users want the application results by a specific deadline, (e.g., a user needs to send her manager the output of a simulation by 7am the next day) or as soon as possible (e.g., a developer wants to test a newly developed algorithm). Using the cloud computing’s "on-demand" provisioning model of virtual resources to manage the organization’s infrastructure is an attractive approach to deal effi-ciently with the variety of application resource models and user requirements. By provisioning virtual machines dynamically, advanced Platform-as-a-Service (PaaS) solutions [3, 6, 12, 32] can satisfy application performance requirements, but, while only some of them provide vertical and horizontal scalling, none of
them properly address the case of contention periods.
In this paper we present the design and evaluation of a platform for
ap-plication and resource management in private clouds, called Merkat. Merkat
applies a unique approach to multiplex the limited infrastructure capacity be-tween applications with different resource demand models while maximizing the infrastructure utilization and providing support to meet different SLOs. In Merkat each application runs in an autonomous environment composed of a set of virtual machines (VMs) customized to its needs. This environment, which we call a virtual platform, elastically adapts its resource demand to meet the
user’s SLO. The resource demand of the virtual platforms is regulated through
allo-demand. The market’s allocation scheme distributes resources in terms of CPU and memory in a fine-grained manner to the provisioned VMs, allowing
appli-cations to scale their resource demand not only horizontally but also vertically.
The market’s currency distribution policy and dynamic price ensure proper
re-source utilization in contention periods, by favoring users who get the most value
from the resources. On top of the implemented market, the virtual platforms use two policies to adapt the application’s resource demand to the current resource availability and price: (i) a vertical scaling policy that adapts the application resource demand per VM; (ii) a horizontal scaling policy that adapts the ap-plication resource demand in terms of number of VMs. These policies can also be combined for better application execution. Through the use of the market, each virtual platform takes resource demand adaptation decisions independently from the others. This resource control decentralization makes Merkat flexible in
supporting multiple application models and SLOs.
We evaluated Merkat in simulation and on a real testbed. We implemented the proportional-share market in CloudSim [8]. We evaluated the performance of the proportional-share market in terms of total user satisfaction when appli-cations adapt their resource demands per VM to track a user-given SLO [14]. We also tested Merkat on the Grid’5000 [7] testbed with two application types: static MPI applications and malleable task processing frameworks [13]. Our results show that: (i) Merkat is flexible, allowing the co-habitation of differ-ent applications and policies on the infrastructure; (ii) Merkat increases the infrastructure resource utilization, through vertical and horizontal scaling of applications; (ii) Merkat has low performance degradation compared to a cen-tralized system that supports a fixed SLO type; this degradation is caused by the decentralized nature and the application selfish behavior.
The remaining of this paper is organized as follows. Section 2 describes our approach. It introduces the principles behind it and the resource management process. Section 3 describes the vertical and horizontal policies implemented in Merkat. Section 4 presents evaluation results and Section 5 discusses limitations and future directions of improvement. Section 6 describes the related work. Finally, Section 7 concludes the paper.
2
Merkat
Merkat has been designed to manage the clusters owned by an organization, which needs to run HPC workloads but it cannot use public cloud resources, due to security constraints, e.g., the data that needs to be processed is too sen-sitive. This is often the case of organizations carrying out research activities in computational sciences. This case is supported by Electricite de France (EDF), which relies on HPC simulations to optimize the day-to-day electricity produc-tion or choose the safest and most effective configuraproduc-tions for nuclear refuelling. The clusters are shared among a multitude of users (e.g., scientific researchers) which might come from different departments (e.g., production, development) and might need to use specific frameworks or libraries to run their applications. These users not only have different SLOs for their applications, e.g., getting computation results until a specific deadline, or executing the application as fast as possible, but they might also want to assign different importance degrees to their requests.
Virtual Machine Market
Virtual Pla0orm Virtual
Pla0orm Pla0orm Virtual
bid/payment bid/payment bid/payment
VM VM VM VM
budget budget budget
assign budgets redistribute payments Applica;on Applica;on Applica;on /47 System Virtualization Hypervisor
•One to multiple OSes on a physical node thanks to a hypervisor
(an operating system of OSes) Virtual Machines (VMs)
Physical Machine (PM) Virtual Machine Monitor
“A virtual machine(VM) provides a faithful implementation of a physical processor!s hardware running in a protected and isolated environment. Virtual machines are created by a software layer called the virtual machine monitor (VMM) that runs as a privileged task on a physical processor.”
3
Thursday, June 30, 2011
/47
System Virtualization
Hypervisor
•One to multiple OSes on a physical node thanks to a hypervisor
(an operating system of OSes) Virtual Machines (VMs)
Physical Machine (PM) Virtual Machine Monitor
“A virtual machine(VM) provides a faithful implementation of a physical processor!s hardware running in a protected and isolated environment. Virtual machines are created by a software layer called the virtual machine monitor (VMM) that runs as a privileged task on a physical processor.”
3
Thursday, June 30, 2011Physical Infrastructure
VM VM VM VM VM VM VM VM VM VM
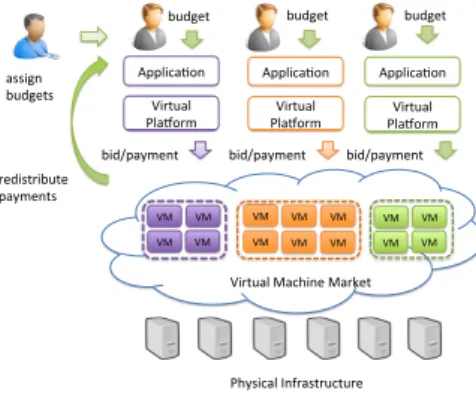
Figure 1: Overview of the Merkat system.
Merkat meets the user demands, while also allowing the organization to get the best out of its infrastructure, by maximizing its resource utilization. Figure 1 gives an overview of Merkat. Merkat relies on: (i) a virtual machine market to allocate resources and internal currency to manage the priority of users’ demands and (ii) a set of virtual platforms that manage and elastically scale applications to meet user SLOs.
To be able to run applications on the infrastructure, users are assigned bud-gets by an administrator in the form of a virtual currency. Merkat disposes of a total amount of currency, which is distributed among uses based on defined weights. We call the currency unit a credit. A user will receive a budget of credits proportional to its weight in the system. It is the task of the admin-istrator to add/remove users to/from the system, set up and adjust the total amount of currency and the users’ weights. Virtual currency is desirable when managing a private infrastructure; because no external currency is introduced, price inflation is bounded.
When a user wants to run an application, she assigns it a replenishable amount of credits, called application budget, and sends a request to Merkat to start a virtual plaform for it. This application budget reflects the maximum cost the user is willing to support, or the true priority, for running an application. These budgets are replenished automatically at a system-wide interval defined by the administrator. The replenishment is defined as transfering a user-defined amount from her account to the application’s budget. Merkat ensures that the amount with which the budget is replenished never leads to a total budget that exceeds the initial budget amount. Replenishable budgets are used to minimize the risk of depleting the application’s budget in the middle of the application’s execution.
A virtual platform runs the user’s application by acquiring VMs from the virtual machine market. The design of the virtual platform is specific to the ap-plication type the user wants to run. VMs are acquired by submitting payments for their resources, also called bids. Bids can be scaled up or down during the VM runtime. This mechanism has several advantages. First, it provides
flexi-bility for designing a variety of policies to adjust the resource allocation of the
application in a selfish way, with regard only to the user’s SLO and application budget. This selfish behavior is natural, as users care only about the
perfor-Applica'on Controller Applica'on Controller Applica'on Controller start/resume virtual pla4orm Applica'on configura'on SLO Budget monitor applica'on’s budget acquire/release VMs change VM bids manage VMs get user informa'on (un-‐) register virtual pla4orms Virtual Pla4orm
Manager Virtual Pla4orm
Virtual Currency
Manager VM Scheduler
IaaS Cloud Manager charge users
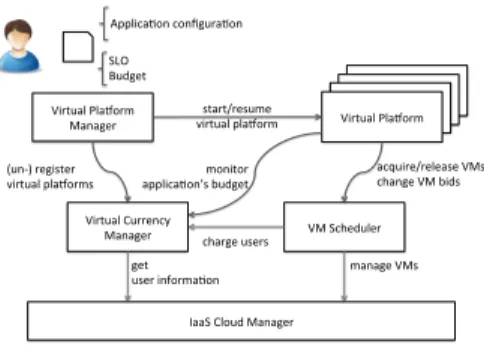
Figure 2: Prototype’s components and their interactions.
mance of their applications. In this context, currency management allows some control over this selfish behavior and gives users incentives to use better the infrastructure, while also allowing flexibility in meeting their SLOs. Second, allowing a bid per resource per VM leads to efficient resource utilization for the organization, as there is a strong incentive for users to design policies that avoid oversubscription by requesting just as much as the application uses from the capacity of a VM. Lastly, communicating resource demands through the use of bids leads to a generic system, capable of supporting any kind of application and SLO.
2.1
Architecture
Merkat is composed of three main services, the VM Scheduler, the Virtual Cur-rency Manager and the Virtual Platform Manager. Figure 2 gives an overview of them. The Virtual Currency Manager applies virtual currency distribution policies and manages user and application budgets. The VM Scheduler is in charge of allocating resources to running VMs and computing their node place-ment. The used algorithms are described in Section 2.2. The Virtual Platform
Manager acts as an entry point for users to run their applications on our system.
To start an application on the infrastructure, a user submits a request contain-ing a virtual platform template to the Virtual Platform Manager. The virtual platform template contains information regarding the application controller, adaptation policy parameters, including desired user SLO, and the configura-tion of the VMs, e.g., VM disk image. We define the SLO as the performance objective the user wants for her application, e.g., a specific execution time or throughput. To start the virtual platform, the Virtual Platform Manager checks any initial deployment conditions that a user has specified. For example, the user might want to start running an application only if the resource price is be-low a threshold. If these conditions are not met, the deployment of the virtual platform is either postponed or canceled. For example, the deployment is can-celed if the application needs to start its execution before a given deadline (the user’s defined SLO) and the price is too high to allow it. If these conditions are met, the Virtual Platform Manager creates the virtual platform and registers it with the Virtual Currency Manager. The Virtual Platform Manager is also in charge of resuming any virtual platforms that might suspend their VMs to avoid executing applications in high price periods.
To manage the users and the VMs, Merkat interacts with an IaaS Cloud Manager [39]. The IaaS Cloud Manager provides interfaces to start, delete and migrate VMs, manage their storage, network, and moreover, to keep information about the infrastructure’s users.
2.2
The Virtual Machine Market
To allocate resources to VMs based on the value of the submitted bids, Merkat uses a proportional-share policy. Originally, this policy was used by the operat-ing system schedulers to allocate CPU time to tasks proportionally to a given weight, and inversely proportionally to the sum of all the other concurrent task weights [45]. Merkat uses a modified version of this policy, in which each provi-sioned VM has an associated bid for its resources, i.e., CPU and memory, and it receives an amount of resource proportional to the bid and inversely propor-tional to the sum of other concurrent bids [24]. The value of the bid of a VM can be changed during the VM runtime.
This policy is advantageous as it allows provisioning VMs with arbitrary resource allocations at a small algorithmic complexity (O(N)), aspect which becomes important with the increasing scale of the infrastructures. Moreover, this policy is easy to understand and use as it avoids starvation and unvoluntary VM shutdown or preemption. Because each VM receives a resource amount, even in high price periods, policies can be designed to allow applications to decide whether to adapt to these small allocations or voluntary shutdown some of their components.
In Merkat, the implementation of the proportional-share policy follows four steps: (i) VM bid submission; (ii) VM allocation computation; (iii) VM place-ment; (iv) price computation.
2.2.1 VM Bid Submission
To provision VMs, a bid, in the form of a vector b =< bcpu, bmemory>needs to
be submitted for their resources, CPU and memory, to a central entity, called VM Scheduler. This bid can be submitted directly by the user or the virtual platform that manages the VMs. The initial bid can be computed based on past price history and the user’s current budget. In our implementation we compute the VM bid based on the current resource price. The bid submitted for a VM is persistent: the user can specify it when the VM is started and the VM Scheduler will consider this value in its allocation decisions during the VM runtime. Nevertheless, the value of the bid can be further changed to cope with price fluctuations.
2.2.2 VM Resource Allocation
The VM Scheduler periodically computes resource allocations for the VMs for which a bid was submitted, by considering the value of their bid and a resource
utilization cap, amax, i.e., the maximum resource utilization of a VM during its
lifetime. The VM Scheduler uses the amaxvalues to distribute free resources to
other VMs needing them. We consider that the user can estimate amaxfor her
Node 1 100 CPU 10 GB RAM Node 2 100 CPU 10 GB RAM Node 3 100 CPU 10 GB RAM VM VM VM VM VM 37.5 CPU 2 GB RAM 37.5 CPU 2 GB RAM 37.5 CPU
2 GB RAM 93.75 CPU 2 GB RAM
93.75 CPU 2 GB RAM 33.3 CPU 2 GB RAM 33.3 CPU 2 GB RAM 33.3 CPU 2 GB RAM 12 credits 30 credits 100 CPU 2 GB RAM 100 CPU 2 GB RAM alloci
alloci alloci
allocr allocr allocr 3 x 2 x 100 CPU 2 GB RAM 100 CPU 2 GB RAM App1 App2
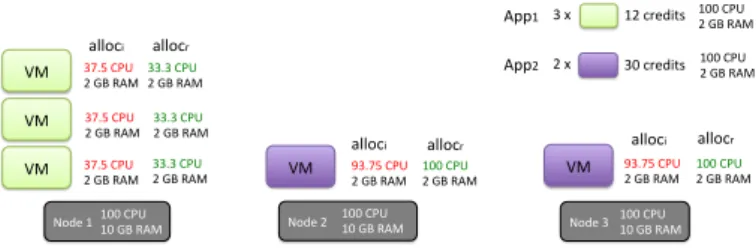
Figure 3: An example of resource fragmentation. 2 applications requesting 3 and respectively 2 VMs run on 3 nodes. If resources are allocated with the proportionshare policy from the entire infrastructure capacity, the CPU al-locations for the first application’s VMs cannot be guaranteed. If resources are allocated with the proportional-share policy from the node capacity, allocations can be guaranteed and all available resources are distributed.
The resource allocation computation is performed in two steps: (i) to ensure maximum utilization, the VM Scheduler computes the VM allocation consid-ering the entire infrastructure as a single physical node; (ii) to cope with the resource fragmentation, i.e., the infrastructure capacity is divided among nodes, the VM Scheduler corrects the allocations to fit to the node capacity.
When considering the entire infrastructure as a single physical node, the VM Scheduler computes the resource allocations as follows. For each resource, given
a set of n resource bids bi(t), with i ∈ {1..n}, for a time interval t and a capacity
of C units, the resource allocation for each bid bi(t)is equal to:
ai(t) =
bi(t)
Pn
i bi(t)
· C, (1)
However, as the infrastructure capacity is partitioned between nodes, there are situations when resulted allocations cannot be enforced. This issue is il-lustrated in Figure 3. We consider 3 nodes with a capacity of 100 CPU units and 10 GB of RAM each. We also consider 5 VMs with a maximum resource utilization of 100 CPU units and 2 GB RAM each. The first 3 VMs receive a bid of 12 credits, and the last 2 VMs receive a bid of 30 credits. In this example, only the CPU resource is a bottleneck and each VM will receive the maximum amount of requested RAM. Using Equation 1, the VM Scheduler computes an
allocation allocj
iCP U (depicted with red in Figure 3), j ∈ 1..5, as follows: 37.5
CPU units for the first 3 VMs and 93.75 CPU units for the last two VMs, where 1 CPU unit represents 1% of CPU time. Practically, these allocations cannot be enforced.
To solve this issue, the VM Scheduler corrects the allocations by recomput-ing them after placrecomput-ing the VMs on the nodes and usrecomput-ing the capacity of the
node in Equation 1. In the previous example, the resulted allocation allocj
rCP U
(depicted with green in Figure 3), j ∈ 1..5, is: 33.3 CPU units for the first 3 VMs and 100 CPU units for the last 2 VMs. The resulted allocation difference is called allocation error and is defined as follows:
er=
alloci− allocr
As seen in the next section, this allocation error is used in placing the VMs on nodes.
2.2.3 VM Load Balancing
When VM requests are received the VM Scheduler places them initially on the nodes with the lowest resource utilization. To minimize the VM allocation error, the VM Scheduler might migrate VMs between nodes. The process of migrating VMs among nodes is called load balancing. As having a high number of migrations leads to a performance degradation for the applications running in the VMs, the load balancing process tries to make a trade-off between the number of performed migrations and the VM allocation error. For example, it won’t make sense to migrate a VM when its allocation error is 1%. To select the VMs to be migrated at each scheduling period, the VM scheduler relies on an algorithm based on a tabu-search heuristic [17]. Tabu-search is a local-search method for finding the good solutions of a problem by starting from a potential solution and applying incremental changes to it.
Algorithm 1 details the load balancing process. The algorithm receives the list of current nodes, nodes, the list of running VMs, vms, the list of VMs to be started at the current scheduling period, newvms, and three thresholds: (i) maximum number of iterations performed by the algorithm to obtain a better
placement than the current one, Niter; (ii) maximum allocation error supported
for the VMs in their current placement, Emax; (iii) maximum number of
migra-tions required to reach a better placement, Mmax. Based on this information
the algorithm computes the new placement of VMs on nodes and outputs a migration plan, composed of the VMs to be migrated, and a deployment plan, composed of the VMs to be started.
The algorithm starts from the current VM placement and tries to minimize the VM allocation error while keeping the number of VM migrations within
the given limit Mmax. If new VMs need to be created, they are placed on the
least loaded nodes (Lines 6-8) before the VM placement is improved. Then, the VM placement is incrementally improved by placing the VM with the highest allocation error among the CPU and memory resources to the node that mini-mizes it (Lines 15-20). Note that, as each VM has two allocated resources, the maximum allocation error is the maximum among the computed error for each resource (Line 15). The VM allocation error computation is performed by a method called ComputeErrors. To avoid being stuck in a suboptimal solution, the algorithm uses a list that memorizes the last changes (Line 21).
The Niter threshold is used to ensure the algorithm finishes: if there is no
improvement in the last Niter iterations, the algorithm stops.
2.2.4 Price Computation
In our approach we compute the resource price as the sum of all bids divided by the total infrastructure capacity. If this price is smaller than a predefined price, i.e., reserve price, then the reserve price is used. Users are charged based on their allocated resource amounts.
Algorithm 1VM load balancing algorithm.
1: ComputePlacement (nodes, vms, newvms, Niter, Emax, Mmax)
2: migrationP lan ← ∅ // migrations to be performed
3: deploymentP lan ← ∅ // deployments to be performed
4: nIterations ← 0 // number of iterations until an improvement
5:
6: for vm ∈ newvms do
7: node ← least loaded node from nodes
8: node.vms ← node.vms ∪ {vm}
9: solutionold← nodes // current placement of VMs
10: solutionbest← nodes // new placement of VMs
11: tabu_list ← ∅ // list of forbidden moves
12: eworse← inf
13: e = ComputeErrors(vms, nodes)
14: while nIterations < Niter and eworse> Emax do
15: (vm, emax) ← vm with emax= max
1≤i≤nmax{eic, eim}, vm 6∈ tabu_list
16: source ← vm.node
17: destination ← node which minimizes emax, node 6∈ tabu_list
18: vm.node ← destination
19: source.vms ← source.vms − {vm}
20: destination.vms ← destination.vms ∪ {vm}
21: tabu_list ← tabu_list ∪ {(vm, source)}
22: e = ComputeErrors(vms, nodes)
23: e0max← max
1≤i≤nmax{eic, eim}
24: nM igrations = count number of migrations required to reach the new placement
25: if eworse− e0max> 0 and nM igrations < Mmaxthen
26: solutionbest= nodes // Keep the best solution so far
27: eworse← e0max
28: nIterations ← 0
29: else
30: nIterations ← nIterations + 1
31: for node ∈ solutionold do
32: for vm ∈ node.vms do
33: if vm.node 6= node and vm /∈ newvms then
34: migrationP lan ← migrationP lan ∪ (vm, vm.node)
35: for vm ∈ newvms do
36: deploymentP lan ← deploymentP lan ∪ (vm, vm.node)
37:
Virtual Pla*orm Applica0on Controller Monitor metrics reconfigure Monitor Virtual Cluster Virtual Cluster VM Scheduler Virtual Machine Market bid/ N VMs Virtual Cluster Virtual Cluster Applica0on SLO Renewable Budget
current price
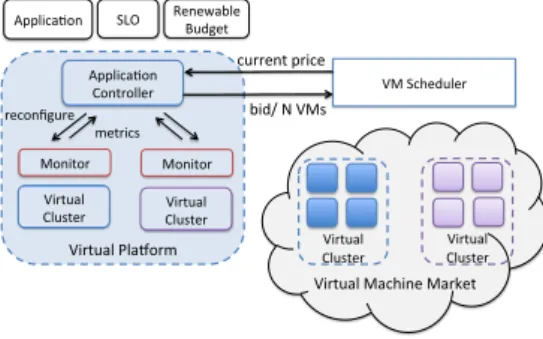
Figure 4: Virtual Platform overview.
2.3
Virtual Platforms
When running the application on the Merkat’s virtual machine market, it is not sufficient for the virtual platform logic just to acquire a number of VMs and compute their bids at the beginning of the application execution. As the resource price and allocation are dynamic, this logic will not guarante that the application receives the right amount of resources to efficiently meet its SLO. If the price increases, the current user budget might not be enough to cover the cost of the needed resources. Thus, the application will run with less resources and not only will the SLO not be met, but also the budget will be wasted. If the price decreases, more resources could be provisioned, or the user could spend less for the already acquired resources. These issues are solved by the virtual platform, which monitors the application performance and adapts autonomously to the resource price and user requirements.
2.3.1 Virtual Platform Architecture
Figure 4 illustrates the architecture of a virtual platform. A virtual platform is composed of one or more virtual clusters, and an application controller, that manages them on behalf of the application. The application controller receives as input a virtual platform template, containing the application description and adaptation policies. An application can have one or more components, requir-ing different software configurations. Thus, for each application component, the application controller deploys a virtual cluster and starts the application com-ponent in it. We define a virtual cluster as a group of VMs that have the same resource configuration and use the same base VM image. As the application’s components might have different performance metrics, a different virtual cluster monitor running user specific monitoring policies can be started in each virtual cluster.
During the application runtime, the application controller checks the ap-plication’s performance metrics and adapts dynamically the virtual platform resource demand to the infrastructure resource prices and reconfigures the ap-plication. The user can interact with her application controller during its execu-tion to modify her SLO, the budget for the applicaexecu-tion execuexecu-tion, or to retrieve statistics regarding the application.
3
Application Adaptation Policies and Use Cases
We demonstrate the case of virtual platforms in Merkat by proposing and ap-plying two policies to adapt the resource demand of an application: vertical and horizontal scaling. These policies use the dynamic resource price as a feedback signal regarding the resource contention and respond by adapting the applica-tion resource demand given the user’s SLOs.Both policies address three cases:
• Preserve budget when the SLO is met: When the SLO can be met, the virtual platform reduces its resource demand and thus its execution cost. The remaining budget can be used afterwards to run other applications. • Provide more resources when the SLO is not met: When the application
requires more resources to meet its SLO, and its budget affords it, the virtual platform increases its resource demand.
• React when the SLO is not met due to budget limitations: A last case that is considered is when the application cannot meet its SLO, because the current resource price is too high and the application budget is too limited to ensure the desired resource allocation. In this case, we consider that the user has two options: (i) stop the execution of her application; (ii) or continue to run it with the same amount of resources.
The policies are run periodically and use two performance thresholds, upper and lower, as a trigger: when the application performance metric crosses the thresholds, the policy takes an action that changes the virtual platform resource demand.
3.1
A Vertical Scaling Policy
The vertical scaling policy controls the amount of CPU and memory resources allocated to a VM as well the amount that is payed for them. This policy computes periodically the resource bids for each VM based on the following information: (i) current, minimum and maximum VM resource allocation; (ii) current application performance metrics, v; (iii) application reference
perfor-mance, vref, upper and lower performance thresholds, vhigh and vlow; (iii) the
current resource bids; (iv) the value of the last bid change, last_bid_change;
(v) and the budget to be spent for the next time period, bidmax. Algorithm 2
describes this policy.
The policy works as follows. To preserve the user budget when the SLO can
be met, the policy decreases the resource bids in two situations: (i) if the
per-formance metric drops below the lower threshold (e.g., the remaining execution time of the application is less than 75% of remaining time to deadline); (ii) or if the allocation per VM for one resource reaches the maximum (Line 5). To
provide more resources when the SLO is not met, i.e., when the performance
metric is above the upper performance threshold, the policy increases the re-source bids (Line 13). If the current budget is not enough to meet the SLO, the policy decides between two options, based on the application and SLO type: (i) it suspends the application; (ii) it recomputes the bids to favor the resource with a small allocation. The first option is taken for batch applications, when
Algorithm 2Vertical scaling policy
1: VerticalAdaptation (bid, bidmin, last_bid_change, bidmax, alloc, allocmin,
allocmax, v, vref, vlow, vhigh)
2: resources ← {cpu, memory}
3: T ← vref−v v 4: for r ∈ resources do
5: if (v < vlow) and alloc[r] > allocmin[r] then
6: bidtmp[r] ← max(bid[r]/max(2, 1 + T ), bidmin)
7: if last_bid_change < 0 then 8: δ ← |bid[r] − bidtmp[r]| 9: if δ−|last_bid_change| δ < 0.1 then 10: δ ← δ/2
11: bidtmp[r] ← max(bidtmp− δ, bidmin)
12: bid[r] ← bidtmp[r]
13: if (v > vhighand alloc[r] < allocmax[r]) or (alloc[r] < allocmin[r]) then
14: bidtmp[r] ← bidtmp[r] · max(2, (1 + T ))
15: if last_bid_change > 0 then 16: δ ← |bid[r] − bidtmp[r]| 17: if δ−|last_bid_change| δ < 0.1 then 18: δ ← δ/2 19: bidtmp[r] ← bid[r] + δ 20: bid[r] ← bidtmp[r]
// bids are re-adjusted due to budget limitations
21: if bid[memory] + bid[cpu] > bidmaxthen
22: w ← ∅
23: if alloc[r] ≥ allocmax[r], r ∈ resources then
24: w[r] ← 0
25: bidmax← bidmax− bid[r]
26: else
27: w[r] ← 1 −allocalloc[r]
max[r], r ∈ resources
28: for r ∈ resources with w[r]6= 0 do
29: bid[r] ←bidmax
Σw[r] · w[r]
30: return bid
the current price is too high to continue their execution, i.e., the VM allocation
becomes less than allocmin. In this case, the policy will resume the application
when the price drops, e.g., VMs can receive 75% of their maximum allocation at the current budget. The second option is taken if the application cannot be suspended. In this case, the application continues running with less resources than needed to meet the SLO. Thus, the policy recomputes the bids as a part from the application budget that is proportional to the difference between the actual and maximum allocation of the VM (Lines 21-29).
The value with which the bid changes is given by the "gap" between the
cur-rent performance value and the performance reference value: T = |(vref − v)/v|.
A large gap allows the application to reach its reference performance fast. To avoid too many bid oscillations the policy uses the value of the past bid change in its bid computation process. For example, if the bid was previously increased and at the current time period the bid needs to be decreased with a similar value, the bid oscillates indefinitely. Thus, the algorithm decreases the current
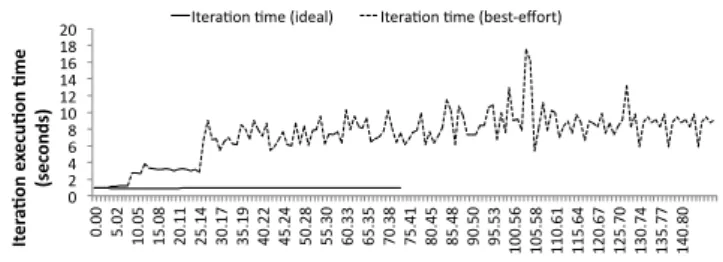
0 2 4 6 8 10 12 14 16 18 20 0. 00 5. 02 10. 05 15. 08 20. 11 25. 14 30. 17 35. 19 40. 22 45. 24 50. 28 55. 30 60. 33 65. 35 70. 38 75. 41 80. 45 85. 48 90. 50 95. 53 100. 56 105. 58 110. 61 115. 64 120. 67 125. 70 130. 74 135. 77 140. 80 Ite ra &on ex ec u& on &m e (se conds) Time (minutes)
Itera2on 2me (ideal) Itera2on 2me (best-‐effort)
Figure 5: Application execution time variation with a best-effort controller. bid with half of its value (Lines 8-10 and 16-18).
3.1.1 Adaptation of a Virtual Platform at Resource Demand
Fluc-tuations
To show how an application controller can adapt to changes in application resource allocation using the vertical scaling policy due to price variation, we ran a micro-benchmark using an MPI application, Zephyr [53]. Zephyr is a fluid dynamics simulation which runs for a user-defined number of iterations. Each iteration performs some computation, and if the application is started with multiple processes, also data is exchanged among them. Zephyr receives as input a configuration file and it simulates a volume filled by fluid for a specified simulated time, Zephyr periodically writes in a log file the following information: the CPU time for each iteration and the current number of iterations. For an SLO-driven Zephyr application, the application controller reads periodically the CPU time for each iteration and it compares it with a reference CPU time computed such that the application finishes its iterations at the user’s given deadline.
We started an SLO-driven application and four best-effort applications (Zephyr applications running with a controller that does not change the bid during the application runtime) on a node, each in a VM with 4 cores. The SLO-driven application has a budget of 60000 credits, from which it can spend as much as it wants, while the other best-effort applications start with a bid of 100 CPU credits and 900 memory credits which remains unchanged during their execu-tion. For this setup we used a node from our cloud. The SLO-driven application controller was started at the beginning of the experiment, while the other four application controllers were started during its execution. The last best-effort application was submitted after 20 minutes from the experiment start. The SLO-driven application has an ideal execution time of 77.5 minutes.
For clarity, we first run the Zephyr application with a best-effort controller instead of a SLO-driven one. Figure 5 shows the progress the application makes over time, i.e., its iteration execution time: (i) when it runs alone on the node (the ideal iteration time); (ii) and after the other applications are submitted (the best-effort iteration time). The performance difference in this case is highly noticeable: after all applications started executing, the iteration execution time increased almost 10 times. This degradation is not only due to its reduced resource allocation but also due to the other applications.
0 1000 2000 3000 4000 5000 6000 0 20 40 60 80 100 120 140 160 180 200 Cr ed its Time (minutes)
Deadline 12000 seconds Deadline 9000 seconds Deadline 6000 seconds
Figure 6: CPU bid variation for three different deadlines.
0 1000 2000 3000 4000 5000 6000 7000 8000 0 200 400 600 800 1000 0. 00 7. 04 14. 08 21. 12 28. 16 35. 20 42. 24 49. 27 56. 32 63. 37 70. 40 77. 44 84. 48 91. 51 98. 55 105. 59 112. 64 119. 68 126. 72 133. 77 140. 81 Me m or y (MB ) CP U (% U /l iz a/ on ) Time (minutes)
CPU u1liza1on CPU share Memory u1liza1on Memory share
0 1 2 3 4 5 6 0. 00 7. 03 14. 07 21. 11 28. 17 35. 20 42. 24 49. 27 56. 31 63. 34 70. 38 77. 41 84. 46 91. 49 98. 55 105. 58 112. 62 119. 66 126. 71 133. 75 140. 79 Ti me ( seco nd s) Time (minutes)
Itera1on execu1on 1me Itera1on reference 1me vlow vhigh (a) Resource share vs u1liza1on
(b) Itera1on execu1on 1me varia1on
Figure 7: Application resource and performance variation when running with a deadline of 9000 seconds: (a) shows the variation in resource allocation and utilization and (b) shows how the controller keeps the perfomance, defined as iteration execution time, between the defined limits.
Then we ran the application with three different deadlines: 12000 seconds, 9000 seconds and 6000 seconds. We repeated each experiment three times and computed the average of the obtained values.
Figure 6 shows the bid of the SLO-driven controller for CPU resource for the different application deadlines. The bid stabilizes after all the applications were submitted. The application with the smallest deadline demands a maximum allocation and thus, the submitted bid is also much higher than in the other two cases.
Figure 7(a) shows the variation in the resource share, and respectively uti-lization for the application when it is run with a deadline of 9000 seconds. As the behavior is similar for the other two tested deadlines, we ommit depicting them. Remember that the VM resource share is the proportional-share the VM gets according to its bid. The resource utilization is how much the application inside the VM consumes. The left axis shows the CPU resource, i.e.,
percent-age of total CPU time, while the right axis shows the memory resource, i.e., in MBs. The best-effort application arrivals can be noticed by looking at the changes in the SLO-driven VM resource share. In this case, the memory share reflects the best these arrivals. When the application started alone on the node the VM’s share is the entire node capacity. After each application arrival, this share decreases until it equalizes the VM utilization. After all the best-effort applications started running, the SLO-driven controller keeps a reduced CPU share as the application can meet its deadline.
Figure 7(b) shows the variation in the SLO-driven application iteration ex-ecution time. To understand the behavior of the vertical scaling algorithm, we
also give the lower and upper scaling thresholds, vlow and vhigh. We notice
that after all the best-effort applications started running, the application con-troller manages fairly well to keep the iteration execution time between these two thresholds. However, there are cases in which the iteration execution time oscillates. We think that one cause for this variation is the sharing of physical cores between more VM processes. The SLO-driven application receives more CPU than the best-effort applications, and thus less of the VMs in which these best-effort applications run get scheduled on the same physical cores as its own.
3.1.2 Adaptation of a Virtual Platform at SLO Modification
Merkat’s application controller can also react to a user imposed condition. To show how it does so, we ran a SLO-driven Zephyr application and changed the user-specified deadline during the application execution. We submitted a deadline-driven application and four best-effort applications to Merkat. All the applications are started on the same node, each in a VM with 4 cores. The best-effort applications are started in the first few minutes after the start of the deadline-driven application. The SLO-driven application has a budget of 60000 credits, from which it can spend as much as it wants, while the other best-effort applications use a fixed bid of 100 CPU credits and 900 memory credits per VM.
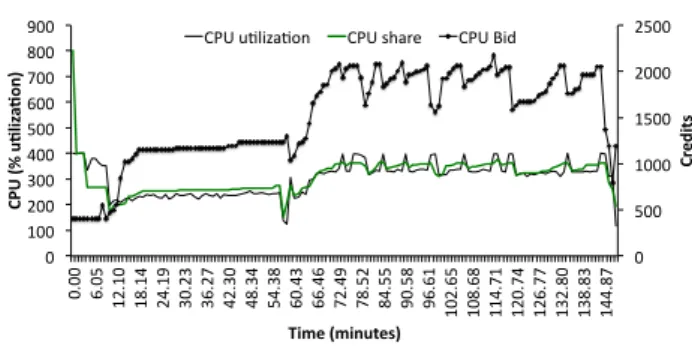
The SLO-driven application is started with an initial deadline of 12000 sec-onds. After 64 minutes from the application start the deadline is changed to 9000 seconds. The application controller’s bid adaptation and the allocation changes can be noticed in Figure 8. Figure 9 shows the application controller behavior and the variations in the estimated application execution time due to allocation and bid fluctuations. The additional submitted best-effort applications at the begining of the experiment leads to a decrease in application allocation and thus an increase in its execution time. However, the application controller doesn’t react aggressively as its allocation, in this case 266 CPU units, is enough to meet the application deadline. When we decrease the application’s deadline (noticed in Figure 9 from the change in the reference time), the application controller also adjusts the bid aggressively, leading to an increased resource allocation, in this case close to 400 CPU units, which is the maximum VM allocation. This increase allows the application to keep its iteration execution time close to the reference, thus meeting its deadline.
0 500 1000 1500 2000 2500 0 100 200 300 400 500 600 700 800 900 0. 00 6. 05 12. 10 18. 14 24. 19 30. 23 36. 27 42. 30 48. 34 54. 38 60. 43 66. 46 72. 49 78. 52 84. 55 90. 58 96. 61 102. 65 108. 68 114. 71 120. 74 126. 77 132. 80 138. 83 144. 87 Cr ed its CP U (% u. liz a. on ) Time (minutes)
CPU u1liza1on CPU share CPU Bid
Figure 8: Application’s CPU utilization and bid variation due to adaptation to the new deadline.
0 0.5 1 1.5 2 2.5 3 3.5 4 0.00 20.00 40.00 60.00 80.00 100.00 120.00 140.00 Ti me ( sec on ds) Time (minutes)
Itera0on reference 0me vlow vhigh Itera0on execu0on 0me
Figure 9: Application’s iteration execution time variation due to adaptation to the new deadline. The reference iteration execution time and the two thresholds used in Algorithm 2 are also shown.
3.2
A Horizontal Scaling Policy
The horizontal scaling policy controls the number of VMs and their resource payments. The horizontal scaling policy outputs the number of VMs and the bids for the next time period based on the following information: (i) current resource prices, number of VMs and bids; (ii) the VM maximum allocation; (iii) application performance metric, upper and lower performance threholds. Algorithm 3 details this policy.
The algorithm is composed of two steps: (i) first, a new number of VMs,
nvms, is computed based on the application performance metric; (ii) then, this
number is compared to and limited to a maximum number of VMs computed for the next time period so that all the VMs receive an amount of CPU and
mem-ory equal to their maximum resource utilization, amax, at the current resource
prices.
The first step, detailed in method HorizontalAdaptation (Lines 2-6), is used
to preserve the budget when the SLO is met or to increase the resource demand
when the SLO is not met. The second step, detailed in method GetUpperBound
(Lines 8-12), is used to reduce the resource demand when the current budget is
not enough to meet the SLO. For this last step, the bid value for each VM
resource is easily computed from the Equation 1 by replacing ai with N · amax,
Algorithm 3Horizontal scaling policy
1: HorizontalAdaptation (P, nvmsold, bidmax, allocmax, v, vlow, vhigh)
2: if v > vhighthen
3: nvms ← nvms + 1
4: if (v < vlow then
5: pick vm to release
6: nvms ← nvms − 1
7: (N, bid) ← GetUpperBound(P , nvms, bidmax, allocmax)
8: if N < nvms then
9: release (nvms - N) VMs
10: else
11: request new nvms − nvmsold VMs
12: return nvms
13:
14: GetUpperBound(P , nvmsmax, bidmax, allocmax)
15: resources ← {cpu, memory}
16: find maximum value of N ∈ [1, nvmsmax] for which
P
r∈resources·
P [r]·allocmax[r]·N
1−allocmax[r]·NCapacity[r] < bidmax
17: nvms ← N
18: bid[r] ←P [r]·allocmax[r]·N
1−allocmax[r]·NCapacity[r] , r ∈ resources
19: return (nvms, bid)
per VM. To find the upper bound on the number of VMs, the algorithm performs a binary search between 1 and nvms by checking at each iteration if the sum of bids the controller needs to submit is less than its budget.
3.2.1 Adaptation of Two different Virtual Platforms
Let us illustrate the use of such a policy in a scenario in which a cluster needs to be shared between two commonly used frameworks: Condor [25] and Torque [40]. Users submit applications to each framework. These frameworks are usually used by scientific organizations to manage their HPC clusters. Each framework has its own scheduler which puts applications in a queue and runs them on nodes when resources become available for them. We implemented a scaling policy for each framework that uses Algorithm 3 to provision VMs. For Torque applications, the policy minimizes the wait time in queue, while for the Condor applications the policy maximizes the throughput. In both scaling policies, the framework copes with fluctuations in price in two ways. First, it avoids requesting a large number of VMs per time period, as provisioning them is wasteful if the price increases in the next period. Second it avoids starting new VMs if some VMs were released due to a price increase in the previous period. We deployed the Condor framework to process parameter sweep applications and the Torque framework to process MPI applications; both application types are commonly used at EDF. Then, we have studied how Merkat adapts the resource demand of each framework based on its workload.
We submitted 61 Zephyr applications to Torque with execution parameters taken from a trace generated using a Lublin model [26]: the number of pro-cessors was generated between 1 and 8 and the execution time had an average of 2479 seconds with a standard deviation of 1243.5. We submitted 8
parame-0 2 4 6 8 10 12 14 16 18 0 25 50 75 100 125 150 175 200 225 0 25 50 75 100 125 150 175 200 225 250 275 300 325 350 375 400 425 450 475 500 525 550 575 600 Num be r of jobs Hundr eds N um be r o f V Ms Time (minutes)
1st phase 2nd phase 3rd phase 4th phase 5th phase
0 5 10 15 20 25 30 35 40 0 25 50 75 100 125 150 175 200 225 0 25 50 75 100 125 150 175 200 225 250 275 300 325 350 375 400 425 450 475 500 525 550 575 600 Num be r of jobs N um be r o f V Ms
Provisioned VMs Sta;c share
Number of jobs in queue
(a) Torque
(b) Condor
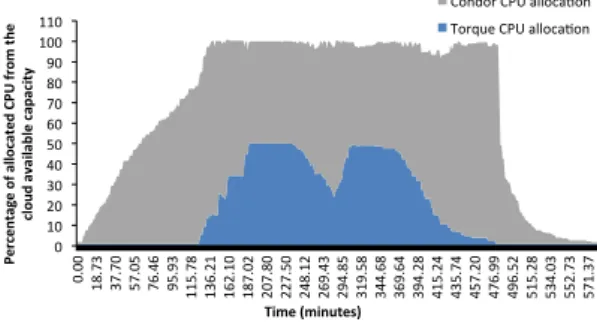
Figure 10: The variation of provisioned VMs versus queued jobs for each frame-work. 0 10 20 30 40 50 60 70 80 90 100 110 0. 00 18. 73 37. 70 57. 05 76. 46 95. 93 115. 78 136. 21 162. 10 187. 02 207. 80 227. 50 248. 12 269. 43 294. 85 319. 58 344. 68 369. 64 394. 28 415. 24 435. 74 457. 20 476. 99 496. 52 515. 28 534. 03 552. 73 571. 37 Percen ta ge o f a llo ca ted CPU fro m t he cl ou d a va ila bl e ca pa ci ty Time (minutes)
Condor CPU alloca7on Torque CPU alloca7on
Figure 11: The variation of CPU allocation for both frameworks, as a percentage of the total available CPU capacity of the cloud. We omitted the variation of memory allocation as it is similar.
ter sweep applications composed of 1000 jobs of one processor each to Condor with an inter-arrival time of one hour. As we did not have access to a real parameter sweep application, we used the stress benchmark, which ran a CPU intensive worker for different execution time intervals generated with a Gaussian distribution. The average task execution time was 478 seconds, with a standard deviation of 363. Both frameworks were deployed on 32 nodes managed by Merkat and receive an equal budget.
Figure 10 shows the number of running and queued jobs in the Torque/Condor’s queues and the number of VMs provisioned over time. If each framework is as-signed an equal share of the infrastructure, it would obtain a maximum of 112 VMs (green line from Figure 10).
We divided our experiment in five phases. In the first, third and fifth phase Merkat’s controller is capable to take advantage of the under-utilization peri-ods of the infrastructure and provision up to as many VMs as allowed by the infrastructure’s capacity for the Condor framework. In the second and fourth phase, both frameworks need more resources than their fair share to process their workload, thus each of them provisions an equal number of VMs. For
clarity, Figure 11 shows the total CPU allocation for each framework, as a per-centage from the total available cloud capacity. We have omitted the memory allocation, as it exhibits a similar trend. In contention periods, each framework receives half of the available CPU while in under-utilization periods, the Condor framework scales its CPU allocation according to its workload demand.
This experiment shows that the horizontal scaling policy allows applications to expand and shrink their resource demand according to the resource availabil-ity of the infrastructure, thus leading improving the resource utilization.
3.3
Hybrid Scaling
When needed, the previous policies can be combined. For example, the appli-cation running under a deadline constraint, can first scale its resource demand vertically. Then, if the deadline is not met and the resource demand cannot be scaled vertically anymore, e.g., it reached the maximum resource utilization
amax of one VM, the algorithm switches to the horizontal scaling policy.
3.4
Discussion
We have seen that the virtual platforms react well to both changes in system workload and user requirements. Given that the system is not highly dynamic, and the application controller has time to adapt, the application can run with a smaller resource allocation and optimize its budget. The application controller optimizes the application execution cost while allowing other applications with less budget to use resources. However, our previously-presented policies do not cover all the possible cases. For example, the user’s deadline might be too strict for the current price. In this case, the application controller might need to esti-mate the future infrastructure load and send feedback to the user regarding the minimum deadline it can meet. Starting from the simple mechanisms presented here, to improve the SLO support more complex policies can be developed, based on application profiling and price prediction.
Finally, in both our policies, the controllers use VMs with a predefined max-imum size. This size can be set up by the user, if for example she knows that her application will never use more than that, or it can be configured by the cloud infrastructure, e.g., as the capacity of the node. Nevertheless, the VM resource allocation changes dynamically, as the vertical scaling policy can steer it during the application runtime.
4
Implementation and Performance Evaluation
In this Section we analyze the performance of Merkat in terms of total user satisfaction when applications adapt their resource demands to track a given SLO and show its flexibility in supporting different user types. User satisfaction is an important metric regarding the performance of a resource management system. This satisfaction depends wether that the user’s SLO is violated or not and on how much the user actually valued the execution of her application.
We have implemented a prototype of Merkat and validated it through sim-ulation and on the Grid’5000 testbed [7]. We used simsim-ulation to test Merkat’s
algorithms with a large workload. Running a large workload gives a better in-sight in the total satisfaction that the system can provide. Due to time and resource limitations, running a large workload on Merkat in a real environment, which lasts for days, or possibly weeks, and with a large number of nodes, would have been unpractical. We discuss next the implementation of Merkat. Then we describe the results we obtained from measuring the total user satisfaction provided by Merkat in simulation and on a real-world testbed.
4.1
Performance Results from Simulation with Large Traces
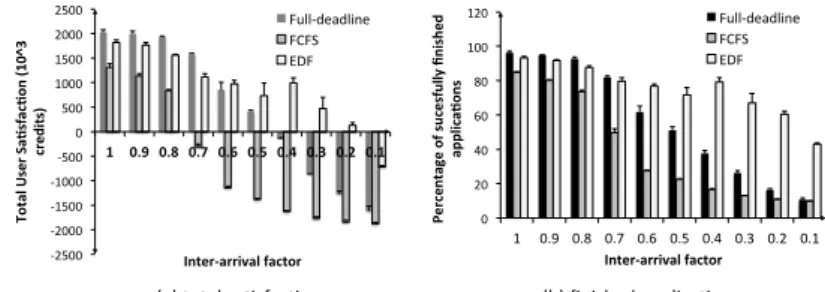
We measured the performance of our system in terms of total user satisfaction in different contention scenarios, compared to two traditional resource allocation policies: First-Come-First-Served (FCFS) and Earliest Deadline First (EDF). The first policy is usually applied by IaaS cloud managers to schedule VMs. It keeps the requests in a queue and schedules them when resources become avail-able. The second policy is used to minimize the number of missed deadlines. The requests are ordered in the queue based on their remaining time to deadline and requests with the smallest remaining time to deadline are executed first. Other deadline-based algorithms are available in the state of the art, but a large majority is specific to one application type, e.g., bag of tasks, workflows, envi-ronment, e.g., public clouds, or are offline solutions. Moreover, it is difficult to choose among these different algorithms the most representative one. Thus, we chose the EDF policy as it is well-known in the state of the art and is often used as a comparison baseline. It is important to note that cloud managers cannot practically apply EDF or similar algorithms without limiting their support to a predefined set of application goals (e.g., meeting deadlines). Nevertheless, we wanted to compare our system with a centralized system that targets a fixed type SLO.
4.1.1 Simulation Setup
We implemented the algorithms of Merkat in CloudSim [8], an event-driven sim-ulator implemented in Java. In our case, we simulate the datacenter, the VM Scheduler and multiple applications, created dynamically during the simulation. Applications are created according to their submission times, taken from a work-load trace, and are destroyed when they finish their execution. In our simulator there is no distinction between an application and its virtual platform. The application applies the resource demand adaptation policy by itself and inter-acts with the datacenter to change the bids for its VMs. As CloudSim does not model the cost of VM operations, we have also implemented a model for several VM-related performance overheads: memory over-commit, VM boot/resume and VM migration [14].
Application Model We consider batch applications composed of a fixed
number of tasks running in parallel. To finish their execution, applications need to perform a certain computation amount (e.g. 1000 iterations). These applications have a relatively stable iteration execution time. The iteration execution time depends on the resource allocation received by each task. For example, if each task receives one full core, one iteration takes 1 second. If the resource allocation drops at half, the same iteration takes 2 seconds. We
simulate these applications as sets of tasks, with each task requiring one CPU core and a specified amount of memory.
User Model To measure the total user satisfaction, we model the user
satis-faction as a utility function of the budget assigned by the user to its application and the application execution time. There are different functions which can be used to model this satisfaction, and they depend on the behavior of the user. In this paper we define several functions, derived from discussions with scientists at Electricité de France:
• Full deadline users A common case is of an user who wants the appli-cation results by a specific deadline. If the appliappli-cation doesn’t finish its execution at the deadline, the user is unsatisfied.
• Partial deadline users Some users might value partial application re-sults at their given deadline; for example, for a user who implemented a scientific method and needs to run 1000 iterations of her simulation to test it, finishing 900 iterations is also sufficient to show the good method behavior.
• Full performance Finally, other users want the results as soon as possi-ble, but they are also ready to accept a bounded delay. The upper bound of the delay is defined by the application deadline. For example, a devel-oper wants to test a newly developed algorithm. She wants the results as fast as possible, but if the system is not capable to provide them, she might be willing to wait until the morning.
Before discussing the signification of utility functions, we define the
follow-ing terms. texecis the application execution time. tdeadlineis the time from the
submission to deadline. tideal is the ideal execution time, i.e., if the application
runs on a dedicated infrastructure. work_done represents the number of itera-tions the application managed to execute until it was stopped and work_total represents the total number of iterations. B is the application’s budget per budget renewal period and per task. B is assigned by the user and reflects the application’s importance.
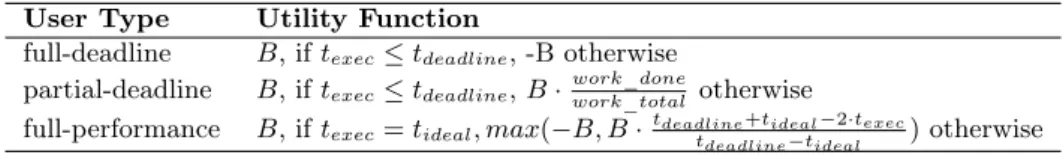
Table 1 summarizes the used utility functions. The full deadline user values the application execution at her full budget if the application finishes before deadline. Otherwise, we express her dissatisfaction as a "penalty", which repre-sents the negative value of her budget. The partial deadline user is satisfied with the amount of work done until the deadline. Thus the value of her satisfaction is proportional to this amount. The full performance user becomes dissatisfied proportionally to her application execution slowdown. We bound the value of her dissatisfaction at the negative value of her budget.
User Type Utility Function
full-deadline B, if texec≤ tdeadline, -B otherwise
partial-deadline B, if texec≤ tdeadline, B ·
work_done
work_total otherwise
full-performance B, if texec= tideal, max(−B, B ·tdeadlinet +tideal−2·texec
deadline−tideal ) otherwise
Application Policy For each user type we derive an application-specific exe-cution policy from the vertical scaling policy, presented in Section 2.3, as follows: • Full deadline: The policy is derived from the Algorithm 2. Applications start when the price is low enough to ensure a good allocation. During their execution they adapt their bids and use suspend/resume mechanisms to keep a low price in low utilization periods and to use as much resource as their SLO allows in high utilization periods. If, during its execution, the application sees it cannot meet the deadline it stops.
• Partial deadline: This policy is similar to the previous policy but, nev-ertheless, there are two differences: (i) the application suspends when a minimum allocation cannot be ensured (e.g., 30% cpu time or 30% physi-cal allocated memory); (ii) as any work done at the deadline is useful, the application always runs until its deadline
• Full performance: This policy is designed for full-performance users. The policy is similar to the Full deadline policy. Nevertheless, during its execution, the application, instead of tracking a performance reference metric, it tracks a reference allocation defined as the maximum used by the application VM. When the application cannot have a minimum allocation at the current price, the application suspends.
4.1.2 Workload
To evaluate the system performance we use a real workload trace. Real workload traces are preferred to synthetic workloads as they reflect the user behavior in a real system. Such traces are archived and made publicly available [5]. As a workload trace, we chose the HPC2N file. This file contains information regarding applications submitted to a Linux cluster from Sweden. The cluster has 120 nodes with two 2 AMD Athlon MP2000+ processors each. We assigned to each node 2 GB of memory. The reason for choosing this trace is the detailed information regarding memory requirements of the applications. Nevertheless, this information was not specified for all the applications. Thus, for applications with missing memory requirements, we assigned a random amount of memory, between 10% and 50% of the node’s memory capacity. We ran each experiment by considering the first 1000 jobs, which were submitted over a time period of 18 days. We scale the inter-arrival time with a factor between 0.1 and 1 and we obtain 10 traces with different contention levels. A factor of 0.1 gives a highly contended system while a factor of 1 gives a lightly loaded system.
We consider that all applications have a deadline and a re-chargeable budget. As we couldn’t find any information regarding application deadlines, we assigned synthetic deadlines to applications, between 1.5 and 10 times the application execution time. We assume that the budget amount the user wants to pay depends on the application’s deadline: a user with a less urgent application wants to pay less. Thus, the budgets assigned to applications are inversely proportional to the application’s deadline factor, and computed from a base budget of 2000 credits per time period.