Energies 2020, 13, 595; doi:10.3390/en13030595 www.mdpi.com/journal/energies
Article
Influence of Aging on Oil Degradation and Gassing
Tendency for Mineral oil and Synthetic Ester under
Low Energy Discharge Electrical Faults
L. Loiselle, U. Mohan Rao and I. Fofana*
Research Chair on the Aging of Power Network Infrastructure (ViAHT), Université du Québec à Chicoutimi, Chicoutimi, QC G7H 2B1, Canada; luc.loiselle@uqac.ca (L.L.); mohan.ungarala1@uqac.ca (U.M.R.)
*Correspondence: Issouf_Fofana@uqac.ca; Tel.: +418-545-5011 ext. 2514
Received: 7 December 2019; Accepted: 24 January 2020; Published: 29 January 2020
Abstract: The intent of this work is to understand the influence of low energy discharge electric faults in mineral oil and synthetic esters on liquid degradation and gassing tendency at different aging conditions (based on acidity values). A low energy discharge electric fault has been created by continuous discharge of 9 kV for five hours on the liquid surface using a suitable laboratory setup. Liquid degradation is reported by adopting UV spectroscopy, turbidity, and particle counter measurements. The gassing tendency is understood by dissolved gas analysis using Duval’s triangle and Duval’s pentagon methods for mineral oil and non-mineral oils accordingly. It is observed that the influence of low energy discharges on liquid degradation is higher in mineral oils than synthetic esters. The fault gasses in mineral oil are involved with electrical and thermal faults accompanied by stray gassing whereas only partial discharge activity is noticed for synthetic esters. Importantly, the existence of low energy discharge faults like corona discharges will involve a generation of excess high molecular weight products as compared to low molecular weight products that are soluble in liquid volume.
Keywords: Transformer; insulating liquids; ester fluids
1. Introduction
Insulation defects in power transformers are the main cause for most system failures. Insulation defects will generally be caused by impurities and air voids in the insulants. These defects will increase the normal rate of degradation of the insulants. Cellulose paper and mineral insulating liquid furnished the high voltage engineers with successful transformer insulation system. The defects in the cellulose insulants could be impurities, air in the cellulose capillaries, and moisture in the cellulose fibers. Similarly, the defects in the liquid could be moisture, conducting particles and air bubbles. It should be mentioned that the defects presented here are only in the interest of the present study, i.e., the defects that are responsible to initiate small discharges. Meanwhile, mineral insulating oils are subjected to critiques after successful usage for several decades. The prime reasons for this critique are as follows [1].
• Non-renewable sources: obtained from crude petroleum stocks. • Non-biodegradability: effects the aquatic life and is toxic in nature.
• Technical: low flash point, fire point, and requirements of higher breakdown voltages. The above aspects have been the subject of research for those interested in alternative liquid dielectrics. Several researchers reported the potential of ester dielectric fluids as a possible alternative to mineral oil [2–4]. However, there is still a great scope for research on understanding the compatibility of these new insulating fluids with transformer operating conditions.
Electrical faults within the transformer may be seen as high energy and low energy discharges. Both of these have different causes and influence phenomena. It is understood that high energy discharges will be associated with high charge concentration (typically that is enough for a breakdown) and lead to severe damages. In case of low energy discharges, the degree of vulnerability will be lesser in the beginning. Nevertheless, these low energy discharges turn as a cancer to the insulation system if not monitored. Low energy discharges initiate from the material defects and design imperfections of the insulation system [5]. Low energy faults if not taken care of, leading to severe consequences that are equal to high energy faults. The phenomenal influence of the presence of these defects are discussed in the subsequent sections of this paper.
Low energy electrical faults will play a proactive role in causing premature aging and degrading the insulation system. In fact, the extent of influence of different faults will be varying largely with the age of the insulation. The influence of electric discharges on the gassing tendency of various liquids has been reported [6]. Authors have reported the influence of corona discharges on gassing tendency of fresh and reclaimed liquids. Comparative analysis of fault gas generation for mineral oil and natural esters under thermal fault conditions has been reported [7]. It is inferred that thermal stability of natural esters is higher than mineral oil, which is accessed by means of free gas bubble formation, violent fluid convection, and behavior above 300 °C. Recently, [8] reported the fault gas generation behavior of mineral oil, synthetic esters, and natural esters for thermal faults at 250°C, 350 °C, and 450 °C. The detection of propane as a key gas for thermal faults in synthetic esters is established. Fault gas generation behavior of alternative dielectric fluids under electrical and thermal faults have been evaluated and have been previously reported [9,10] at different temperatures and moisture levels, respectively. Authors reported that figure prints of the fault gasses are comparable to mineral oil but with lower gas volumes. Therefore, non-mineral oil diagnosis methods are available for ester fluids. Other research [11] has verified low energy electrical faults and thermal stray gassing faults in laboratory environments for mineral oil ester fluids and established lower gassing tendency of ester fluids.
The potential key markers to identify the degree of degradation associated with mineral oil-based oil/paper insulation are interfacial tension and acidity [5]. Dissolved gas analysis is also considered to understand the type of fault (if any) that cause premature aging. In this work, acidity is adopted to decide the aging class of the mineral oils and esters [12]. It should be noted that the above discussed aspects are highly interrelated and depends on the molecular properties and type of liquid. Hence, the influence of liquid degradation and gassing tendency at different aging conditions of mineral oil vis-à-vis synthetic esters under different fault conditions will be of high-engineering importance. Degradation of mineral oil and synthetic esters are identified based on acidity values. It should be mentioned that after subjecting liquids to low energy discharge, electric fault degradation is accessed by dissolved decay contents, turbidity, and particle count measurements. It is well established that popular aging markers, interfacial tension, and acidity are in direct relation with the concentration of decay particles and turbidity [5]. This establishment motivated authors in selecting UV spectroscopy and turbidity as diagnostic measurements for the present study. Moreover, particle counts give the change in number of decay particles in liquid caused due to low energy electrical faults. Hence, particle count measurements are also reported in the present study.
In the present paper, the results of the study of the influence of the low energy discharge electric faults on the liquid degradation and gassing tendency of mineral oil and synthetic esters for fresh and aged liquids are presented. Mineral oil and synthetic esters at different aging conditions is subjected to a surface discharge of 9 kV continuously for five hours. Dissolved decay products, absorbance, turbidity, particle counter, and dissolved gas analysis measurements are performed on mineral oil and synthetic esters before and after surface discharge to understand the influence of low energy electric faults on liquid degradation and tendency of gassing at various aging conditions. The gas tendency of the liquids is also reported by measuring the change in pressure of the test cell.
2. Significance and Experimental
2.1. Mineral Oil and Synthetic Ester Samples
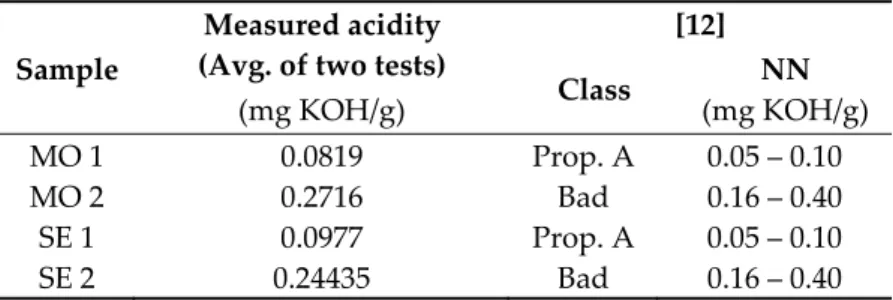
Fresh mineral oil (MO) and synthetic ester (SE) are subjected to thermal stressing as per modified ASTM D1934 at 115 °C for 2000 hours. Thermal aging is performed in presence of the copper (3 g/l) and cellulose papers (1:20) in the presence of oxygen. Later, these highly degraded and crushed oil/paper compositions are subjected to sonication for 30 seconds using Qsonica Q1375 Sonicator individually. Sonication helped further crush the degraded paper in insulating liquid and make a gentle blend of highly aged insulating liquid and paper. The blend thus formed from individual liquids is separately transferred into the fresh vacuum degassed mineral oil and synthetic ester at appropriate proportions. This blend added in fresh mineral oil is developed from aged mineral oils, whereas the blend added in fresh synthetic esters is developed from aged synthetic esters. Fresh liquids are subjected to continuous magnetic stirring under vacuum for 48 hours before mixing the blend of degraded liquids and paper. The blended proportions are aimed at bringing new mineral oil and synthetic ester to the desired level of aging factor. Normal aging of insulating liquids may or may not lead exactly to the desired values of aging. Therefore, volume addition of the developed blend (degraded oil/paper) to the liquids with known acidic values is done to achieve desired aging conditions. For reference purposes, the aging factor has been identified based on the neutralization number of the oils. Based on the liquid acidity values the flowing aging classes are obtained as shown in Table 1.
Table 1. Acidity details and class of the oil samples.
Sample
Measured acidity (Avg. of two tests)
(mg KOH/g) [12] Class NN (mg KOH/g) MO 1 0.0819 Prop. A 0.05 – 0.10 MO 2 0.2716 Bad 0.16 – 0.40 SE 1 0.0977 Prop. A 0.05 – 0.10 SE 2 0.24435 Bad 0.16 – 0.40
Therefore, there are three classes (Fresh, Proposition A, and Bad) of insulating liquids that are classified based on the aging factor. These three classes of liquids are used to understand the influence of low energy discharge electrical faults on degradation level and gassing tendency.
2.2. Low Energy Discharge Electrical Faults and Setup
Low energy discharges in transformer oil/paper insulations are mostly aroused from imperfections in the dielectric medium. These imperfections initiate creepage discharges, which if not monitored culminates into tracking within the insulation medium and leads to a possible breakdown of the insulation system. However, the operating conditions of a transformer lead to several decay products that further intensify the rate of degradation. These decay contents aids in the consequences caused by dielectric imperfections.
Corona discharges in oil/paper insulation is one of the main consequences of the dielectric defects. Intensity of corona discharges is governed by geometry (at the point of discharge), temperature, humidity, gas bubbles, etc. [13,14]. Under high electric stress, an electric field with high intensity is created within the dielectric medium. The instantaneous distribution of the electric field will not be uniform for a dielectric medium with defects. The most chances for impurities in the insulating liquid and paper medium will be air voids and air bubbles, respectively. The partial discharges are most often and arouse easily from the gas bubble since the permittivity and withstand ability of the gas is lower than the surrounding insulation medium. Therefore, the gas bubble suffers higher electric field intensity than the healthy dielectric medium surrounding it. Thus, this leads to ease of ionization and raises the availability of free electrons for leading the creepage discharges and partial discharges within the paper and insulating liquid, respectively [6]. Similarly, the presence of
a conductive particle and moisture will also lead to a discharge. Other causes of partial discharges are the presence of irregular surfaces or sharp angles with the active parts. The field at these sharp edges become locally high, which leads to discharges. Partial discharge in liquids is mostly influenced by the presence of gas or chain of globules at a solid/liquid interface, moisture, and decay conducting particles. In solids, the influencing factors are relatively similar: air voids, humidity, cracks, and shape of the interface zone with the conductor.
Partial discharges in the liquid and paper are accompanied by successive degradation of the dielectric integrity while introducing the decay particles and gasses. These decay particles and gasses further catalyze the reactions responsible for the insulation system failure. Hence, partial discharging activity in transformers has a high-engineering importance and is to be monitored closely to provide an early warning signal for inspection.
(a)
(b) (c)
Figure 1. Illustration of experimental simulation of low energy discharges and change in pressure
with discharge time: (a) setup to simulate low energy faults; (b) for mineral oil; (c) for synthetic esters. 0 2000 4000 6000 8000 10000 0 1 2 3 4 5 Pressure (Pa) Time (hours) MO Fresh MO PropA MO Bad oil 0 2000 4000 6000 8000 10000 0 1 2 3 4 5 Pressure (Pa) Time (Hours) SE Fresh SE PropA SE Bad oil
In the present study, a suitable laboratory model is developed to simulate discharge in air on the surface of the liquid (fresh and aged). This surface discharge is achieved by subjecting the high voltage electrode with 9 kV under AC stress. Firstly, the stress is increased slowly till 9 kV and later maintained for five continuous hours. The schematic of the setup used for the surface discharge is illustrated in Figure 1a. The present setup resembles the standard setup for understanding the gassing stability of the insulating liquids as per ASTM D6180. The changes in the tendency to gassing with stressing time are presented in Figure 1b and Figure 1c for fresh and aged mineral oil and synthetic esters, respectively. High voltage stress is subjected to the copper electrode to create a surface discharge on the liquid surface in air and simulate low discharge electrical faults. The high voltage electrode is a cylindrical shaped (copper) with 15 mm of diameter 10 mm long. Efforts are made to suspend it at the center of the test cell. The electrode is suspended at a height of approximately 1 inch from the liquid surface. This 1 inch is because authors closely resembled the said standard geometry for the setup. After filling of 100 ml liquid in the discharge test cell and suspending the electrode as per the geometry mentioned in the standard, one may notice an air gap of approximately 1 inch. This allows us to generate a fine discharge on the liquid’s surface. The change in gassing tendency of the insulating fluids due to discharging activity is performed by the change in pressure that is recorded by a suitable manometer. The change in pressure is recorded every hour. A liquid filled test cell is vacuumed to a pressure less than 1 Torr prior to the application of high voltage. It is noticed that the gassing tendency of synthetic esters is higher than mineral oils. It is known that esters have the tendency to release their own gasses. Therefore, to verify this, fresh synthetic ester has been tested for gassing stability without applying high voltage. The corresponding pressure changes are also presented in Figure 1c. However, the type of generated gases may vary. The information on the type of gasses are discussed in the later section of this article.
3. Results and Discussion
3.1. Influence on Liquid Degradation
3.1.1. Ultraviolet Visible Spectroscopy (ASTM D 6802)
Ultraviolet visible spectroscopy (UV/Vis) is performed as per ASTM D 6802 to understand the concentration of dissolved decay contents in the insulating fluids. UV/Vis is performed before and after simulating the discharges.
(a) (b)
Figure 2. Ultraviolet (UV) spectral curves of insulating liquids before and after discharges at
different aging conditions: (a) for mineral oil; (b) for synthetic esters.
0 0.5 1 1.5 2 2.5 360 390 420 450 480 510 540 570 600 Absorbance (Abs.) Wavelentgh (nm)
MO Fresh before discharge MO PropA before discharge MO Bad oil before discharge MO Fresh after discharge MO PropA after discharge MO Bad oil after discharge
0 0.5 1 1.5 2 2.5 360 390 420 450 480 510 540 570 600 Absorbance (Abs.) Wavelength (nm)
SE Fresh before discharge SE PropA before discharge SE Bad oil before discharge SE Fresh after discharge SE PropA after discharge SE Bad oil after discharge
The UV spectral curves of fresh, proposition A class (Prop. A) and bad class before and after low energy discharges for mineral oil and synthetic esters are presented in Figure 2. The concentration of dissolved decay contents in the liquids is changed due to low energy discharging. This is because of the ionization created by the continuous surface discharges; these discharges will generate free radicles, water, and polar solvents due to the ionization and oxidation process. The distribution of absorption curves is seen proportional to the liquid aging factor. This is because of the increase in liquid absorbance to light with increase in degradation products. It is observed that for both the liquids, for Prof A class, a significant difference is not noticed with low energy discharge. This may be attributable to the manual addition of decay particles. However, an observable difference is seen in case of mineral oil (bad class). The shift of the absorbance curves with low energy electrical faults is seen higher in case of mineral oil as compared to that of the synthetic esters. It may be therefore understood that synthetic esters exhibit a good stability as compared to mineral oils towards the degradation that is caused by corona discharges.
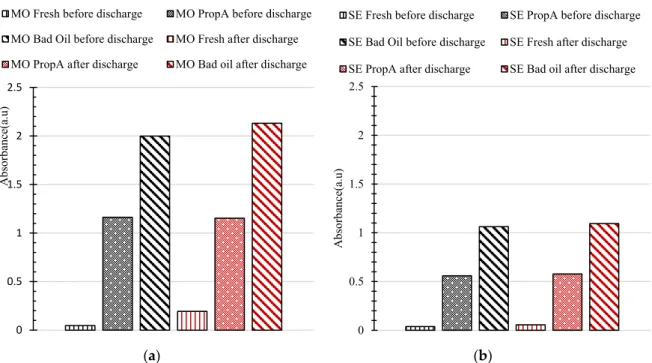
(a) (b)
Figure 3. Change in absorbance at different aging conditions for before and after discharge: (a) for
mineral oil; (b) for synthetic esters.
Liquid absorbance and turbidity are reported in this section. The changes in average absorbance at different wave lengths (360–600 nm) for before and after low energy discharges for mineral oil and synthetic esters are presented in Figure 3. The absorbance of the liquids increased proportionally with thermal degradation. However, a much less change in absorbance is noticed with low energy discharge. The possible increase in dissolved decay contents under electrical faults may be better evaluated under higher discharge times.
3.1.2. Turbidity (ASTM D 6181)
Turbidity of fresh, proposition A class (Prop. A) and bad class liquids before and after low energy discharges is measured as per ASTM D6181. The variations in the turbidity at different conditions is presented in Figure 4. The increase in decay particles that are dissolved in the liquid and high molecular weight decay contents affect the ability of the liquid to be transparent to light. As the concentration of these degradation by products increase with an increase in thermal aging, the turbidity of the insulating liquid increases. In Figure 4, it is seen that turbidity increases with aging and the trending in the turbidity of the liquids with low energy electrical discharge is seen to be similar for mineral oil and synthetic esters at different aging factors. The turbidity of fresh liquids is increased which is normal.
0 0.5 1 1.5 2 2.5 Absorbance(a.u)
MO Fresh before discharge MO PropA before discharge MO Bad Oil before discharge MO Fresh after discharge MO PropA after discharge MO Bad oil after discharge
0 0.5 1 1.5 2 2.5 Absorbance(a.u)
SE Fresh before discharge SE PropA before discharge SE Bad Oil before discharge SE Fresh after discharge SE PropA after discharge SE Bad oil after discharge
(a) (b)
Figure 4. Change in turbidity of liquids at different aging conditions for before and after discharge: (a) for mineral oil; (b) for synthetic esters.
Fresh insulating liquid is free from cellulose decay particles and other degradation products. Therefore, free radicles and oxidation products generated due to electrical discharges play a critical role in affecting the liquid quality. Therefore, the turbidity of fresh insulating liquid is seen to be increased for mineral oil and synthetic esters with electrical discharges. However, for Prop. A and bad class liquids, turbidity increased and decreased, respectively, followed by electrical discharges. The concentration cellulose decay particles are more in case of bad oils (manually added while preparing samples) as compared to Prop. A. This concentration allowed for differentiation between different classes. Therefore, it is understood that the presence of high molecular weight decay particles plays a significant role under electrical faults associated with low energy discharges. The scope of crumpling and agglomeration of free radicles and decay particles under the influence of electrical discharge (9 kV) for five hours should also be considered to understand the change in turbidity of the oils.
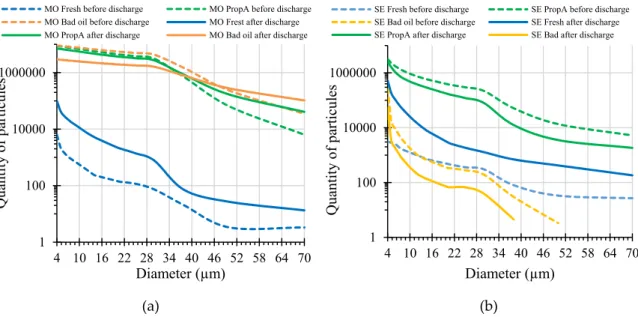
3.1.3. Particle Count (ASTM D 6786)
A programmable particle counter equipment has been employed as per ASTM D 6786 to study the number of particles in the mineral oil and synthetic ester. Each measurement is carried out three times and the average value is considered as a final particle count. It should be mentioned that 100 ml sample holder is used with 80 ml of liquid in it for each measurement. The details of particles count for fresh, Prop. A and bad class before and after low energy discharges for mineral oil and synthetic esters are presented in Figure 5. As expected, the number of particles in the liquid are increased with a simulation of electrical discharge in case of fresh mineral oil and synthetic esters. This increase in particles for fresh liquids is due to ionization and formation of free radicles due to ionization and oxidation reactions. The increase in particles for synthetic esters are slightly more than mineral insulating oils. This process is accompanied by introducing dissolved gasses, which is evident with high-pressure changes for synthetic esters in Figure 1. The analysis on the type of the dissolved gasses generated is presented in the next section.
0.1 1 10 100 1000 0.5 1 1.5 2 2.5 3 3.5
Turbidity (NTU) Before dischargeafter discharge
New Prop A Bad oil 0.1 1 10 100 1000 0.5 1 1.5 2 2.5 3 3.5 Turbidity (NTU) Before discharge after discharge New PropA Bad oil
(a) (b)
Figure 5. Change in number of particles at different aging conditions for before and after discharges: (a) for mineral oil; (b) for synthetic esters.
The number of particles in the aged synthetic ester reduced with a simulation of electrical discharge. This may be due to an agglomeration of high molecular weight decay particles, due to continues and uniform electrical discharge. Particle count results are highly influenced by the agglomeration and breaking of decay particles. The decay concentration remains in the liquid that affects other parameters of the liquid. The results presented in UV spectrum section are in support of this explanation; one may see an increase in the absorbance (aged liquids) and dissolved decay content with existence of faults. Even though the concentration of larger diameter particles is more in synthetic esters, the total number of particles is much lower than that of the mineral oils. As discussed, this is due to the manual addition of sludge. Moreover, the degradation of the cellulose insulants will not be uniform across the cellulose surface and hence contributing to different decay particles.
3.2. Dissolved Gas Analysis
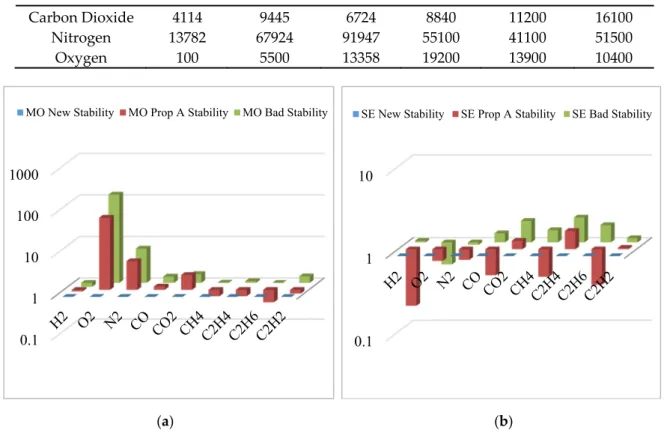
The gassing tendency of an insulating liquid is defined as the chemical decomposition of certain vulnerable hydrocarbons under the impact of electrical stresses [15,16]. In the present work, after five hours of continues electrical discharge at 9 kV, a liquid sample of 30 ml is sampled with a syringe from the discharge test cell. The 30 ml of liquid sample has been subjected to dissolved gas analysis to understand the gasses generated due to low energy discharges. The absolute values are presented in Table 2 and to report the changes clearly, per unit (p.u.) values of the change in dissolved gases with discharge are plotted in Figure 6. Absolute values of the fresh liquids are taken as reference for quick comparison.
Table 2. Absolute values of the dissolved gasses in ppm.
MO Fresh
MO Prop.
A MO Bad SE Fresh SE Prop. A SE Bad
Hydrogen 1910 1755 1527 1330 275 1390 Acetylene 16 13 23 24 25 27 Ethane 100 50 100 145 54 235 Ethylene 10 7 11 3 5 6 Methane 1004 701 1018 1080 502 1520 Carbon Monoxide 459 553 649 992 481 1280 1 100 10000 1000000 4 10 16 22 28 34 40 46 52 58 64 70 Qu an tity o f p articu les Diameter (µm)
MO Fresh before discharge MO PropA before discharge MO Bad oil before discharge MO Frest after discharge MO PropA after discharge MO Bad oil after discharge
1 100 10000 1000000 4 10 16 22 28 34 40 46 52 58 64 70 Qu an tity o f p articu les Diameter (µm)
SE Fresh before discharge SE PropA before discharge SE Bad oil before discharge SE Fresh after discharge SE PropA after discharge SE Bad after discharge
Carbon Dioxide 4114 9445 6724 8840 11200 16100
Nitrogen 13782 67924 91947 55100 41100 51500
Oxygen 100 5500 13358 19200 13900 10400
(a) (b)
Figure 6. Change in generation of dissolved gasses (p.u.) at different aging factors with low energy
discharge (stability): (a) For mineral oil; (b) for synthetic esters.
In order to have a proper interpretation of the changes, it was decided to plot p.u. values on a
logarithmic scale. For mineral oil, there is a huge increase in O2 with aging. The quantity in ppm of
O2 is increasing 134 times from a new to bad class liquid under the influence of low energy electric
faults. There is also an increase in N2 of almost seven times. The changes in other gases go from 0.8
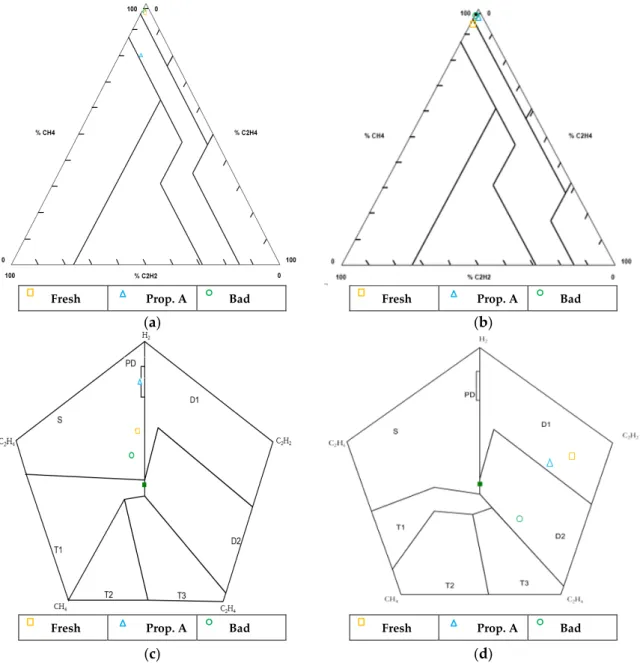
to fewer than two times. According to Henry’s law, the amount of gases dissolved in mineral oil are dependent on the partial pressure of existing gases above the surface. The degree of degradation of the liquid submitted to low energy discharge is not affecting as much the high energy discharges. The gassing tendency of mineral oil is noticed to be much lower than that of synthetic ester. There is a direct relation between the aromatic molecules and the gas absorbing effect [6]. The increase of oxygen is mainly due to breakage of chemical bonds associated with mineral insulating oil [17]. The trending of the fault gases with aging factors as per the Duval’s triangle and Duval’s pentagon methods is presented in Figure 7. The nature of fault types is noticed to be similar for both SE and MO but with different intensities. For both SE (non-mineral oil Duval triangle 3) and MO (Duval triangle 1), the faults are identified at the border of PD-T1 and DT [18]. Fault gas analysis from the Duval’s Pentagon method for synthetic esters is indicated D1 for fresh and Prop. A, which is low energy discharge (including spark type). For the bad class, D2 (high energy discharge fault) fault condition is obtained. This is because of the high concentration of conducting particles in the fluid of bad class that allowed more intensity of discharge [19]. Duval pentagon for mineral oil revealed PD (Partial Discharges) and S (Stray gassing of liquid at 120°C and 200°C) for Prop. A and bad class, respectively [20].
The difference in gassing tendency is noticed at different aging factors, which allowed the reveal for the fault gassing behavior with aging times. The aging factors are chosen based on the acidity values. This facilitated us to understand the relation between aging marker and gassing tendency of insulating liquid. As the mineral oil and synthetic ester are aging, a difference on the values of the diagnostic gasses and fault analysis results were highlighted for low energy discharges. This simulates the corona discharging activity at different operating times. According to the different diagnostic tools with those including Duval’s triangle and Duval’s pentagon, an interesting trending is especially noticed with generations of fault gasses and fault types.
0.1 1 10 100 1000
MO New Stability MO Prop A Stability MO Bad Stability
0.1 1 10
Fresh Prop. A Bad Fresh Prop. A Bad (a) (b)
Fresh Prop. A Bad Fresh Prop. A Bad (c) (d)
Figure 7. Representation of fault gasses in Duval’s triangle and Duval’s pentagon for mineral oil and
synthetic ester at different aging factors: (a) Duval’s triangle for mineral oil; (b) Duval’s triangle for synthetic esters; (c) Duval’s pentagon for mineral oil; (d) Duval’s pentagon for synthetic esters.
For low energy discharge, the fault diagnosis in the triangle witnessed a propagation from partial discharges to combine thermal and electrical faults with increase in the aging. In the case of synthetic esters, only partial discharges have been witnessed at different aging factors. Fault diagnosis with the pentagon method revealed the mineral oil involved in stray gassing and partial discharging activity with aging. Similarly, synthetic esters are observed to be involved in stray gassing and thermal fault. However, further analysis of dissolved gasses and fault diagnosis is required to further comment on the trending of fault gasses. One can better understand the gassing tendency under low energy discharges if a comparative gassing behavior is simulated for thermal faults under similar aging conditions.
5. Conclusions
The behavior of mineral oil and synthetic esters at different aging factors under low energy discharges are investigated. The influence of corona discharges (including sparking) on the degradation and gassing tendency at different aging factors has been reported. Liquid degradation is analyzed by turbidity, concentration of dissolved decay products, and particle count. The influence
of low energy electric discharge faults on liquid degradation at different aging conditions is found to be better in case of synthetic ester liquids. Dissolved gas analysis and corresponding fault diagnosis is performed by adopting Duval’s triangle and pentagon methods for mineral oil and non-mineral oils (synthetic ester). Considering the influence of degradation and gassing behavior, one may assume that the existence of electrical faults will involve a generation of excess high molecular weight products as compared to low molecular weight products. Further, depending on the degree of fault intensity, the phenomena of agglomeration or splitting of decay particles may be noticed. Under the influence of low energy discharges, the fault gasses in mineral oil are involved with combined electrical and low temperature thermal faults accompanied by stray gassing whereas only partial discharges (discharge of low energy including sparking and high energy) are diagnosed in case of synthetic esters. The propagation of fault conditions with aging is noticed to be higher in case of mineral oils as compared to synthetic esters.
Author Contributions: This work was done under the supervision of I.F. holder of the Research Chair on the
Aging of Power Network Infrastructure (ViAHT) and U.M.R at the Université du Québec à Chicoutimi, (QC, Canada). L.L. designed this research, carried out measurements and collected all the data. L.L. and U.M.R. carried out result analysis, result display and wrote the manuscript. The final draft of paper was thoroughly reviewed by I.F. U.M.R., and L.L. performed the revisions and I.F. reviewed them. All the authors read and approved the final manuscript.
Funding: This research received no external funding.
Conflicts of Interest: The authors declare no conflict of interest.
References
1. Fofana, I. 50 years in the development of insulating liquids. IEEE Electr. Insul. Mag. 2013, 29, 13–25. 2. Mohan Rao, U.; Sood, Y.R.; Jarial, R.K. Physiometric and Fourier transform infrared spectroscopy analysis
of cellulose insulation in blend of mineral and synthetic ester oils for transformers. IET Sci. Meas. Technol.
2016, 11, 297–304.
3. Przybylek, P.; Moranda, H.; Moscicka-Grzesiak, H.; Szczesniak, D. Application of Synthetic Ester for Drying Distribution Transformer Insulation—The Influence of Cellulose Thickness on Drying Efficiency.
Energies 2019, 12, 3874.
4. Rozga, P.; Stanek, M.; Rapp, K. Lightning properties of selected insulating synthetic esters and mineral oil in point-to-sphere electrode system. IEEE Trans. Dielectr. Electr. Insul. 2018, 25, 1699–1705.
5. Hadjadj, Y.; Fofana, I.; Sabau, J.; Briosso, E. Assessing insulating oil degradation by means of turbidity and UV/VIS spectrophotometry measurements. IEEE Trans. Dielectr. Electr. Insul. 2015, 22, 2653–2660.
6. N’Cho, J.S.; Fofana, I.; Beroual, A.; Aka-Ngnui, T.; Sabau, J. The gassing tendency of various insulating fluids under electrical discharge. IEEE Trans. Dielectr. Electr. Insul. 2011, 18, 1616–1625.
7. Wang, Z.; Yi, X.; Huang, J.; Hinshaw, J.; Noakhes, J. Fault gas generation in natural-ester fluid under localized thermal faults. IEEE Electr. Insul. Mag. 2012, 28, 45–56.
8. Przybylek, P.; Gielniak, J. Analysis of Gas Generated in Mineral Oil, Synthetic Ester, and Natural Ester as a Consequence of Thermal Faults. IEEE Access 2019, 7, 65040–65051.
9. Wang, Z.; Cotton, I.; Northcote, S. Dissolved gas analysis of alternative fluids for power transformers. IEEE
Electr. Insul. Mag. 2007, 23, 5–14.
10. Muhamad, N.A.; Phung, B.; Blackburn, T. Dissolved gas analysis for common transformer faults in soy seed-based oil. IET Electr. Power Appl. 2011, 5, 133.
11. Perrier, C.; Marugan, M.; Beroual, A. DGA comparison between ester and mineral oils. IEEE Trans. Dielectr.
Electr. Insul. 2012, 19, 1609–1614.
12. Gray, I.A.R. A Guide to Transformer Oil Analysis; Transformer Chemistry Service. Availiable Online: https://www.satcs.co.za/Transformer_Oil_Analysis.pdf (accessed on 29 January 2020).
13. Niasar, M.G.; Edin, H. Corona in oil as a function of geometry, temperature and humidity. In Proceedings of the 2010 Annual Report Conference on Electrical Insulation and Dielectic Phenomena, West Lafayette, IN, USA, 17–20 October 2010; pp. 1–4.
14. Clark, F.M. Insulating Materials for Design and Engineering Practice, 1st ed.; Wiley Press: New York, NY, USA, 1962.
15. Mayoux, C. On the Degradation of Insulating Materials Withstanding Electrical Stress. In Proceedings of the Annual Report Conference on Electrical Insulation and Dielectic Phenomena, Victoria, BC, Canada, 15– 18 October 2000; pp. 1–20.
16. Sabau, J.; Stockhuyzen, R. The side Effects of Gassing in Transmission Power Transformers. In proce. of Annual Report Conference on Electrical Insulation and Dielectic Phenomena, Victoria, BC, Canada, 15–18 October 2000; pp. 264–267.
17. United States Department of the Interior Bureau of Reclamation. Transformer Diagnostics. In Facilities
Instructions, Standards, and Techniques; United States Department of the Interior Bureau of Reclamation:
Washington, DC, USA, 2003.
18. Betie, A.; Rao, U.M.; Fofana, I.; Fethi, M.; Yeo, Z. Influence of cellulose paper on gassing tendency of transformer oil under electrical discharge. IEEE Trans. Dielectr. Electr. Insul. 2019, 26, 1729–1737.
19. Duval, M. The duval triangle for load tap changers, non-mineral oils and low temperature faults in transformers. IEEE Electr. Insul. Mag. 2008, 24, 22–29.
20. Duval, M.; Lamarre, L. The new Duval Pentagons available for DGA diagnosis in transformers filled with mineral and ester oils. In Proceedings of the 2017 IEEE Electrical Insulation Conference (EIC), Baltimore, MD, USA, 11–14 June 2017; pp. 279–281.
© 2020 by the authors. Licensee MDPI, Basel, Switzerland. This article is an open access article distributed under the terms and conditions of the Creative Commons Attribution (CC BY) license (http://creativecommons.org/licenses/by/4.0/).