Technology researchers and makes it freely available over the web where possible.
This is an author-deposited version published in: https://sam.ensam.eu Handle ID: .http://hdl.handle.net/10985/8367
To cite this version :
Octavie OKAMBA-DIOGO, Emmanuel RICHAUD, Jacques VERDU, François FERNAGUT, Jean GUILMENT, Bruno FAYOLLE - Molecular and macromolecular structure changes in polyamide 11 during thermal oxidation - Polymer Degradation and Stability - Vol. 108, p.123-132 - 2014
Molecular and macromolecular structure changes in polyamide 11 during
thermal oxidation
Octavie OKAMBA‐DIOGOa,b, Emmanuel RICHAUDa*, Jacques VERDUa, François FERNAGUTb, Jean GUILMENTb, Bruno FAYOLLEa a Arts et Métiers ParisTech, CNRS, PIMM UMR 8006, 151 bd de l'Hôpital, 75013 Paris, France b ARKEMA, CERDATO, LEM, Route du Rilsan, 27470 Serquigny, France Abstract The present article reports a study of thermal oxidation of unstabilized polyamide 11 films at several temperatures (90 – 165 °C) under atmospheric pressure and under various oxygen pressures (up to 1.6 MPa) at 110 °C. The chemical structure changes are monitored by IR spectroscopy (carbonyl groups) and UV‐visible spectrophotometry (yellowing). Molar mass changes are determined by size exclusion chromatography (SEC). By investigating the influence of oxygen pressure it is clearly shown that reactions involving P° radicals other than O2 addition cannot be neglected under atmospheric
pressure. Under the conditions of this study limited to relatively low oxidation levels, IR and UV measurements indicate that carbonyl groups and chromophores responsible for yellowing have the same relative yield whatever the temperature and oxygen pressure. SEC measurements highlight the significant predominance of random chain scissions over crosslinking events. Crosslinking only appears after an induction time, presumably because it involves reactions between primary oxidation products. The ratio of carbonyl groups over chain scissions is about 7.5 at low conversions and about 2.5 at high conversions, showing that α amino alkoxy radicals are mainly transformed into imides without chain scission. Keywords: thermal oxidation, polyamide, chain scission, carbonyl build up, oxygen pressure * Corresponding author.
1. Introduction
Polyamides are reactive with oxygen and undergo thermal oxidative degradation even at moderate temperature. In practice, oxidation results in the deterioration of optical and mechanical properties. Since lifetime prediction is essential for polyamide users and producers, this work is aimed at elaborating a model based on a non‐empirical kinetic scheme for predicting the time to embrittlement in given exposure condition. This article reports the first step of the kinetic approach which is the choice of reliable input data to the model and the prediction of the degree of yellowing and the molar mass value, this latter being linked to mechanical properties.
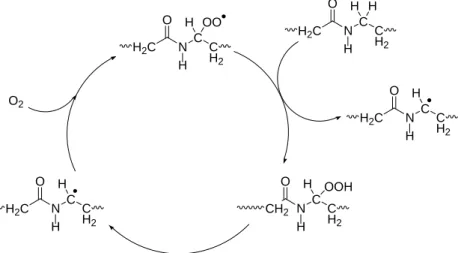
Practically, all the authors having studied polyamide thermal oxidation and model compounds have elaborated mechanisms starting from the hypothesis that oxidation is a radical chain mechanism mainly propagated by hydrogen abstraction on ‐N‐methylene. This selectivity is supported by experimental and thermochemical arguments [1,2]. Many authors assume implicitly or explicitly that the process is 100% selective that would be surprising for a radical process. In fact, little is known on the selectivity degree of this propagation mechanism. Considering in a first approach that: i) H abstraction is 100% selective and ii) 100% of initiation events result from α‐N‐hydroperoxide decomposition, it is possible to formulate the mechanistic scheme of Fig. 1. O2 H2C N C C H2 O H H OO H2C N C C H2 O H H H CH2 N C C H2 O H H OOH H2C N C C H2 O H H H2C N C C H2 O H H Fig. 1. Closed loop behavior of polyamide 11 oxidation.
Fig. 1 schematizes polyamide oxidation which is shown to have common characteristics with liquid hydrocarbon or polyolefins i.e. a closed loop behavior: radicals are generated from POOH decomposition (possibly by a unimolecular process) and propagate to yield to another POOH. Several reactions (terminations, pathways from POOH to P°) are not shown in the aim of simplicity.
In a recent review, we analyzed data from literature using kinetic analysis in order to assess reliable values of kinetic parameters [3]. However, we faced several contradictions:
‐ According to El‐Mazry et al [4], the ratio between chain scissions and carbonyls would be close to unity, contrary to the experimental observation by Sagar [5] and later Lemaire et al [6] according to which imides are the main oxidation product. Since imides are formed without chain scission, the ratio of chain scission/carbonyl would be expected significantly lower than 1.
‐ In our attempts to simulate existing kinetic curves from oxygen uptake or carbonyl build‐up in air [3], we applied an extremely high rate constant value for the termination reaction (6) involving two peroxy radicals:
(6) POO° + POO° inactive products
However, how can we ensure the real value of this constant has been correctly assessed? An overestimation is likely to happen since we neglected other termination processes such as: (4) P° + P° inactive products (5) P° + POO° inactive products Both processes are expected to have higher rate constants than the one associated to (6) [7,8]. In the present study, new data are brought in order to discuss the previous questions: ‐ Ageing experiments under several oxygen pressures are performed in order to get accurate values for termination rate constants [7], ‐ A special attention is paid to molar mass distribution changes determined by size exclusion chromatography (SEC). The latter technique [9,10] appears to be relevant in comparison with rheometry measurements [4] where part of the oxidized polymer may undergo thermolysis as the measurements are performed in molten state. Furthermore, SEC is expected to be more informative than viscosimetry (only MW [11]) with the aim of quantifying the dual chain
scission/crosslinking process in polyamides.
‐ Attention is also paid to physical properties, especially optical (yellowing), suggesting correlation between their changes and oxidation induced structural changes.
2. Experimental
2.1. Material
Unstabilized 70 µm thick PA11 film was prepared at 240 °C from PA11 pellets provided by ARKEMA in a single screw extruder RCP‐0750 (Randcastle). This thickness value was chosen to avoid diffusion limited oxidation.
2.2. Accelerated ageings
PA11 films were placed in an air ventilated ovens XUO 32 (France Etuves) at temperature range between 90 and 165 °C. Samples were also aged in autoclaves at 110 °C under oxygen pressure (between 0.3 and 1.6 MPa). The samples were dried overnight under vacuum at 50 °C before ageing. 2.3. FTIR spectroscopy
Infrared spectra were collected in transmission mode using a Perkin Elmer Frontier spectrophotometer in the range 4000 ‐ 400 cm‐1 at 4 cm‐1 optical resolution and 32 scan repetitions. The determination of the imide absorption band in the carbonyl area is carried out by the investigation of diacetamide (D5950 Aldrich), assumed to be a pertinent model compound. Different concentrations of diacetamide are prepared in CHCl3 in order to determine the imide molar
extinction coefficient. The solutions were placed in a KBr sealed cell of 100 µm optical path (GS0131 Specac) to perform the IR spectra.
2.4. UV –Visible spectrophotometry
Transmission UV‐Visible spectra were recorded on a Perkin Elmer Lambda 35 UV/Vis spectrophotometer between 200 and 800 nm.
2.5. Size exclusion chromatography (SEC)
Molar mass of PA11 films was determined by SEC [9,10]. Samples were dissolved in 1,1,1,3,3,3‐ hexafluoroisopropan‐2‐ol (HFiP – ≥99 % purity – VWR) with a concentration of 1 mg ml‐1. After a gentle manual agitation, the solution was allowed to rest overnight at room temperature. Samples were injected in the chromatograph (Water alliance 2695) after a filtration on Acrodisc CR PTFE 0.2 µm (Pall Light Sciences). The separation was performed using a pre‐column and two columns packed with 7‐µm particles, and 1000 Å and 100 Å pore size, both supplied by Polymer Standards Services (PSS), Mainz, Germany. The dimension of columns was 8 mm ID x 300 mm length. The columns were thermostated at 40 °C. The operating conditions were as follows: the mobile phase was a mixture of HFiP + 0.05 mol l‐1 potassium trifluoroacetate (KTFAc), flow rate was 1 ml min ‐1 and injection volume was 100 µl. The detection module was performed using a WATERS 410 differential refractive index detector and data treated with PSS WinGPC unity v.5 SEC software. The calibration was built using poly(methyl methacrylate) standards supplied by Polymer Laboratories (Varian), Church Stretton, UK, with molar mass ranging between 420 and 1 900 000 g mol‐1 and calibration curve was adjusted with an order 5 polynomial. Average molecular weights are expressed in PMMA equivalent.
3. Results
3.1. Infrared spectra
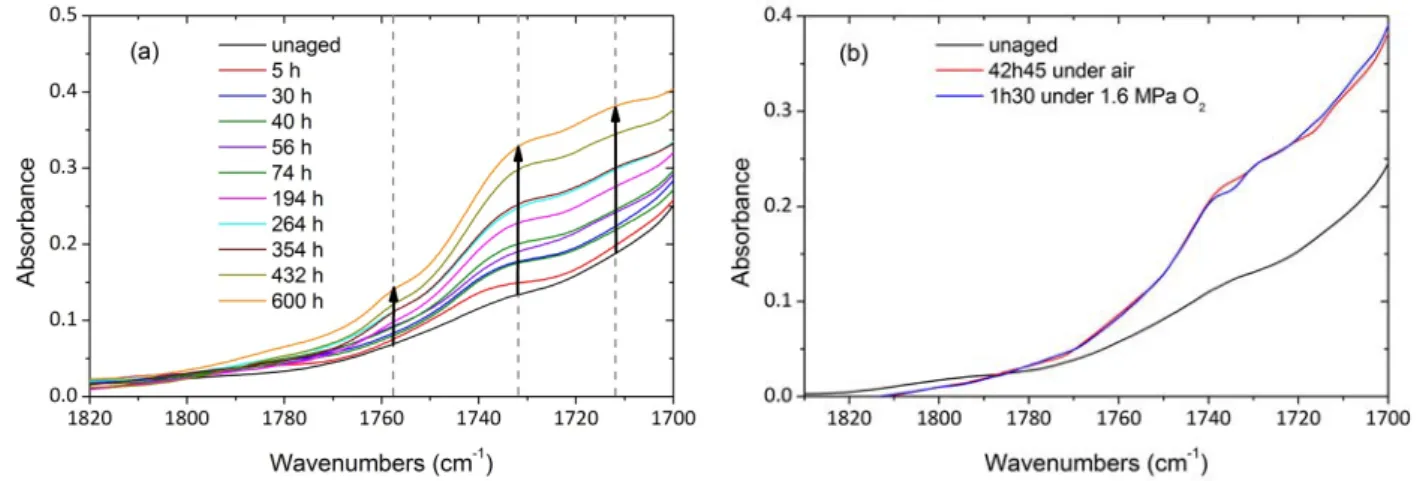
Mid infrared spectroscopy is classically employed to investigate oxidation products especially carbonyl species. Fig. 2. is a zoom on carbonyl species absorption area which is a massive shoulder. Fig. 2. Carbonyl absorption area during thermal ageing of PA11 films under air at 110 °C (a) and comparison of IR spectra during air ageing and under oxygen pressure at 110 °C (b) The spectra show a noticeable growth of a wide band between 1770 and 1700 cm‐1. Fig. 2b. displays IR spectra of oxidized PA11 in air and under oxygen pressure (1.6 MPa) at approximately the same conversion degree. The spectra have a similar shape, suggesting that oxidation under high oxygen pressure does not change the relative proportion of carbonyl species formed from POOH decomposition. Three significant new peaks appear in the carbonyl region. The peak fitting tool in OriginPro 8 software from OriginLab® enables to find and fit peaks in our spectra (Fig. 3).
Thus, the three characteristic bands emerging slightly from the massive shoulder were detected at 1756 cm‐1, 1734 cm‐1 and 1711 cm‐1, and they are observed whether the ageing is carried out under under air or oxygen pressure.
According to the mechanistic scheme of Fig. 1., the unique precursor of carbonyl groups would be the alkoxy radical resulting from ‐N‐hydroperoxide decomposition whatever its molecularity in Fig. 4. CH2 N C C H2 O H H OOH H2C NH O H HC C H2 O H2C N C H O H O H2C (a) (b) H2C N C C H2 O H O (c) (d) CO=1, s=1 H2C N C C H2 O H OH H fast decomposition CO=1, s=1 CO=0, s=0 CO=1, s=0 HOC C H2 O O2 O2 H2C N C OH O H O (e) (f) Fig. 4. Some carbonyl species formed during PA thermal oxidation with carbonyl and chain scission yield corresponding to chemical reactions. Sagar’s study on N‐alkylamide oxidation revealed that imides are the main oxidation products (c) [5]. However, alkoxy radicals have other routes of reaction among which hydrogen abstraction leading to a (probably unstable) alcohol (d) or β scission (b) leading to the formation of an aldehyde and a primary macroradical. It is reasonable to assume that aldehydes undergo fast over‐oxidation in the presence of oxygen and form the corresponding carboxylic acid (e and f). Oliveira et al [12] put forward the formation of carboxylic acids and esters during PA11 thermal oxidation. In the case of photo‐oxidation, Lemaire et al suggested that carboxylic acids are formed by the hydrolysis of imides [6,13]. The imide group IR absorption band is found to be at 1738 and 1698 cm‐1 from diacetamide IR spectrum in CHCl3. Roger [13] also assigns the absorption bands at 1735 and 1690 cm‐1 to the imide
group in the case of PA12 photo oxidation. Carboxylic acid (e) displays an absorption band at about 1710 cm‐1 [14,15,16]. Thanks to this analysis of oxidation chemical reactions, it is possible to propose the following IR absorption band assignments (Table 1).
Band absorption (cm‐1 ) Carbonyl chemical structure 1756 Isolated carboxylic acids [17] 1734 H2C NCC H2 O H O (d) 1711 HO C C H2 O (e) Table 1. Carbonyl absorption band assignments. All the species absorbing in 1700‐1770 cm‐1 spectral range grow almost proportionally and there is no other noticeable change in the whole IR spectrum that seems to confirm the hypothesis that most of the stable oxidation products come from a unique precursor, this latter being presumably the α‐N alkoxyl. It is thus reasonable to assume that the change of a given band, for instance the one at 1734 cm‐1 linked to imides which are assumed to be the main oxidation products [5,6], is representative of the whole conversion of the oxidation process. Molar absorption coefficients are needed to estimate concentrations and some of these latter have been compiled in Table 2. Carbonyl specie IR band (cm ‐1 ) (l mol ‐1 cm ‐1 ) References R‐CONH‐R' 1680 502 [18] RCO2H 1712 680 [14] 1715‐1710 847 [15] 1715 590 [16] Diacetamide 1738 285 ‐ Table 2. Molar extinction coefficient values for some carbonyl species Based on tables 1 and 2, the following assignments are suggested: carboxylic acids (1756 and 1711 cm‐1) and imide (1734 cm‐1), and the corresponding molar absorption coefficients: acid (680 l mol‐1
cm‐1) and imide (285 l mol‐1 cm‐1). The concentration of each carbonyl species is directly calculated
from the IR spectra by Beer Lambert’s law and it is displayed in Table 3 for some accelerated ageings.
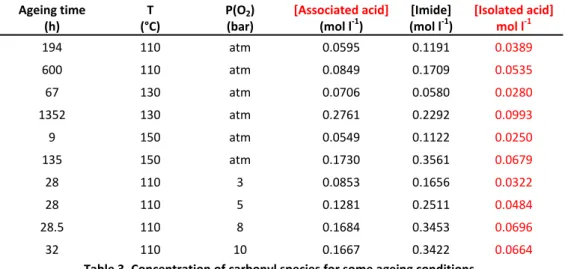
Ageing time (h) T (°C) P(O2) (bar) [Associated acid] (mol l‐1) [Imide] (mol l‐1) [Isolated acid] mol l‐1 194 110 atm 0.0595 0.1191 0.0389 600 110 atm 0.0849 0.1709 0.0535 67 130 atm 0.0706 0.0580 0.0280 1352 130 atm 0.2761 0.2292 0.0993 9 150 atm 0.0549 0.1122 0.0250 135 150 atm 0.1730 0.3561 0.0679 28 110 3 0.0853 0.1656 0.0322 28 110 5 0.1281 0.2511 0.0484 28.5 110 8 0.1684 0.3453 0.0696 32 110 10 0.1667 0.3422 0.0664 Table 3. Concentration of carbonyl species for some ageing conditions. Table 3 points out that imides are the main carbonyl product that supports the results from literature [5,6]. However, the IR spectra deconvolution (Fig. 3.) shows some overlapping of other carbonyl bands with imide one. In a routine study, imide concentration is directly determined from the spectrum applying the Beer‐Lambert law to the absorbance at 1734 cm‐1 without any correction. The corresponding imide concentration is firstly named [Im]rout. A theoretically better way consists in
determining the absorbance of this peak on a deconvoluted spectrum using the same molar extinction coefficient. The corresponding concentration is called [Im]dec. The relationship between
both imide concentration values is illustrated in Fig. 5.
Fig. 5. Relationship between “routine” and “deconvoluted” imide concentration values.
The slope deviation from unity indicates the importance of band overlappings in the uncorrected spectrum. This slope value can be used as a correction factor to determine “real” imide concentration from uncorrected spectra. In fact, deconvolution is useful to have better values but it is a time‐consuming procedure. Since imide concentration is considerably higher than acid ones, in a first approximation one can consider that [Im]rout is the (slightly underestimated) global carbonyl
band assignments, it was hence preferred to consider the overall carbonyl concentration directly measured from the absorbance at 1734 cm‐1 (corresponding to [Im]rout renamed [PC=O]1734cm‐1 in the
following of the study) presumably linked to the predominant imides.
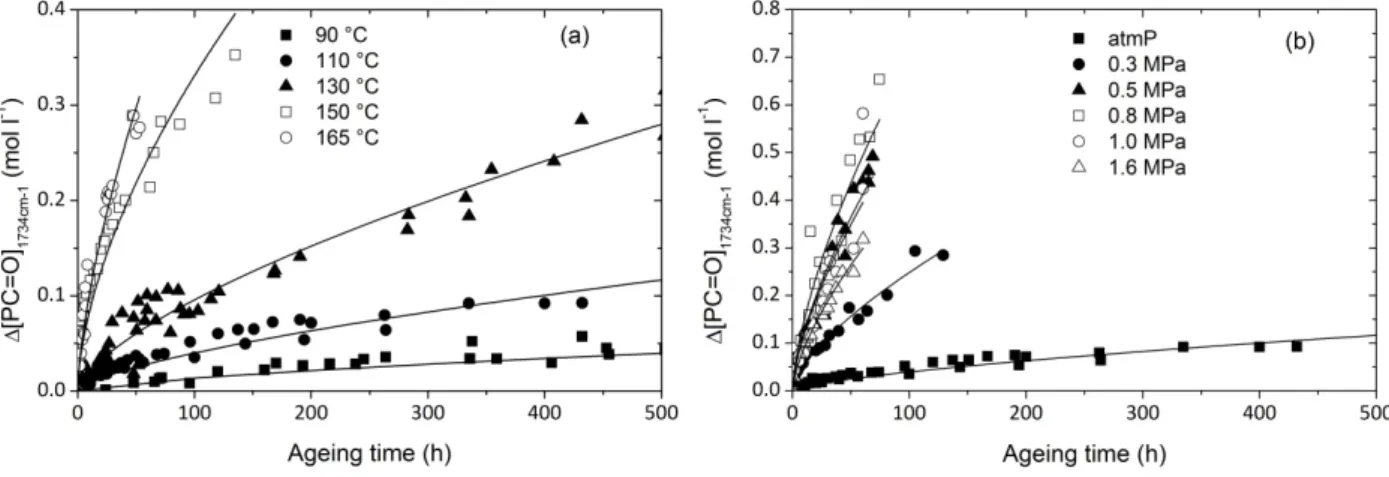
Kinetic curves of this carbonyl concentration for all the exposure conditions under study are presented in Fig. 6.
Fig. 6. Kinetic curves of carbonyl concentration at various temperatures (a) and oxygen pressures at 110 °C (b).
In Fig. 6, the experimental data are fitted with a simple power law (lines) of exponent 2/3 which is not a kinetic model. A significant feature of polyamide 11 (and other aliphatic polyamides [3,4,19,20, 21]) is the absence of induction period that is typical of polyolefins oxidation for instance. Here, oxidation rate is maximal at the beginning of exposure. In the following, initial rate r0 is chosen for
the kinetic analysis and, carbonyl concentration is assumed to be close to the whole quantity of oxygen reacted per volume unit or, at least that both quantities are proportional irrespective of temperature or oxygen pressure. This hypothesis allows using certain laws established for oxygen absorption, where the oxygen pressure dependence is taken into account. For instance, it was established that in certain conditions, especially stationary state and long kinetic chains, the oxidation rate can be described as an hyperbolic function of oxygen pressure [22]. To put in evidence the oxygen pressure dependence in our case, the initial carbonyl growth rate is plotted against oxygen pressure in Fig. 7.
Fig. 7. Initial carbonyl growth rate against oxygen pressure at 110 °C.
Despite a noticeable scatter, one can recognize a trend towards an hyperbolic shape, oxidation rate tending to become pressure independent above, typically, 0.5 MPa i.e. above a critical O2
concentration [O2]c ~ 7.510‐4 mol l‐1 by assuming an oxygen solubility coefficient of 1.510‐8 mol l‐1
Pa‐1 [23]. An important implication of this result is that, under atmospheric pressure (pO2 = 0.02 MPa),
reactions of P° radicals, especially terminations, can occur and must be taken into account in mechanistic and kinetic schemes.
3.2. UV‐Vis spectrophotometry
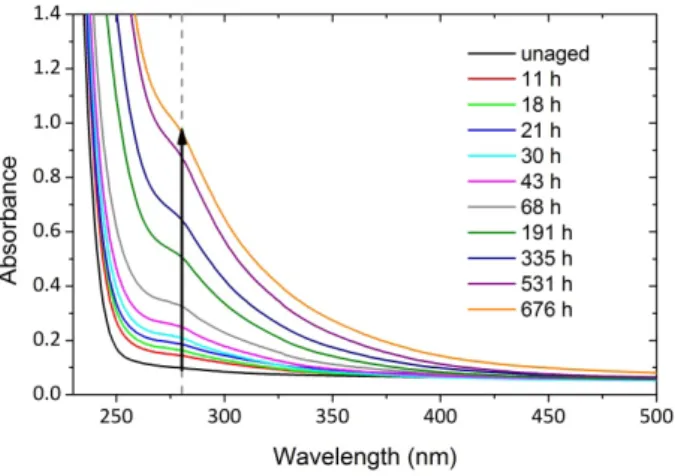
UV‐Vis spectra were collected in order to monitor PA11 discoloration. Fig. 8. shows the changes in the spectra during air ageing at 110 °C at various ageing times.
Fig. 8. UV‐Vis spectrum changes during air ageing of unstabilized PA11 films at 110 °C.
A wide band displaying a maximum at ca 280 nm and extending up to 470 nm grows during exposure. Indeed, since the sample absorbs in the violet‐blue part of visible spectrum (λ > 380 nm), it becomes progressively yellow then brownish. A yellowness index could be determined from absorbance measurements [24] but it was preferred here to use the absorbance change at 280 nm
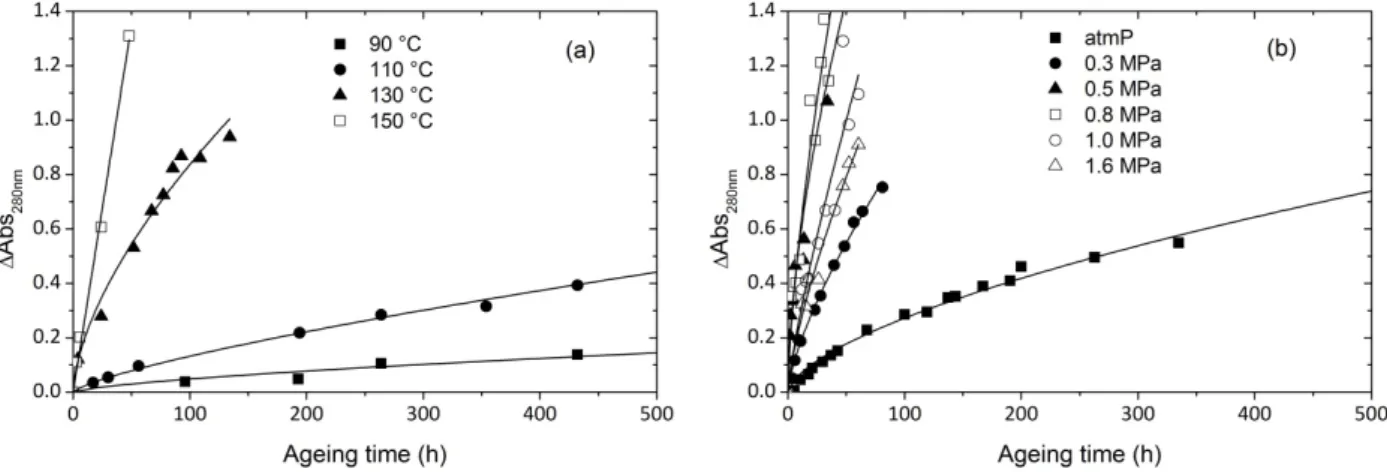
owing to higher sensitivity as long as it remains below 1.4 O.D. units. The absorbance at 280 nm corresponds to a shoulder that comes out at the beginning of exposure and grows during oxidation. This shoulder is arbitrarily chosen as a relevant discoloration index. Kinetic curves of absorbance changes at 280 nm are plotted at various temperatures and oxygen pressures in Fig. 9.
Fig. 9. Kinetic curves of 280 nm absorbance changes at various temperatures (a) and oxygen pressures at 110 °C (b)
These curves display the same trends as carbonyl curves of Fig. 6., with no induction period, a maximum rate at the onset of exposure and a shape which could be approximated by the same power law of exponent 2/3 (lines in Fig. 9), suggesting that both chromophores and carbonyl species are sharply linked and have probably the same precursor.
3.3. SEC measurements
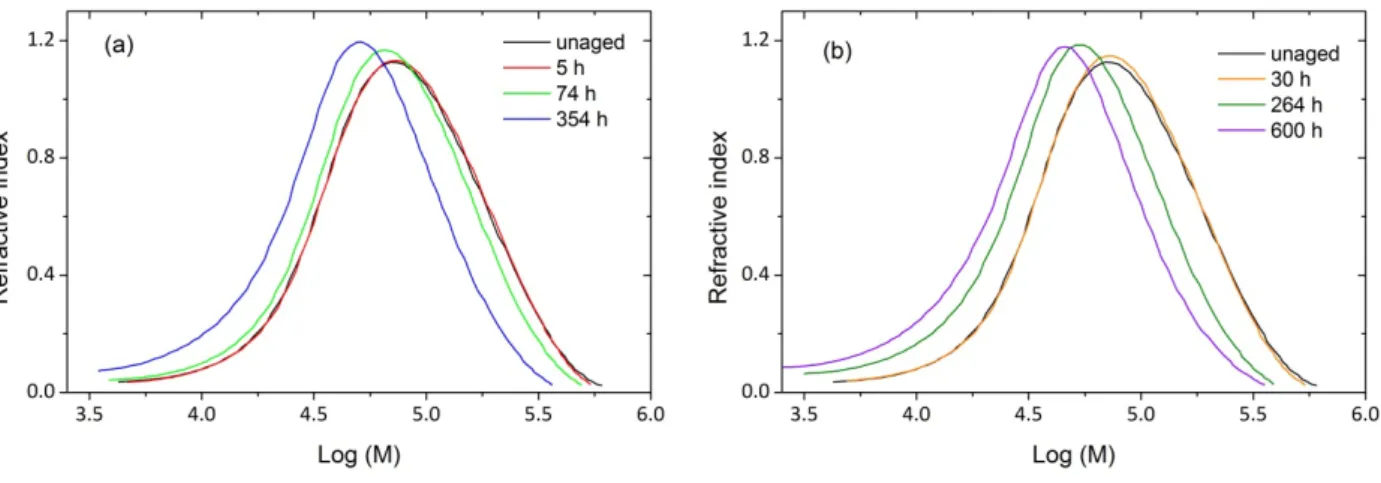
Thermal oxidation is expected to modify molar mass distribution as it leads to chain scission or crosslinking reactions. Molar mass distributions obtained by SEC during an exposure at 110°C in air are shown in Fig. 10. A shift toward low molar mass values is observed whereas the distribution shape remains globally unchanged. The latter result supports the previous assumption that oxidation of our 70 µm thick samples is not limited by oxygen diffusion. Otherwise, an heterogeneous oxidation process would lead to a secondary peak appearance or, at least, it would broaden the distribution.
Fig. 10. Molar mass distribution changes during air ageing at 110 °C (a and b). In order to have a better outlook of the distribution shape and its changes during exposure, it was chosen to separate some results into two graphs instead of having one overloaded graph. It should be noted that for all sample the chromatograph surface/sample amount ratio remains constant that is to say that there is no insoluble part. Thus, molecular weight distribution is representative of the whole samples. The distribution as determined by SEC gives access to average molar masses Mn and
Mw values. However, Mn value is less precise than Mw as it is difficult to choose the integration limit
in low molar mass region. This comes from the fact that the chromatogram exhibits gently a tail in low molar weight region with no real return to baseline before the elution end column peak corresponding to eluent impurities. The number of chain scission (s) and crosslinking (x) events per mass unit can be assessed according to Saito relationship assuming random chain scission and crosslinking processes [25]:
(Eq. 1)
2 (Eq. 2)
In Fig. 11a and 11b, weight average molar mass changes are reported for all exposure conditions under study. It also displays PI (Polydispersity Index) (11c) and x changes (11d) as a function of s (chain scission events per mass unit).
Fig. 11. Average molar weight changes during isothermal air exposure from 90°C up to 165°C (a), 110°C from air up to 1.6 MPa of oxygen (b), PI as a function of number of chain scissions (s) during isothermal exposures from 90°C up to 150°C and at 110 °C from 0.5 to 1.6 MPa of oxygen (c) and, chain scissions (s) and crosslinks (x) numbers during isothermal air exposure from 90 up to 150 °C and at 110 °C from 0.5 to 1.6 MPa oxygen pressure(d). These curves reveal a relatively complex behavior that we attempt to summarize here: Increasing temperature results in accelerating the decrease of molar mass (Fig. 11a). Post‐polycondensation predominates in the early hours of exposure, only under atmospheric pressure at 110°C (Fig. 11b) and at 90 °C. This phenomenon induces a slight molar mass increase without a change of polydispersity. Its influence on the course of oxidative degradation can be neglected.
The fast decrease of molar mass observed in all the cases in timescales longer than 50 hours clearly indicates the significant predominance of chain scission. In the early stage of exposure, polydispersity index remains equal to 2.0‐2.1 revealing an almost pure and homogeneous random chain scission (Fig. 11c).
Beyond a certain level of degradation corresponding to about s = 0.013 mol kg‐1, the
polydispersity begins to increase. Saito’s equations display a positive x root that points out the appearance of a crosslinking process explaining the polydispersity index increase (Fig. 11 c and d).
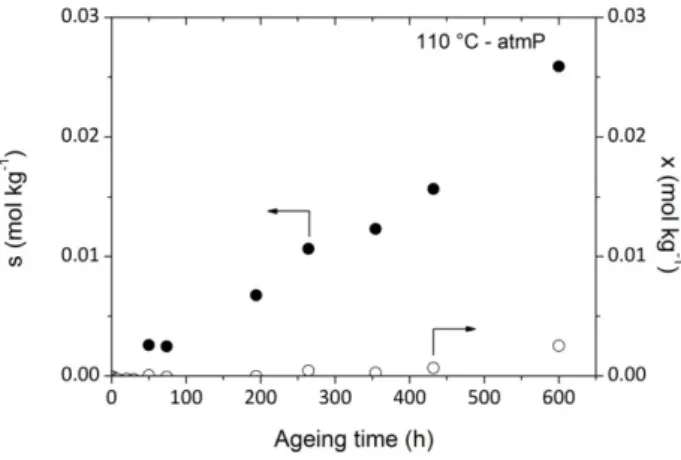
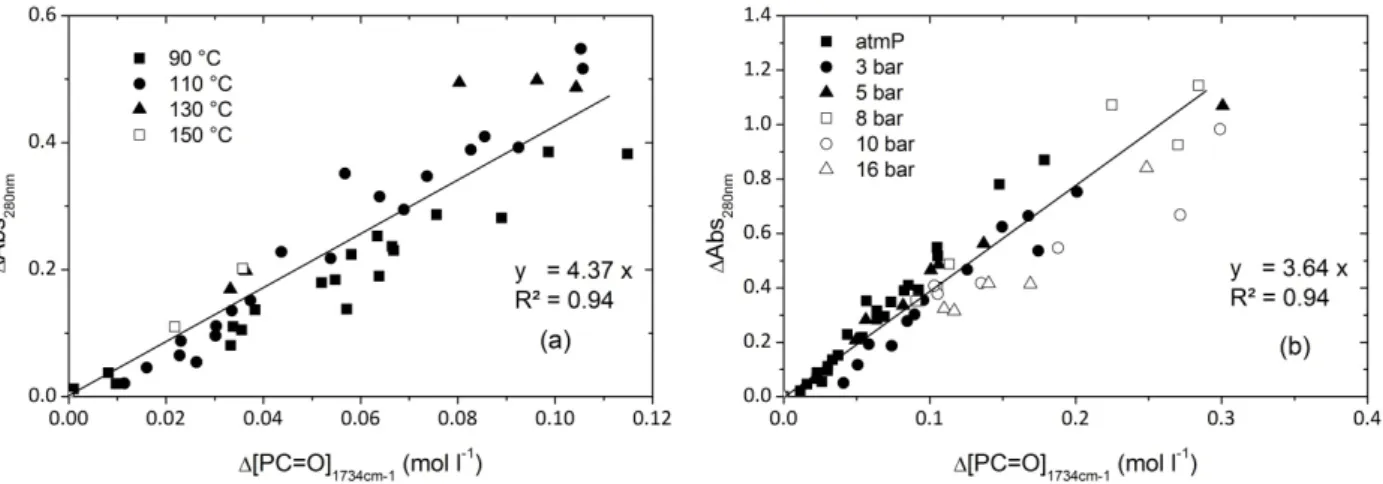
Fig. 12. displays chain scission and crosslinking number changes as a function of time during air ageing at 110 °C. It appears clearly that crosslinking is disfavored but not totally inhibited by an oxygen pressure increase (Fig. 11d). “In fact, under oxygen excess P° mainly reacts with oxygen to form POO° radicals. Termination reactions between P° and P° and between P° and POO° are negligible while termination reactions between POO° + POO° are predominant [7]. As a result, even if the occurrence of some crosslinking event would thus be linked to P° + POO° or to POO°+POO°, crosslink event from P° + P° is removed by increasing oxygen pressure”. However, since always 4x << s, chain scission largely predominates. Fig. 12. Chain scission (s) and crosslink (x) numbers as a function of time during isothermal air exposure (110 °C). 4. Discussion 4.1. Discoloration According to Dong and Gijsman [18], a correlation between yellowing and oxidation exists for PA6 in the case of thermal oxidation between 120 and 170°C under air. Therefore, it seemed interesting to plot the changes in absorbance at 280 nm against the carbonyl concentration for several exposure conditions differing by temperature or oxygen pressure (Fig. 13).
Fig. 13. UV absorbance at 280 nm as a function of carbonyl concentration whatever the temperature of exposure in air (a) and whatever the oxygen pressure at 110°C (b).
The ratio between the concentrations of chromophoric species and carbonyls seemed to remain almost the same in the whole range of exposure conditions under study. In other words, it is tempting to suppose that the chromophoric species carries a carbonyl group and is a “primary” oxidation product.
According to a brief literature review, several types of carbonyl species have been imagined:
‐CH2‐CH=CH‐NH‐CO‐ coming from the disproportionation of an alkyl radical in position of
the amide group with another radical [12,26]. This reaction is not expected to occur under oxygen excess regime, where each P° is immediately scavenged by oxygen to form a peroxy radical, inhibiting thus the formation of such unsaturated species. In other words, those species are not expected to be the main cause of yellowing.
Biacetyl compounds ‐CH2‐NH‐CO‐CO‐ [27] generated by a co‐oxidation mechanism i.e.
involving other ‐CH2‐ than those in ‐position of the amide groups. Such secondary reactions are expected to have an increasing yield with the conversion of the oxidation process. Here, we observe that the yield of chromophores is maximal at the onset of exposure, which seems to disagree with the hypothesis in question. Compounds generated from the direct oxidation of ‐ CH2, whether from the decomposition of hydroperoxides or the termination between two peroxy radicals and among which are for instance imides, aldehydes and carboxylic acids in ‐position of amide groups [5,6] and their derivatives (e.g. conjugated carbonyls resulting from the crotonization of aldehydes [6]).
The fact that the correlation between yellowing species and carbonyl compounds remains valid whatever the temperature and the oxygen pressure in the investigated range militate in favor of the
third hypothesis. In other words, if a whole oxidation kinetic model is available, it can be used to predict yellowing using only a proportionality relationship.
4.2. Chain scissions
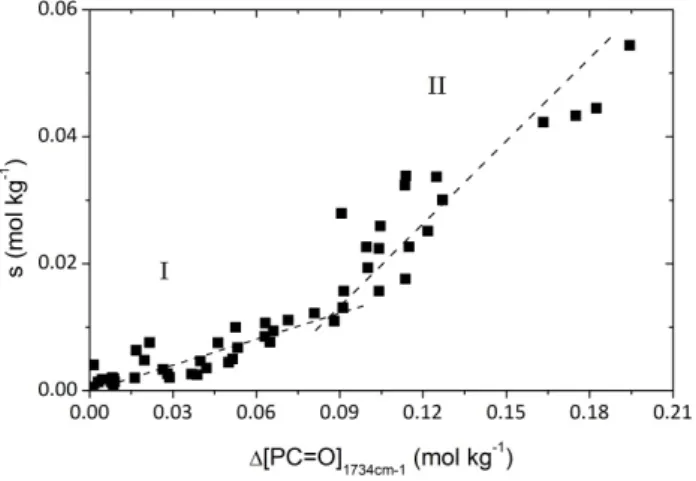
Chain scission numbers determined from Equations 1 and 2 are plotted versus carbonyl concentration for all ageing exposures under study (Fig. 14).
Fig. 14. Chain scission number as a function of carbonyl concentration whatever the temperature of exposure in air and whatever the oxygen pressure at 110°C.
During the early period of exposure, typically for [PC=O]1734cm‐1 ≤ 0.09 mol.kg‐1, there is a
proportionality between [PC=O]1734cm‐1 and s, the ratio being about 0.13 scissions per carbonyl
group. This ratio increases at high conversions but remains lower than 0.5. It is also lower than in the case of polyethylene (see below); thus, the low yield of chain scission in the early period of exposure suggests that methylenes other than α ones are not significantly attacked. Since hydroperoxides are instable, there is a relatively high yield of the presumed precursor of carbonyls and chain scissions i.e. the alkoxy radical; therefore, the low yield of chain scissions indicates the existence of an efficient competitive process. In Fig. 15. four possible reactions from alkoxy radicals are presented. Only one, presumably cage disproportionation with another alkoxyl in a termination process occurs without chain scission and leads to an imide group. It can be concluded that reaction (c) which is the imide formation is the major route for alkoxyl reactions that confirms literature data [5,6]. There are many hypotheses in the literature, explaining the increase of the chain scission yield at high conversions: The conversion of primary decomposition product of the alkoxy radicals into products with a higher yield in chain scission. For example, Roger et al [6,13] have proposed the subsequent hydrolysis of imides into amide and carboxylic acid, thus increasing the number of chain scission for a given concentration of carbonyl compounds. Another possible reaction is the
decomposition of ‐N alcohol –CH2‐CHOH‐NH‐CO‐ into an aldehyde and a primary amide as proposed by Lemaire [6]. The other option, as previously mentioned, is the oxidation of methylenes in , , position that will be called later ‐methylenes. Their oxidation is expected to be similar to polyethylene one. It was observed by Khelidj et al [28] that the relative yield of carbonyl over chain scission varies from 0.3 to 3.5 between 90 and 150°C i.e. the number of chain scissions per carbonyl group would be higher in PE than in PA11. One can deduce that if methylenes were attacked, they would have a relatively high contribution to chain scission because of the higher reactivity of ‐N‐methylene. In our previous work [3], the bond dissociation energy (BDE) of (‐N‐C‐H) is about 355 kJ mol‐1 against ~ 390 kJ mol‐1 for BDE(,,‐C‐H). Therefore, radical attack is first expected to occur on the ‐N‐methylene. 4.3. Assessment of kinetic parameters
According to the above observations, it can be assumed that, in the early period of exposure, oxidation attacks selectively the α‐N‐methylenes. Since hydroperoxides were found to be relatively instable, it can be assumed in a first approach that POOH decomposition is unimolecular. These assumptions lead to the following mechanistic scheme: (1) POOH 2P° + CO.PC=O + S.s (k1) (2) P° + O2 POO° (k2) (3) POO° + PH POOH + P° (k3) (4) P° + P° inactive products (k4) (5) P° + POO° inactive products (k5) (6) POO° + POO° inactive products (k6) As observed in Fig. 7., oxidation in oxygen excess regime occurs when the O2 pressure is higher than 0.5 MPa. This means that above 0.5 MPa, terminations (4) and (5) can be neglected and a solution of the simplified kinetic scheme becomes achievable as the propagation rate constants k2 and k3 are
known. Their values have been estimated as follows: It can be shown that since oxygen addition to radicals is very fast (k2 ~ 108±1), the whole oxidation rate is not very dependent of the chosen value of
k2 which has been arbitrarily taken equal to 108 l mol‐1 s‐1. Concerning k3, according to our previous
investigation [3], k3[PH] ~ 100 s‐1 at 110°C.
[O2]C ~ k3k5[PH]/k2k6 (Eq. 3)
Where [PH] is the concentration of abstractable hydrogens (here the ‐N‐CH2) equal to 5.5 mol l‐1 for
PA11.
Let us recall that the determination of rate constants by an inverse approach (i.e. using the kinetic model to simulate the experimental results by a try‐and‐error procedure) is intricate because seven rate constants (in the simplest case) have to be determined from relatively simple curves. In such cases, the inverse problem could admit multiple solutions. Several sets of rate constants values could be employed for getting comparable simulations. For this reason:
‐ Propagation rate constants k2 and k3 are arbitrarily fixed from literature data. By using Eq. 3, one
obtains k2k6/k5 ~ 105 l mol‐1 s‐1 [3].
‐ The chosen set of rate constants has to allow the simulation of, not only, carbonyl build up curves, but also hydroperoxides, oxygen absorption and chain scission ones.
Here, the oxidation study under several oxygen pressures conditions gives a supplementary requirement for the set of rate constants to be determined from the inverse approach. Let us consider Arrhenius plot of all oxidation rates. In Fig. 16., we compare : ‐ oxidation under atmospheric air for PA11 (this work) ‐ oxidation under atmospheric air for PA6 (from the paper by Dong and Gijsman [18]) ‐ oxidation under 2.0 MPa corresponding to the oxygen excess regime for PA11. Fig. 15. Arrhenius plot for PA11 ageings under air and under 2.0 MPa oxygen pressure (110 °C), and for PA6 (Dong and Gijsman [18]). Fig. 16. calls for the following comments:
‐ plots for PA11 and PA6 under air are extremely close confirming that the oxidative attack occurs mainly in ‐N‐C‐H sites. ‐ the activation energy of rOX under oxygen excess is close to 101 kJ mol‐1. Let us recall that the analytic solution of the mechanistic scheme under oxygen excess leads to [29]: rOX = 2k3²[PH]²/k6 (Eq. 4)
Eq. 4 leads to: EOX = 2E3 – E6 (Eq. 5)
Several data were compiled in our previous work [3] for the Bond Dissociation Energy of C‐H (BDE) in position of amide group, converging toward a value of BDE ~ 355 kJ mol‐1 so that E
3 ~ 53 kJ mol‐1
i.e.: E6 is around 5 kJ mol‐1. This E6 value is lower than ones found in classical polyolefins [30]. It
means that k6 value remains extremely elevated whatever the temperature. A previous investigation
[31] reports high k6 values even at 30°C for different substrates in which termination is due to
secondary peroxyl radicals. According to Howard and Ingold [31], those substrate would terminate by disproproportionation [32] and the ease with which H is transferred plays a very important role in determining the rate constant for termination. Polyamide termination would thus display an interesting similarity with those reactions. This temporary explanation would suggest that polyamide termination generate an imide and an alkoxyamide, rather than a ROOR peroxide by coupling.
5. Conclusions
Previous studies already described the oxidation of polyamides especially in the case of photo‐ oxidation at molecular scale or thermal oxidation at high temperature (molten state). Our aim was firstly to focus on “moderate” temperature for aliphatic polyamide thermal oxidation in order to establish relationships between chemical structure, molecular changes and use properties, and secondly to estimate the orders of magnitude of rate constants.
Thanks to carbonyl formation rate measurements performed at several oxygen pressure and temperatures, the order of magnitude of the main elementary rate constants has been assessed. The final set of rate constants will soon be proposed based on a more complete set of experimental data including the changes of hydroperoxide concentration and the kinetic model will rise from this future analysis.
The carbonyl formation has been correlated to some physical and macromolecular modifications: ‐ Yellowing species detection by UV‐Visible spectroscopy. A unique correlation between the level of
attempted to discuss the possible nature of chromophore species and the correlation enabled us to eliminate some previous hypotheses about the nature of chromophores. It is reasonable to assume that the structure of the chromophoric species carries a carbonyl group.
‐ Chain scission largely predominates over crosslinking reactions (indicating that the termination between radicals P° and POO° would not lead to dialkyl peroxides). It was shown that the yield of chain scission was almost 7.5 times lower than carbonyl one. It confirms that the reaction of alkoxy radicals mainly generates imide groups without chain scission. However, beyond a certain conversion degree, crosslinking appears and a significant increase of the chain scission yield is observed. These phenomena can be attributed to secondary reactions involving the primary oxidation products. For instance double bonds resulting from P° + POO° disproportionations could undergo macroradical additions, leading to crosslinking while instable primary products as for instance α amino alcohols could decompose to give chain scissions contributing to the increase of their yield.
Acknowlegements
Many thanks are addressed to ARKEMA’s experts for their valuable assistance in bringing out this article: Florence Churlaud, Christophe Degoulet and Frédérique Pery.
References
[1] Sharkey WH, Mochel WE. Mechanism of the photooxidation of amides. J Am Chem Soc 1959;81(12):3000‐3005. [2] Von White II G, Smith JN, Clough RL, Ohlhausen JA, Hochrein JM, Bernstein R. The origins of CO2 and NH3 in the thermal‐oxidative degradation of nylon 6.6. Polym Degrad Stab 2012;97(8):1396‐404. [3] Richaud E, Okamba Diogo O, Fayolle B, Verdu J, Guilment J, Fernagut F. Review: Auto‐oxidation of aliphatic polyamides. Polym Degrad Stab 2013;98(9):1929‐1939.
[4] El‐Mazry C, Ben Hassine M, Correc O, Colin X. Thermal oxidation kinetics of additive free polyamide 6‐6. Polym Degrad Stab 2013;98(1):22‐36.
[5] Sagar, BF. Autoxidation of N‐alkyl‐amides. Part II. N‐alkyl‐amide hydroperoxides and di‐N‐alkyl‐ amide peroxides. J Chem Soc B: Phys Org 1967;428‐439.
[6] Lemaire J, Gardette J‐L, Rivaton A, Roger A. Dual photo‐chemistries in aliphatic polyamides, bisphenol A polycarbonate and aromatic polyurethanes—A short review. Polym Degrad Stab 1986;15(1):1‐13.
[7] Richaud E, Farcas F, Bartoloméo P, Fayolle B, Audouin L, Verdu J. Effect of oxygen pressure on the oxidation kinetics of unstabilised polypropylene. Polym Degrad Stab 2006;91(2):398‐405.
[8] Khelidj N, Colin X, Audouin L, Verdu J, Monchy‐Leroy C, Prunier V. Oxidation of polyethylene under irradiation at low temperature and low dose rate. Part II. Low temperature thermal oxidation. Polym Degrad Stab 2006;91(7):1598‐1605. [9] Laun S, Pasch H, Longiéras N, Degoulet C. Molar mass analysis of polyamides‐11 and ‐12 by size exclusion chromatography in HFiP. Polymer 2008;49(21):4502‐4509.
[10] Mourey TH, Bryan TG. Size‐exlusion chromatography in 1,1,1,3,3,3‐hexafluoro‐2‐propanol. J Chromatogr A 2002;964:169‐178.
[11] Jacques B, Werth M, Merdas I, Thominette F, Verdu J. Hydrolytic ageing of polyamide 11. 1. Hydrolysis kinetics in water. Polymer 2002;43(24):6439‐6447.
[12] Oliveira MJ, Botelho G. Degradation of polyamide 11 in rotational moulding. Polym Degrad Stab 2008;93(1):139‐146.
[13] Roger A, Sallet D, Lemaire J. Photochemistry of aliphatic polyamides. 4. Mechanisms of photooxidation of polyamides 6, 11, and 12 at long wavelengths. Macromolecules 1986;19(3):579‐ 584.
[14] Carlsson DJ, Wiles DM. The photodegradation of polypropylene films. III. Photolysis of polypropylene hydroperoxides. Macromolecules 1969;6(2):597‐606.
[15] Domke WD, Steinke H. Oxidative structures in polyolefins: FT–IR method of quantitative determination J Polym Sci Part A: Polm Chem 1986;24(10):2701‐2705.
[16] Lacoste J, Carlsson DJ. Gamma‐, photo‐, and thermally‐initiated oxidation of linear low density polyethylene: a quantitative comparison of oxidation products. J Polym Sci, Part A: Polym Chem 1992;30(3):493‐500.
[17] Cerruti P, Lavorgna M, Carfagna C, Nicolais L. Comparison of photo‐oxidative degradation of polyamide 6,6 films stabilized with HALS and CuCl2+KI mixtures. Polymer 2005;46:4571‐4583.
[18 ] Link WE, Buswell KM. Application of infrared spectroscopy to analysis of primary fatty amide mixtures. J Am Oil Chemist’s Soc 1962;39:39‐44.
[19] Dong W, Gijsman P. Influence of temperature on the thermo‐oxidative degradation of polyamide 6 films. Polym Degrad Stab 2010;95(6):1054‐1062.
[20] Cerruti P, Carfagna C. Thermal‐oxidative degradation of polyamide 6,6 containing metal salts. Polym Degrad Stab 2010;95(12):2405‐2412.
[21] Forrström D, Terselius B. Thermooxidative stability of polyamide 6 films. I. Mechanical and chemical characterisation. Polym Degrad Stab 2000;67:69‐78. [22] Wise J, Gillen KT, Clough RL. Quantitative model for the time development of diffusion limited oxidation. Polymer 1997;38(8):1929‐1944. [23] Hernandez RJ. Effect of water vapor on the transport properties of oxygen through polyamide packaging materials. J Food Eng 1994;22(1‐4):495‐507.
[24] ASTM E313 – 10. Standard Practice for Calculating Yellowness and Whiteness Indices from Instrumentally Measured Color Coordinates.
[25] Saito O. On the effect of high energy radiation to polymers I. Cross‐linking and degradation. J Phys Soc Jap 1958;13(2):198‐206.
[26] Fromageot D, Roger A, Lemaire J. Thermooxidation yellowing of aliphatic polyamides. Angew Makrom Chem 1989;170(1):71‐85.
[27] Li R, Hu X. Study on discoloration mechanism of polyamide 6 during thermo‐oxidative degradation. Polym Degrad Stab 1998;62(3):523‐528.
[28] Khelidj N, Colin X, Audouin L, Verdu J, Monchy‐Leroy C, Prunier V. Oxidation of polyethylene under irradiation at low temperature and low dose rate. Part I. The case of “pure” radiochemical initiation. Polym Degrad Stab 2006;91(7): 1593‐1597.
[29] Colin X, Fayolle B, Audouin L, Verdu J. About a quasi‐universal character of unstabilised polyethylene thermal oxidation kinetics. Polym Degrad Stab 2003;80(1):67‐74.
[30] Richaud E, Farcas F, Fayolle B, Audouin L, Verdu J. Hydroperoxide build‐up in the thermal oxidation of polypropylene – A kinetic study. Polym Degrad Stab 2007;92(1):118‐124.
[31] Howard JA, Ingold KU. Absolute rate constants for hydrocarbon autoxidation. VI. Alkyl
aromatic and olefinic hydrocarbon. Can J Chem 1966;45:793‐802.