Science Arts & Métiers (SAM)
is an open access repository that collects the work of Arts et Métiers Institute of
Technology researchers and makes it freely available over the web where possible.
This is an author-deposited version published in: https://sam.ensam.eu
Handle ID: .http://hdl.handle.net/10985/20265
To cite this version :
A. BOUDIS, H. OUALLI, A. BENZAOUI, O GUERRI, A C BAYEUL-LAINÉ, O COUTIER-DELGOSHA - Effects of Non-Sinusoidal Motion and Effective Angle of Attack on Energy Extraction Performance of a Fully- Activated Flapping Foil - Journal of Applied Fluid Mechanics p.485-498 - 2021
Any correspondence concerning this service should be sent to the repository Administrator : archiveouverte@ensam.eu
Effects of non-sinusoidal motion and effective angle of attack
on energy extraction performance of a fully-activated flapping
foil
A. Boudis
1,3 †, H. Oualli
2, A. Benzaoui
1, O. Guerri
3, A.C. Bayeul-Lain´e
4, and O.
Coutier-Delgosha
4,51 Laboratory of Thermodynamics and Energy Systems, Faculty of Physics, University of Science and Technology Houari Boumediene (USTHB), BP 32 El-Alia, Algiers, Algeria
2 LMF, Ecole Militaire Polytechnique (EMP), B.P 17 Bordj-el-Bahri, 16111, Algiers, Algeria
3 Centre de D´eveloppement des Energies Renouvelables, CDER, B.P 62 Route de l’Observatoire, 16340 Bouzar´eah, Algiers, Algeria
4 Arts et M´etiers ParisTech, LMFL, 8 boulevard Louis XIV, 59046 Lille, France
5 Virginia Tech, Kevin T. Crofton, Dept. of Aerospace & Ocean Eng., Blacksburg, 460 Old Turner Street, VA 24061, USA
†Corresponding Author Email: aboudis@usthb.dz, a.boudis@cder.dz
(Received ——; accepted ——)
ABSTRACT
Flapping foil energy harvesting systems are considered as highly competitive devices for conventional turbines. Several research projects have already been carried out to improve performances of such new devices. This paper is devoted to study effects of non-sinusoidal heaving trajectory, non-sinusoidal pitching trajectory, and the effective angle of attack on the energy extraction performances of a flapping foil operating at low Reynolds number (Re=1100). An elliptic function with an adjustable parameter S (flattening parameter) is used to simulate various sinusoidal and non-sinusoidal flapping trajectories. The flow around the flapping foil is simulated by solving Navier–Stokes equations using the commercial software Star CCM+ based on the finite-volume method. Overset mesh technique is used to model the flapping motion. The study is applied to the NACA0015 foil with the following kinetic parameters: a dimensionless heaving amplitude h0= 1c, a shift angle between heaving and pitching motions φ = 90◦, a reduced frequency f∗= 0.14, and an effective angle of attack αmax varying between 15◦and 50◦, corresponding to a pitching amplitude in the range θ0= 55.51◦to 90.51◦. The results show that, the non-sinusoidal trajectory affects considerably the energy extraction performances. For the reference case (sinusoidal heaving and pitching motions, Sh= Sθ= 1), best performances are obtained for the effective angle of attack, αmax= 40◦. At small effective angle of attack αmax< 30◦, the non-sinusoidal pitching motion combined with a sinusoidal heaving motion, greatly improve energy extraction performances. For αmax= 15◦, Sh= 1 and Sθ= 2, energy extraction efficiency is improved by 52.22% and the power coefficient by 70.40% comparatively to sinusoidal pitching motion. At high effective angles of attack ( αmax> 40◦), non-sinusoidal pitching motion has a negative effect. Performance improvement is quite limited with the combined motions non-sinusoidal heaving/sinusoidal pitching.
Keywords: Flapping foil, Energy extraction, Renewable energy, Non-sinusoidal trajectory, CFD
NOMENCLATURE c foil chord length
CP pressure coefficient COP power coefficient
COPh power coefficient of heaving motion COPθ power coefficient of pitching motion CL lift coefficient
CD drag coefficient CM moment coefficient
d maximum vertical displacement of the trailing edge
f flapping frequency
f∗ reduced frequency ( f∗= f c/U∞) ω angular frequency(ω = 2π f ) φ phase shift between heaving and
pitching motions
h0 nondimensional heaving amplitude nondimensional pitching amplitude
h(t) heaving motion θ(t) pitching motion
Re Reynolds number (Re = ρcU∞/µ) T flapping period (T = 1/ f ) U∞ free stream velocity η energy extraction efficiency P(t) instantaneous total power extracted Pa total power available in flow
Ph(t) instantaneous power extracted by the heaving motion Pθ(t) instantaneous power extracted by the pitching motion Fy(t) instantaneous vertical force
Mz(t) instantaneous moment
XP chordwise position of pitching axis αe f f effective angle of attack
ρ fluid density µ dynamic viscosity
¯ mean value over one motion cycle 1
1. INTODUCTION
Energy extraction from moving fluids is subject to many researches in several laboratories around the world. It is mainly sought to improve energy extraction performances, to reduce its cost and to reduce greenhouse gas (GHG) emissions. Traditionally, kinetic energy of moving fluids is recovered using conventional turbines with rotating blades (horizontal or vertical axis turbines). Recently, many researchers have shown capacity of flapping foil systems to harvest this type of energy (McKinney and DeLaurier 1981;Jones and Platzer 1997; Kinsey and Dumas 2008; Simpson and Triantafyllou 2008; Ashraf et al. 2011; Lu et al. 2015). Energy extraction performances of a flapping foil in combined heaving and pitching motions depend on several parameters, including the foil shape (Wang et al. 2017; Boudis et al. 2018; Liu et al. 2013), fluid velocity (Kinsey and Dumas 2008;Kinsey and Dumas 2014;Javed et al. 2018), and kinematic parameters such as flapping frequency (Zhu 2011; Sun et al. 2018), heaving and pitching amplitudes (Dumas and Kinsey 2006;
Davids 1999; Kinsey and Dumas 2008; Mumtaz Qadri et al. 2019), effective angle of attack (Hover et al. 2004; Simpson and Triantafyllou 2008), phase shift between heaving and pitching motions (Dumas and Kinsey 2006; Kinsey and Dumas 2008; Xiao and Zhu 2014) and the location of the pitching axis (Davids 1999;Pourmahdavi et al. 2019). The results showed that the best efficiency was always achieved when the reduced frequency ( f∗= f c/U∞)) was in the range of 0.10 − 0.15, the heaving amplitude was h0= 1c, the phase shift between pitching and heaving motions φ was equal or close to 90◦, maximum effective angle of attack αmax was in the range 30◦− 40◦ and the pitching axis Xpwas between 0.333c to 0.5c .
Currently, improve energy extraction performances by adopting appropriate technological solutions is particularly targeted by the research community, (Xiao and Zhu 2014; Wu et al. 2020). Ashraf et al. (2011)carried out a numerical investigation of the flow over a flapping NACA0014 foil. It is concluded that using a non-sinusoidal heaving and pitching trajectory enhances energy extraction coefficient by 17% and energy extraction efficiency by 15%. One year later, these results are confirmed numerically by (Xiao et al. 2012) who reported that the profile of the pitching motion has a substantial effect on the energy extraction performances of a flapping NACA0012 foil. It is claimed that trapezoidal pitching motion improve the energy extraction coefficient by 63% and energy extraction efficiency by 50%. Thereafter,
Lu et al. (2014) indicated that an appropriate combination of the non-sinusoidal heaving and
pitching motions improves energy extraction performances. They found that comparatively to sinusoidal trajectory, a square-like pitching trajectory combined with a toothed-like heaving trajectory improves energy extraction coefficient by 87.5%.Teng et al. (2016)investigated numerically the effect of a non-sinusoidal pitching trajectory on performances of a semi-active flapping foil, in which the profile of the pitching motion is prescribed and the heaving motion is activated by the vertical hydrodynamic force. The pitching trajectory is varied from a sinusoid to a square wave. The obtained results show that at the optimal reduced frequency and pitching amplitude, non-sinusoidal pitching motions contribute negatively to the energy extraction efficiency. They suggested that a non-sinusoidal profile, at least a simple trapezoidal-like one is ineffective in their semi-active system. Later, Wang et al. (2019) numerically investigated the effects of vertical and elliptical airfoil trajectories on the energy extraction performance of a flapping foil device. They proposed a new type of flapping trajectory called reversed-D that represents a composite of an elliptical trajectory in the first half of the motion cycle and a standard vertical trajectory in the second half of the motion cycle. The results indicated that the power extraction efficiency obtained with the reversed-D trajectory is greater than that obtained with the standard vertical reciprocating trajectory, and the increase is due mainly to an increase in the heave force.
On the other hand, almost all studies that considered the effect of non-sinusoidal flapping trajectory on the energy extraction performances has focused on the situations with a low effective angle of attack (αmax < 20◦), where non-sinusoidal trajectories effectively improved the sought performances (Xiao et al. 2012; Lu et al. 2014; Deng et al. 2014). However, for large effective angles of attack (30◦− 50◦) it is still not clear is non-sinusoidal flapping trajectories lead to performances enhancement as obtained with sinusoidal trajectory case (Kinsey and Dumas 2008; Ashraf et al. 2011; Platzer et al. 2009). Platzer et al. (2009) concluded that improving energy extraction performances of a flapping foil using non-sinusoidal trajectories for different working parameters still need further investigation.Teng et al. (2016)also indicated that enhancement of energy extraction performances of a semi-active flapping foil using non-sinusoidal pitch motion was weak as (θ0) approached its optimal value.
The aim of this work is to get a better understanding on the effect of non-sinusoidal trajectory on the energy extraction performance. Therefore,
numerical simulations of the fluid flow around a single fully activated flapping foil operating at low and high effective angles of attack are carried out. Two cases study are considered: (i) non-sinusoidal pitching combined with sinusoidal heaving motion and (ii) non-sinusoidal heaving motion combined with sinusoidal pitching motion.
2. PROBLEM FORMULATION
Equations describing the flapping motion as well as the relationships applied to determine the foil performance are given below :
2.1 Kinematics equations
The flapping motion is composed of a vertical heaving motion h(t) and a pitching motion θ(t) around its own pitching center, as illustrated on Fig.
1.
Fig. 1.Schematic illustration of combined heaving and pitching motions (adapted from (Kinsey and Dumas 2014)).
Sinusoidal and non-sinusoidal flapping trajectories are modeled using an elliptical function defined by the following equation:
F(t) =q Scos(ω.t) S2cos(ω.t)2+ sin(ω.t)2
(1)
Where S is a flattening parameter, ω = 2π f is the angular frequency ant t is time.
As shown in Fig. 2, when S = 1, the flapping trajectory is sinusoidal. If S is different from 1, the trajectory is non-sinusoidal.
The heaving and pitching motions are defined by equations (2) and (3): h0(t) = h0c Shcos(ω.t) q Sh2cos(ω.t)2+ sin(ω.t)2 (2) θ(t) = θ0 Sθcos(ω.t + φ) q Sθ2cos(ω.t + φ) 2 + sin(ω.t + φ)2 (3)
Fig. 2. Heaving trajectory according to different values of the flattening parameter S (adapted from (Boudis et al. 2019)).
Where h(t) and θ(t) are the heaving and the pitching motions, respectively. h0 is the heaving amplitude, θ0 is the pitching amplitude, c is the chord length and φ is the phase shift between heaving and pitching. Sh and Sθ are the flattening parameters of heaving and pitching trajectory respectively. The pitch axis is located on the foil chord, at 33% of chord from leading edge.
The effective angle of attack is the sum of the pitching angle and the induced angle due to the heaving motion. It is calculated as follows:
αe f f(t) = arctan( −1 U∞
dh(t)
dt ) − θ(t) (4)
As in Kinsey and Dumas (2008), the maximum effective angle of attack reached in one cycle is approximated by the modulus of its quarter period. It is expressed as:
αmax≈| αT/4|≈| arctan(ωh0cSh/U∞) − θ(t) | (5)
The reduced frequency f∗ and the Reynolds number Re are defined as:
f∗= f c U∞
and Re=ρcU∞
µ (6)
Where U∞ is the freestream velocity,ρ and µ are fluid density and dynamic viscosity respectively.
2.2 Power extraction and efficiency
The power P(t) extracted from the fluid by the flapping foil is the sum of the heaving contribution Ph(t) and the pitching contribution Pθ(t).
P(t) = Ph(t) + Pθ(t) = Fy(t) dh(t)
dt + Mz(t) dθ(t)
where Fy(t), is the vertical force and Mz(t), is the moment are defined as, respetively:
Fy(t) = CL(t) 1 2ρAU 2 ∞ (8) Mz(t) = Cz(t) 1 2ρAU 2 ∞ (9)
CLand CM are the lift and the moment coefficients respectively, A is the reference area of the foil (in 2D domain, A = c).
The mean power extracted ( ¯P) is calculated by integrating the instantaneous power (P(t)) over one flapping cycle (T ): ¯ P= 1 T( Z t+T t Fy(t) dh(t) dt + Z t+T t Mz(t) dθ(t) dt ) (10)
The power coefficient COPis defined as:
COP= COP h+COP θ=
Ph(t) + Pθ(t) 0.5ρcU3
∞
(11)
The mean power coefficient ( ¯COP) is calculated by integrating the instantaneous (COP(t)) over one flapping cycle: ¯ COP= 1 T Z t+T t COP(t)dt (12)
If ¯COP> 0, the flapping foil extracts kinetic energy from the fluid flow. Otherwise, if ¯COP < 0 the flapping foil is power consuming.
The energy extraction efficiency is defined as the ratio of the mean extracted power and the power available in the swept fluid area:
η = ¯ P Pa = ¯COP c d (13)
where (Pa= 1/2ρU∞3d) is the maximum available power in the flow and d is the maximum vertical displacement of the trailing edge.
3. NUMERICAL METHODS
The numerical methodology is similar to that used in (Boudis et al. 2019). The CFD simulations are conducted using the finite volume software Star CCM+. The unsteady, two-dimensional and incompressible Navier Stokes equations governing the flow around the flapping foil are resolved using a segregated solver. The pressure-velocity coupling is obtained using the semi-implicit method for pressure-linked equations. Second-order schemes
are used for the discretization of the pressure and the momentum equations, and the temporal discretization is based on a second-order implicit scheme. More information about the solver can be found in Star CCM+ user guide (StarCCM+
). The simulations are carried out for a Reynolds number Re = 1100, therefore a laminar flow was assumed in all considered cases (Kinsey and Dumas 2008; Xiao et al. 2012). The solution is considered converged when the variation in the power extraction efficiency between successive periods does not exceed 1%. Then, the calculations were pursued over ten flapping cycles to ensure that periodic solution was achieved.
3.1 Computational domain and boundary conditions
The computational domain and the boundary conditions used in the present study are shown in Fig. 3. The computational domain is a square of 70c side. At the inlet, top, and bottom boundaries, the pressure is set to zero gradient and the fluid velocity in x direction is specified based on the defined Reynolds number. The free stream pressure and a zero velocity gradient are set at the outlet boundary. On the foil surface, the non-slip condition is adopted. The relative position of the foil in the fluid domain is ensured as in (Kinsey and Dumas 2008). The overset mesh technique is used to simulate the flapping motion. For this purpose, the domain is subdivided into two regions, an overset and a background zones. The background is a fixed zone and the overset is the moving zone that ensures the combined heaving and pitching motions. The connection between the two zones is provided using an overset interface. In both zones a trimmed mesh is used and for the mesh refinement around the foil and in the wake, the multi-blocks grid technique is adopted.
Fig. 3. Computational domain and boundary conditions.
Table 1.Grid and time step independence study
Mesh Time-step C¯OP Error η Error
Grid
Coarse grid (67997 cells)
T/1000
0.8771 1.12 % 34.22 1.12 % Medium grid (151369 cells) 0.8595 0.89 % 33.55 0.85 % Fine grid (347594 cells) 0.8673 – 33.84 –
Time-step Medium grid
T/200 0.9134 6.66 % 35.64 6.67 % T/500 0.8740 2.06 % 34.10 2.06 % T/1000 0.8595 0.37 % 33.55 0.41 % T/2000 0.8563 – 33.41 –
3.2 Sensitivity study and validation
The grid and the time step sensitivity study is conducted to check that the mesh strategy and the time step have no influence on the numerical results occuracy. For grid sensitivity study, three meshes of different densities are considered: a coarse mesh with 67997 cells, a medium mesh with 151369 cells, and a fine mesh with 347594 cells. To refine the coarse mesh, the numbers of cells near the foil surface and in the wake are increased. The simulations are performed using the following parameters: Re = 1100, h0 = 1, θ0 = 76.33◦, φ = 90◦ and f∗ = 0.14, and the time step ∆t = T /1000. The obtained results are summarized in Table 1. It is found that the values of Cop and η obtained with the medium and fine meshes are slightly different. Thus, the medium mesh is considered to be satisfactory, and is used in the developped simulations. The time step independence is checked using four different values; T /200,T /500,T /100,and T /2000. From Table 1, it can be clearly seen that the difference between the results obtained with ∆t = T /1000 and ∆t = T /2000 is negligible.
Therefore, the medium mesh and the time step (∆t = T /1000) appeared to result in a good compromise for precision and simulation run time. Therefore, they are adopted for all the simulations implemented in this study.
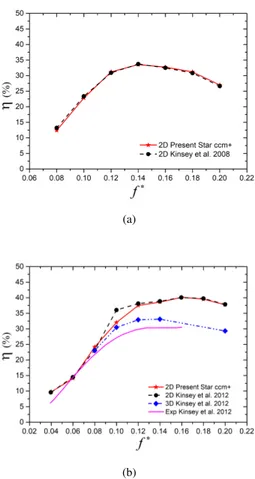
To validate our simulation results, quantitative and qualitative comparisons are perfomed with numerical and experimental results of Kinsey and Dumas (Kinsey and Dumas 2008; Kinsey and Dumas 2012). Various simulations are performed for two Reynolds numbers, Re = 1100 and Re = 500000. The variation of the power extraction efficiency η versus the reduced frequency f∗ obtained by the present computations, using the following simulation parameters: Re = 1100,h0= 1, θ0= 76.33◦, φ = 90◦ and f∗= 0.08 − 0.20 are depicted in Fig. 4(a). This figure shows that the results obtained are in good agreement with those of (Kinsey and Dumas 2008)
Fig.4(b) compares the 2D efficiency of the present
computations with 2D, 3D and experimental results obtained by (Kinsey and Dumas 2012). The parameters used in this case are : Re = 500000, h0 = 1,θ0 = 75◦, φ = 90◦ and f∗ = 0.04 − 0.20 . The turbulence is considered using the Spalart-Allmaras model.
The choice of this model is inspired by the results of Kinsey and Dumas (2012) whom compared several turbulence models (SA, K − ω, SST and SST low− Re) and whom concluded that the energy extraction performances predicted with all turbulence models closely matches. Their simulations were then carried out using the Spalart - Allmaras model because it is the most efficient in terms of computational costs. Our results are in good agreement with the 2D results of (Kinsey and Dumas 2012), except for f∗= 0.1 where a difference is noticed. This has also been reported by (Picard-Deland et al. 2019) and (Zhu et al. 2019). Furthermore, the important differences between 2D, 3D and experimental results observed at a high reduced frequency ( f∗> 0.12) can be explained by the losses at the wing tips, which is not taken into account in the 2D calculus. Note that the foil used in the 3D and experimental studies has an aspect ratio (AR = 7) and it is equipped with endplates.
Qualitatively, the vortex contours of the present study and those of Kinsey and Dumas (Kinsey and Dumas 2008) at the same flapping time are also quite similar as it can be seen in Fig.5. Therefore, from this comparison it comes out that the present solver efficiency is shown and the obtained results are physically reliable results. Thus, the numerical method can be used to study the effect of the motion trajectory on the performances of a flapping foil.
4. RESULTS AND DISCUSSIONS
Effect of flapping motions and the effective angle of attack on the energy extraction performance of a flapping foil is evaluated. The considered sinusoidal and non-sinusoidal flapping trajectories are described using relations (2) and (3) with Sh and Sθ values varying in the range from 1 to 2, and a step size of 0.25. The kinematic parameters
(a)
(b)
Fig. 4.Energy extraction efficiency versus reduced frequency for validation cases, (a) Re = 1100, h0= 1, θ0= 76.33◦, φ = 90◦and f∗= 0.08 − 0.20 and (b) Re = 500000, h0= 1, θ0= 75◦, φ = 90◦and
f∗= 0.04 − 0.20.
Fig. 5. Comparison of the vorticity contours of the present study (left) with the results of (Kinsey and Dumas 2008) (right) at Xp= 0.333c, f∗= 0.14, h0= 1, θ0= 76.33, φ = 90◦, and Re = 1100.
of the flapping motion are fixed to: f∗= 0.14, h0= 1, φ = 90◦, and Re = 1100. The effective angle of attack αmaxis varied between 15◦and 50◦, resulting in a pitching amplitude θ0in the range of 55.51◦ to 90.51◦. Two cases of flapping motions are considered:
• Case 1: Non-sinusoidal pitching motion combined with sinusoidal heaving motion.
• Case 2: Non-sinusoidal heaving motion combined with sinusoidal pitching motion.
4.1 Case 1: Non-sinusoidal pitching motion combined with sinusoidal heaving motion Fig. 6 shows the variation of the mean power coefficient ¯COPand the energy extraction efficiency η as a function of αmax for different values of Sθ. It is found that the power coefficient and the energy extraction efficiency both increase first with αmax and then decrease with further increasing of αmax. For each Sθ value there is an optimal range of αmax that provides the best energy extraction performances. At fixed αmax, it is found that the non-sinusoidal pitching trajectory considerably affects the energy extraction performances of the flapping airfoil. At small effective angle of attack (αmax≤ 30◦) increasing the value of Sθcan enhance both ¯COP and η. However at large effective angle of attack (αmax≥ 40◦), increasing the value of Sθ significantly reduces the energy extraction performances of the flapping foil.
The ‘Critical’ Sθis defined hereafter as the value of Sθcorresponding to maximum ¯COP. Comparison of
¯
COPand η for Sθ= 1 and Sθ Criticalfor the effective angles of attack considered in this study is given in Table2. The best improvement in ¯COPand η is achieved for αmax= 15◦and Sθ= 2. In this case
¯
COPand η are improved by 70.40 % and 52.22% respectively, compared to the sinusoidal pitching trajectory (Sθ= 1).
Fig. 7 shows the instantaneous variation of COPh, COPθ, COP over one flapping cycle for both cases Sθ = 1 and Sθ = 2 at αmax = 15◦. It is clear that the total power coefficient (COP) of the flapping airfoil is dominated by COPh and that the COPθ has a negative contribution. It can be concluded thus that, the heaving motion plays a leading role in the flapping foil energy extraction. Furthermore, the non-sinusoidal trajectory has a specifically positive effect on the energy extracted with the heaving motion. Consequently, COPh is considerably improved during most part of the flapping cycle. Conversely, energy extracted by the pitching motion is negatively influenced. Also, COPθ decreases significantly during rapid reversal
Table 2.Changes in performance at Sθ Critical for various αmax.
αmax Sθ Critical COP Improvement (%) η Improvement (%)
15◦ 1 0.3744 - 15.91 -2 0.6380 70.40 24.23 52.22 20◦ 1 0.5318 - 22.13 -2 0.7719 45.15 28.66 29.51 30◦ 1 0.7745 - 30.91 -1.5 0.8947 15.52 33.21 7.44 36◦ 1 0.8595 - 33.54 -1.25 0.8973 4.40 33.59 0.15 40◦ 1 0.8884 - 34.15 -1.25 0.8984 1.13 33.14 -3.05 50◦ 1 0.7895 - 29.35 -1.25 0.8142 3.12 29.09 -0.66 (a) (b)
Fig. 6. Variation of η and ¯COP versus αmax for different values of Sθat Sh= 1, f∗= 0.14, h0= 1 and Re = 1100.
of the pitching stroke leading to the decreasing of the total energy extracted by the flapping foil. This is because the latter is the sum of the energy extracted by heaving and pitching motions. In order to further understand how the non-sinusoidal pitching trajectory affects the energy extraction performances of the flapping
foil, the variations of lift coefficient CL , heaving velocity dh(t)/dt, pitching moment coefficient CM, and pitching velocity dθ(t)/dt over one flapping cycle are depicted in Fig.8for both cases, sinusoidal (Sθ = 1) and non-sinusoidal (Sθ= 2) pitching trajectory at αmax= 15◦.
From Fig. 8(a), it is worth noting that the non-sinusoidal pitching trajectory improves both lift coefficient and synchronization between lift and heaving velocity, resulting in improvement of energy extraction by heaving motion. The important increase in the lift coefficient can be explained by the amplitude and time variation of the effective angle of attack under effect of the non-sinusoidal pitch trajectory. The temporal variations of the effective angle of attack for both cases Sθ= 1 and Sθ = 2 are depicted in Fig. 9. It can be seen that the maximum effective angle of attack (αmax) is higher for Sθ= 2 compared to that of the case Sθ= 1. The difference between αmax values is 22.86%. For Sθ= 2, the curve α(t) presents two maxima per half flapping cycle: the effective angle of attack rises rapidly to reach the first maximum at t/T = 0.1, then it decreases to become equal to the effective angle of the case Sθ= 1 at t/T = 0.25, thereafter, it increases to reach the second maximum at t/T = 0.4. This effective angle of attack variation influences the flow structure and the pressure distribution around the flapping airfoil. This latter is the underlying reason behind aerodynamic forces enhancement such as lift and moment, directly related to the energy extraction performances.
The instantaneous pressure contours and the pressure coefficient distributions around the flapping airfoil for both cases Sθ= 1 and Sθ= 2 at times t/T = 0.1, 0.25 and 0.4, corresponding to the maxima of αmax over one half cycle are depicted in Fig. 10. This figure shows that, for Sθ= 2, the distribution range of the pressure difference
(a) power extraction coefficient from heaving motion
(b) power extraction coefficient from pitching motion
(c) total power extraction coefficient
Fig. 7. Instantaneous variations of (a) COP h , (b) COP θ, and (c) COPover one flapping cycle for both cases Sθ= 1 and Sθ= 2 at αmax= 15◦.
between both foil surfaces is higher for Sθ= 2, compared to that of the case Sθ = 1, resulting in more important lifting force for Sθ = 2. The fluctuations of the lift coefficient observed in the periods t = [0T − 0.2T ] and t = [0.5T − 0.7T ] for the non-sinusoidal trajectory case (see Fig. 8(a) ) is mainly attributed to reattachment of the leading edge vortex at the foil surface close to the trailing edge. The formation of these vortices is mainly caused by the higher pitching velocity of the airfoil during the variation of the pitching direction in the case Sθ= 2 compared to Sθ= 1. On the other side, in the sinusoidal trajectory case, the reattached
(a) Lift coefficient
(b) Moment coeficient
Fig. 8.Comparison of lift and moment coefficients and their velocities over one flapping cycle for both cases Sθ= 1 and Sθ= 2 at αmax= 15◦.
Fig. 9.Temporal variation of the effective angle of attach for both cases Sθ= 1 and Sθ= 2.
vortex is less intense, which slightly influences the distribution of lift coefficient. After these periods, the re-attached vortex leaves the trailing edge and the lift is recovered (see Fig.11).
From Fig. 8(b), it comes out that the pitching moment and pitching velocity have opposite signs during a large period of the cycle. Therefore, COPθ changes between positive and negative regions. Remarkable increasing in the pitching moment is
(a) t/T = 0.1
(b) t/T = 0.25
(c) t/T = 0.4
Fig. 10. Instantaneous pressure contours and pressure coefficients around the airfoil for Sθ= 1 and Sθ= 2 at selected times over a half flapping cycle.
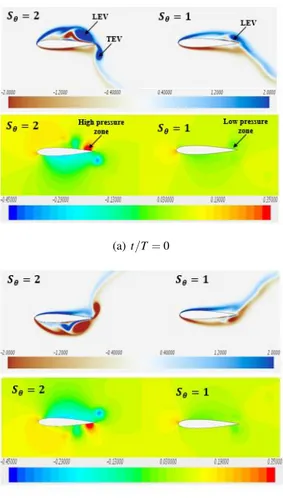
observed at times t/T = 0, 0.5 and t/T = 1 for the case Sθ= 2 compared to the case Sθ= 1. At these times, the airfoil is in its maximum heave position and rotates to start the next flapping cycle. The high angular velocity in the case Sθ = 2 causes generation of a trailing edge vortex (TEV). Releasing of this vortex creates a high pressure zone at the trailing edge level (see Fig. 12). Pressure difference between both sides of the airfoil at these times generates a high moment in the opposite direction of the airfoil rotation about the pitch axis. The generated moment and the angular velocity have opposite signs. Hence, the work done during this time, due to pitching motion is negative.
Fig. 11. Instantaneous vorticity contours around the airfoil for Sθ= 1 and Sθ= 2 at different times.
4.2 Case 2: Non-sinusoidal heaving motion combined with sinusoidal pitching motion Fig. 13 shows the variation of η and ¯COP as a function of αmax , for different values of Sh. It can be seen that, whatever the Sh value, both COP and η increase with the effective angle of attack until maximum values at αmax = 40◦, and then decrease due to the dynamic stall. These results are in agreement with the results of (Kinsey and Dumas 2008), which showed that the best energy extraction performance is obtained with the effective angle of attack in the range αmax= 30◦to 40◦. For all αmaxvalues, the best energy extraction efficiency is always achieved with the sinusoidal heaving trajectory (Sh= 1). However with the non-sinusoidal heaving trajectory (Sh 6= 1) the energy extraction coefficient is slightly improved for effective angles of attack between 30◦and 40◦ compared to the sinusoidal trajectory.
The mean values of COPh, COPθ, COP and η are given in Table 3 for αmax = 40◦. From these results, it can be seen that the contribution of the pitching motion (COPθ) is small compared to that of the heaving motion (COPh). Therefore, as in the previous section, the total energy extracted (COP) by the flapping foil is dominated by the energy extracted from heaving motion. These results show also that the total energy extraction coefficient increases with Sh up to an optimal value achieved with Sh= 1.75 and then decreases.
(a) t/T = 0
(b) t/T = 0.5
Fig. 12. Instantaneous vortex and pressure contours around the airfoil for Sθ= 1 and Sθ= 2 at times t/T = 0 (a) and t/T = 0.5 (b).
This is because for Sh values larger than 1.75, the energy extracted by the pitching motion is strongly reduced (see Table 3). In the case of Sh= 1.75, COP is enhanced by 9.42% compared to the sinusoidal heaving trajectory (Sh= 1) while the energy extraction efficiency is decreased by -0.32%. This is due to the size of the swept area (determined by the vertical displacement d of the flapping airfoil), which is larger in the case of non-sinusoidal heaving trajectory, requiring thus more energy. The use of Sh= 1.75 increases d by 9.8% compared to Sh= 1, leading to efficiency dropping in the same proportion (see equation13). The temporal variations of COPh, COPθ, COP over one flapping cycle for Sh= 1 and Sh= 1.75 at αmax = 40◦ are shown in Fig. 14 to further understand how non-sinusoidal heaving trajectory affects power extraction coefficient. The related CL, CM, dh/dt and dθ/dt are also represented in Fig.
15. It is found that the use of Sh= 1.75 improves both COPh and COPθ, resulting in an improvement in the total COP. The peaks of COPhis remarkably
(a)
(b)
Fig. 13. Variation of η and ¯COP with αmax for different values of Shat Sθ= 1, f
∗
= 0.14, h0= 1 and Re = 1100.
Table 3. Mean values of ¯COPh, ¯COPθ, ¯COPand η at αmax= 40◦for different Shvalues.
Sh Cop h Cop theta Cop eta 1 0.8130 0.0753 0.8884 34.15 1.25 0.8325 0.0876 0.9201 33.93 1.5 0.8496 0.0975 0.9472 33.90 1.75 0.8702 0.1019 0.9721 34.03 2 0.9045 0.0413 0.9459 32.54
increased in the time ranges t/T = 0.2 − 0.35 and t/T = 0.7 − 0.85. Where, the foil reaches the maximum heaving velocity. When the heaving velocity achieved with Sh= 1.75 is greater than with the case Sh= 1, it results in a better COPh, since the quantity of energy extracted by the heaving motion is proportional to the heaving velocity (COPh = CL/U∞∗ dh/dt). From Fig. 15(a) it is seen that Sh= 1.75 improves both lift coefficient and its synchronization with the heaving velocity, improving thus COPh coefficient. Based on the results of this section, it can be concluded that the enhancement of energy extraction performances of a flapping foil by using non-sinusoidal heaving
trajectory is very limited. This conclusion is in good agreement with those of (Lu et al. 2014).
(a) power extraction coefficient from heaving motion
(b) power extraction coefficient from pitching motion
(c) total power extraction coefficient
Fig. 14.Temporal variations of (a) COP h, (b) COP θ, and (c) COPover one flapping cycle for both cases Sh= 1 and Sh= 1.75 at αmax= 40◦.
5. CONCLUSION
In this work, effects of non-sinusoidal heaving trajectory, non-sinusoidal pitching trajectory and effective angle of attack on the energy extraction performances of a fully activated NACA0015 flapping airfoil are numerically studied at low Reynolds number (Re = 1100). The Star CCM+ code is used to solve the Reynolds Averaged Navier-Stokes equations that govern the flow field
(a) Lift coefficient
(b) Moment coeficient
Fig. 15. Temporal variation of the lift (a) and momentum coefficients (b) for Sh= 1 and Sh= 1.75 at αmax= 40◦.
around the flapping airfoil. The prescribed heaving and pitching motions are applied using the overset mesh technique. Four non-sinusoidal motions are considered and the obtained results are compared to those of the sinusoidal case. The main conclusions of this study are summarized as follows:
• The nature (sinusoidal or non-sinusoidal) of the heaving or pitching trajectory is determinant for the energy extraction performance of a flapping foil device.
• For the reference case (sinusoidal heaving and pitching trajectory) the best energy extraction performances are achieved with the maximum effective angle of attack (αmax= 40◦). • At low effective angles of attack, the use
of non-sinusoidal pitching trajectory can significantly improve the energy extraction performances. For αmax = 15◦, Sh = 1 and Sθ= 2, the energy extraction efficiency is improved by 52.22% and the power coefficient is improved by 70.40% compared to the sinusoidal pitching motion. While at high or moderate effective angles of attack,
the non-sinusoidal pitching trajectory cannot improve the energy extraction performance. • Improvement of energy extraction
performance using a non-sinusoidal heaving trajectory is non significant compared to the sinusoidal heaving trajectory
• Improvement in energy extraction performances is considerably greater using non-sinusoidal pitching motion than that for the non-sinusoidal heaving motion.
• Energy extracted with pitching motion is negligible compared to that extracted with heaving motion.
Finally, the obtained results suggest that improvement of the energy extraction performances using a non-sinusoidal pitching and/or heaving motions at optimal working parameters is very limited. However, it is noted that non-sinusoidal trajectory used in this study represents only one type of non-sinusoidal trajectory forms. In nature, birds and insects follows very complex flapping trajectories. Could other forms of non-sinusoidal trajectories improve the energy extraction performances of flapping airfoils? The answer to this question remains open.
FUTURE WORK
In this paper, we have considered the effects of non-sinusoidal heaving trajectory, non-sinusoidal pitching trajectory, and the effective angle of attack on the energy extraction performances of a flapping foil operating at low Reynolds number (Re=1100). Future work will focus on the effect of the non-sinusoidal trajectory proposed in this paper on the energy extraction performance of a flapping foil at moderate and high Reynolds numbers. Optimization techniques (Response surface methodology, Artificial neural networks) are also considered in the future work to determine the best combination of motion parameters (h0, θ0, φ, f , Sh, Sθ, Re) that maximizes energy extraction performance.
ACKNOWLEDGMENTS
This study was supported by “Programme National Exceptionnel 2018-2019”; scholarship fully funded by the Algerian Ministry of Higher Education and Scientific Research. On the other hand, the authors thank the ENSAM Lille (France) for providing computer resources and CFD code to achieve this study.
REFERENCES
Ashraf, M. A., J. Young, J. Lai, and M. Platzer (2011). Numerical analysis of
an oscillating-wing wind and hydropower generator. AIAA J 49(7), 1374 – 1386. Boudis, A., A. C. Bayeul-Lain´e,
A. Benzaoui, H. Oualli, O. Guerri, and O. Coutier-Delgosha (2019, jan). Numerical Investigation of the Effects of Nonsinusoidal Motion Trajectory on the Propulsion Mechanisms of a Flapping Airfoil. Journal of Fluids Engineering 141(4), 041106. Boudis, A., A. Benzaoui, H. Oualli, O. Guerri,
A. C. Bayeul-Lain´e, and O. C. Delgosha (2018). Energy extraction performance improvement of a flapping foil by the use of combined foil. Journal of Applied Fluid Mechanics 11(6), 1651–1663.
Davids, S. T. (1999). A computational and experimental investigation of a flutter generator. Ph. D. thesis, Naval Postgraduate School, Monterey, California.
Deng, J., C. P. Caulfield, and X. Shao (2014, apr). Effect of aspect ratio on the energy extraction efficiency of three-dimensional flapping foils. Physics of Fluids 26(4), 043102.
Dumas, G. and T. Kinsey (2006, apr). Eulerian Simulations Of Oscillating Airfoils In Power Extraction Regime. WIT Transactions on Engineering Sciences 52.
Hover, F., Ø. Haugsdal, and M. Triantafyllou (2004, jan). Effect of angle of attack profiles in flapping foil propulsion. Journal of Fluids and Structures 19(1), 37–47.
Javed, A., K. Djidjeli, A. Naveed, and J. T. Xing (2018). Low Reynolds number effect on energy extraction performance of semi-passive flapping foil. Journal of Applied Fluid Mechanics 11(6), 1613–1627. Jones, K. and M. Platzer (1997, December). Numerical computation of flapping-wing propulsion and power extraction. In 35th Aerospace Sciences Meeting and Exhibit, Reno, Nevada, Jan.
Kinsey, T. and G. Dumas (2008). Parametric study of an oscillating airfoil in a power-extraction regime. AIAA J 46(6), 1318 – 1330.
Kinsey, T. and G. Dumas (2012). Optimal tandem configuration for oscillating-foils hydrokinetic turbine. J. Fluids Eng 134(3), 31103 – 31103.
Kinsey, T. and G. Dumas (2014). Optimal operating parameters for an oscillating foil turbine at reynolds number 500 000. AIAA Journal 52(9), 1885 – 1895.
Liu, W., Q. Xiao, and F. Cheng (2013). A bio-inspired study on tidal energy extraction with flexible flapping wings. Bioinspir. Biomim 8(3), 036011.
Lu, K., Y. Xie, and D. Zhang (2014). Nonsinusoidal motion effects on energy extraction performance of a flapping foil. Renew. Energy 64, 283 – 293.
Lu, K., Y. Xie, D. Zhang, and G. Xie (2015). Systematic investigation of the flow evolution and energy extraction performance of a flapping-airfoil power generator. Energy 89, 138 – 147.
McKinney, W. and J. DeLaurier (1981). Wingmill: An oscillating-wing windmill. J. Energy 5(2), 109 – 115.
Mumtaz Qadri, M. N., A. Shahzad, F. Zhao, and H. Tang (2019). An experimental investigation of a passively flapping foil in energy harvesting mode. Journal of Applied Fluid Mechanics 12(5), 1547–1561. Picard-Deland, M., M. Olivier, G. Dumas,
and T. Kinsey (2019, dec). Oscillating-Foil Turbine Operating at Large Heaving Amplitudes. AIAA Journal 57(12), 5104–5113.
Platzer, M. F., M. A. Ashraf, J. Young, and J. C. Lai (2009). Development of a new oscillating-wing wind and hydropower generator. In 47th AIAA Aerospace Sciences Meeting including the New Horizons Forum and Aerospace Exposition.
Pourmahdavi, M., M. N. Safari, and S. Derakhshan (2019, mar). Numerical investigation of the power extraction mechanism of flapping foil tidal energy harvesting devices. Energy & Environment 30(2), 193–211.
Simpson, B.J., S. L. F. H. and M. Triantafyllou (2008). Energy extraction through flapping foils. In ASME, 27th International Conference on Offshore Mechanics and Arctic Engineering.
StarCCM+. Star ccm+ user guide. url http://www.cd-adapco.com/products/star-ccm. Sun, X., L. Zhang, D. Huang, and
Z. Zheng (2018, feb). New insights into aerodynamic characteristics of oscillating wings and performance as wind power generator. International Journal of Energy Research 42(2), 776–789.
Teng, L., J. Deng, D. Pan, and X. Shao (2016). Effects of non-sinusoidal pitching motion on energy extraction performance
of a semi-active flapping foil. Renewable Energy 85(Supplement C), 810 – 818. Wang, B., B. Zhu, and W. Zhang (2019, dec).
New type of motion trajectory for increasing the power extraction efficiency of flapping wing devices. Energy 189, 116072.
Wang, Y., D. Huang, W. Han, C. YangOu, and Z. Zheng (2017). Research on the mechanism of power extraction performance for flapping hydrofoils. Ocean Engineering 129, 626 – 636.
Wu, X., X. Zhang, X. Tian, X. Li, and W. Lu (2020, jan). A review on fluid dynamics of flapping foils.
Xiao, Q., W. Liao, S. Yang, and Y. Peng (2012). How motion trajectory affects energy extraction performance of a biomimic energy generator with an oscillating foil? Renew. Energy 37(1), 61 – 75.
Xiao, Q. and Q. Zhu (2014). A review on flow energy harvesters based on flapping foils. Journal of Fluids and Structures 46, 174 – 191.
Zhu, B., P. Xia, Y. Huang, and W. Zhang (2019, mar). Energy extraction properties of a flapping wing with an arc-deformable airfoil. Journal of Renewable and Sustainable Energy 11(2), 023302.
Zhu, Q. (2011). Optimal frequency for flow energy harvesting of a flapping foil. Journal of Fluid Mechanics.