Publisher’s version / Version de l'éditeur:
Vous avez des questions? Nous pouvons vous aider. Pour communiquer directement avec un auteur, consultez la première page de la revue dans laquelle son article a été publié afin de trouver ses coordonnées. Si vous n’arrivez pas à les repérer, communiquez avec nous à PublicationsArchive-ArchivesPublications@nrc-cnrc.gc.ca.
Questions? Contact the NRC Publications Archive team at
PublicationsArchive-ArchivesPublications@nrc-cnrc.gc.ca. If you wish to email the authors directly, please see the first page of the publication for their contact information.
https://publications-cnrc.canada.ca/fra/droits
L’accès à ce site Web et l’utilisation de son contenu sont assujettis aux conditions présentées dans le site
LISEZ CES CONDITIONS ATTENTIVEMENT AVANT D’UTILISER CE SITE WEB.
Building Research Note, 1986-03
READ THESE TERMS AND CONDITIONS CAREFULLY BEFORE USING THIS WEBSITE.
https://nrc-publications.canada.ca/eng/copyright
NRC Publications Archive Record / Notice des Archives des publications du CNRC : https://nrc-publications.canada.ca/eng/view/object/?id=a3f4483e-1bf5-4389-8ec2-de35c83df8f2 https://publications-cnrc.canada.ca/fra/voir/objet/?id=a3f4483e-1bf5-4389-8ec2-de35c83df8f2
NRC Publications Archive
Archives des publications du CNRC
This publication could be one of several versions: author’s original, accepted manuscript or the publisher’s version. / La version de cette publication peut être l’une des suivantes : la version prépublication de l’auteur, la version acceptée du manuscrit ou la version de l’éditeur.
For the publisher’s version, please access the DOI link below./ Pour consulter la version de l’éditeur, utilisez le lien DOI ci-dessous.
https://doi.org/10.4224/40000475
Access and use of this website and the material on it are subject to the Terms and Conditions set forth at
Gamma-spectroscopic determination of moisture distribution in
medium-density glass fibre insulation
Ser
THl National Research Conseil national
Sg2
19
Council Canada de recherches Canadan n , 242
c n 2 Institute for Institut de
BTD5 Research in recherche en
Construction construction
Building Research Note
Gamma-Spectroscopic Determination
of
Moisture Distribution in Medium-Density
Glass Fibre Insulation
by M.K. Kcrmaran BRN 242
GAMMA-SPECTROSCOPIC DETERMINATION OF MOISTURE
DISTRIBUTION IN MEDIUM-DENSITY GLASS FIBRE INSULATION
by
M.K.
KumaranBuilding Services Section
Institute for Research in Construction
B R N 242
ISSN 0701-5232
Ot,tawa, 34arch 1986
@Nat,ional Research Council Canada 1986
TABLE
OF CONTENTS ABSTRACT/RESUPIIE. . .
HNTRODUCTIOK
. . .
THE
ITERATIVE METHODEXPERIMENTAL
METHODS DISCUSSION. . .
COKCLUSION. . .
REFEREXCES. . .
. . .
3 AND RESULTS. . .
3ABSTRACT
This report examines the application of a gamma-spectroscopic method to determine mois- ture distribution in porous materials. A single radioactive source can be used to determine the moisture distribution in porous bodies with rigid solid structure. An experimental method has been developed for this purpose and measurements on four different speci- mens of glass fibre thermal insulation are reported. The experimental method can give reliable data on moisture distribution in these porous bodies, as a function of position
Ce rapport traite de 1-utilisation d'une mdthode de spectroscopie gamma servant A dkterminer la distribution de l'humidite' dans les matdriaux poreux. On peut employer une source radioactive unique pour dkterminer la &partition de l'humidite' dans les corps poreux posskdant une structure solide rigide. Une mkthode exphimentale a 6tk mise au point A cette fin; ce document fait &at des mesures effectu6es sur quatre sp6cimens diff4rents d'isolant thermique en fibre de verre. La m4thode expkrimentale en question permet d'obtenir des donnkes fiables concernant la distribution de l'humidite' dans ces corps poreux en fonction de la position et du temps.
INTRODUCTION
The NRC gamma,-spectrornet,er [ I ] has a dual beam source provided by americium and cesium compounds. Tlle dual beam can be used for simultaneous determination of the density of a solid matrix and the moisture content of wet porous materials. Soil physi- cists have been using this technique [2-51 particularly for soil columrls that tend t o expand on absorption of water and shrink on desorption or drying. If the solid matrix remains unchanged during absorption or desorption of rnoisture, it is possible to determine the mois- ture content a t any given point in the matrix by using a single beam gamma-spectrometer. Hence the distribution of moisture in such materials can be determined using only one of the spectrometer sources [ I ] .
This paper reports investigations done on wet specimens of medium density glass fibre insulation, under isothermal drying conditions; only the americium source wa.s used for this purpose. These investigations are intended t,o evaluate the precision of the exper- imental met.hod reported in Reference 1. It is also expected that moisture distribution in wet specimens can be determined as a function of position a t a. given instant, and as a function of time a t any given position, by this method. If this approach is successful, the moisture transport characteristics of porous insulation materials will be available as reliable experimental quantities.
In principle, the apparent density
(P)
of water (and hence the volumetric moisture content) a t a selected position in a wet insulation with rigid solid matrix can be calculated from the attenuation equationwhere lo and I are, respectively, the intensities of the gamma ray transmitted through the dry and wet insulation of thickness (d), and a is the mass attenuation coefficient for water, characteristic of the selected energy of gamma radiation. It was shown earlier [ l ] that for the NRC spectrometer, a determined a t the peak energy of americium photons depends linearly on path length." So, instead of treat,ing a as a constant for water, its dependency
"
Various research workers have reported that when two radioactive sources are used simul- taneously, the intensity of the weaker source will be influenced by the stronger source. So it was initially thought that the dependence of a for Am on the path length was due to the secondary photons from Cs. Empirically, a linear relationship between o and d was determined. However, it has now been established that the IVRC spectrometer has a char- acteristic background radiatio~i consisting of photons comparable to Am photons and that the intensitiesI
and I n , corrected for this background radiation, result in a value for a thatis i~idependent of t l i ~ pat11 length. Tliis being the case, the iterative method of calculation, though empirically valid, is unnecessary. Ho~vever, before this was established, the work presented in this report was substa~ltially complet,e and no systematic measurements were
2
on the path length has to be appropriately incorporated in the calculations. An iterative method was developed for this purpose [I]. This same method, which is summarized below, was used for the present investigation.
THE ITERATIVE METHOD
Gamma-ray attenuation measurements for six different values of distance d', ranging be- tween 2 and 10 cm, through which the radiation passed in liquid water, gave the empirical relation,
where A = 0.203 crn2 g-' and
B
= -0.0018 c m . g - l . The a.bove relation is used to calculate the value of a to be used in equation (1) in the iterative calculation procedure as follows. In the first stage of the calcula.tion, the value for a is assu~ned to be 0.203 cm2.g-', the extrapolated value a t zero path length. Equaticn ( I ) is then used to calculate an approximate value for p that corresponds to the experimentally determined value for the ratio(Illo).
This approximate value for p is used to calculate an approximate value for dl, t o be substituted in equation (2), from the relationa.pparent density of water
d = - x d
real density of liquid water
where d is the thickness of moist material. The physical meaning of the above rela.tion is that the attenuation produced by a column of water of length d with apparent density p
is equivalent to tha.t produced by a column of length dl of normal liquid water.
In the iterative stage of the calculation, the mass attenuation coefficient to be used in equation ( I ) is calculated from equation (2) for the approximate value of dl and the whole series of calculations is repeated until convergence is achieved with respect to apparent density ( p ) of water.
EXPERIMENTAL METHODS AND RESULTS
The average density of the rigid glass fibre boards used for the present investigations is 48 kg/m3. The boards were dried in an oven for 48 h a t 323 K and two different s p e c i m e ~ ~ s used for the experiments were prepared as follows.
carried out on the background radiat.ion. So all t,he results were analyzed in terms of the iterative mct,hod. In future irlvestigations this will be avoided.
Specimen
I
A rectangular block of dimensions 9.87 x 9.78x
20 cm was enclosed in a tight fitting plexiglass box in such a way that both the 9.87x
9.78 cm faces of the block were open to the environment.Specimen I1 A rectangular block of dimensions 9.87 x 9.78
x
10 cm was enclosed in a tight fitting plexiglass box as in the case of specimen I. This specimen was meant for the investigation of rapid drying of an unsaturated specimen, for preliminary studies showed that shorter specimens dry faster.For specimen
I,
one of the faces open to the environment was arbitrarily chosen as the base of the block. The edges of the plexiglass a t the base were coated with a thin 1a.yer of silicone grease and the specimen was allowed to stand upright on a plexiglass slab that was eventually used to seal t,he base of the wet insulatiorl from air. The mass of this combination (plexiglass box+
dry fibre glass block+
plexiglass slab) was 755.7 g. The plexiglass slab was then removed and water was forced through the base of the specimen by immersing it upright, gradually and completely in a pail of distilled water. The specimen was kept i ~ n ~ n e r s e d for 5 h. It was then lifted out of water and was placed on a. mesh that covered the pail arid was allowed to drain for approximately 15 h. The .base was then sealed by sliding the plexiglass slab against the edges coa.ted with grease and the wet specimen was reweighed. The mass recorded was 1717.2 g. This wet specimen was then left for approximately 48 h in the room where the gamma-spectrometer is situated; the room is maintained a t (294.0 i 0.5)K
and a t a relative humidity of (45f
5)%. During the course of this investigation, the specimen remained in this isothermal condition. The path length chosen for both the specimens was that normal to the layers of the fibers and was equal to 9.87 cm. Prior to wetting, the specimen was scanned in the spectrometer with the Am beam, with reference to the air of the room a t several positions [I] and the ratiocount rate for the dry specimen
= 0.7814 count rate for air of the room
was established for the specimen once and for all. This precaution was taken to correct for any unexpected change in the intensity of the source during the investigation, which was planned t o last for five to six months.
Several scans were made on the wet specimen a t various stages of drying. The specimen was placed on an a.utomatic ba.lance and the total mass was recorded during each series of scans. The entire specimen was scanned either as 40 horizontal layers of 0.5 cm thickness or as 80 layers of 0.25 cm thickness. Each layer was scanned at three to five positions to arrive at an average count of photons. This wa.s achieved by defining the space ma.trix for the movement of the towers tha.t carry the source and tletect.or as reported ea.rlier 111. The "live time" of the measurement at, each point on the space matrix was fixed a t 20 s. The total durat,ion for one set of scans varied between 1; and 3; h. During each set of scans,
the amount of water lost by evaporation was less than 0.08% of the total moisture content and was treated as negligible. Thus each test (i.e., set of scans) was essentially regarded as a static test on the specimen. During each test a set of corresponding measurements wa.s also done on air above the specimen to make corrections, if any, on the count ra,te for the dry specim.en. Every reading from the analyzer was also corrected for the dead time of the equipment; the most recent experi~nental value for the dead time as determined by the method suggested by Groenevelt 161 is 3 yslcount.
AVERAGE MOISTURE CONTENT, 9 - ~ r n - ~ AVERAGE MOISTURE CONTENT, g
-
Figure 1. Changes in moisture distribu- Figure 2. Results from test MDGF535 on tion during the drying of Specimen I; exper- Specimen
I;
average moisture contents in irnental values for average moisture content 80 s~iccessive layers determined experimen- in forty s~iccessive layers a t three stages tally. Sections AB, BC, and CD represent of drying. Results from tests MDGF507, three different regions in the moisture dis- MDGF528 and MDGF542. tribution pattern (see text).Over 40 tests were done on s ~ e c i m e n I. However. in view of the discussion t8hat follows,
1'1
results from only four tests, coded respectively ~ S ' M D G F S O ~ . MDGF528, MDGF535 andI
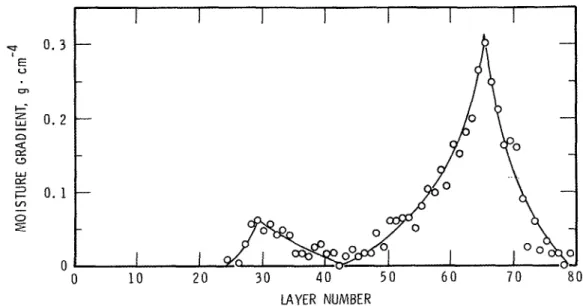
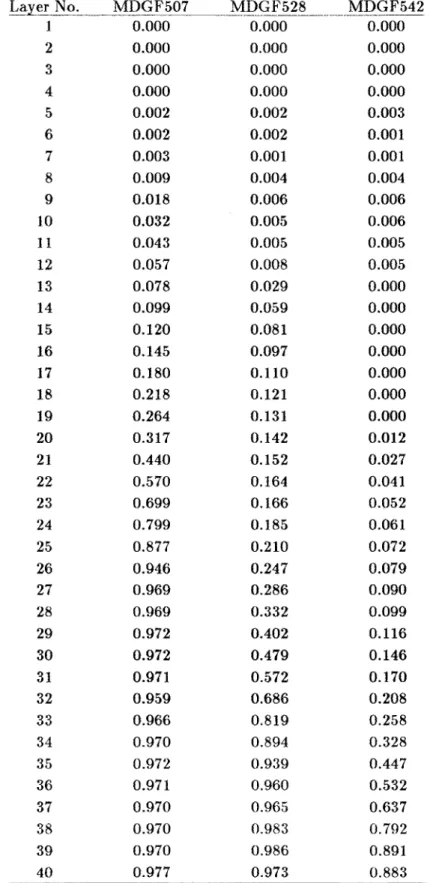
MDGF542, are reported here. The average moisture content in each of the 40 succes-sive layers of the specimen a t three different stcages of drying calculated from the tests MDGF507, MDGF528, and MDGF542, is listed in Table 1 and plotted in Figure 1. The results from test MDGF535, which gives average moisture content in 80 successive layers, are listed in Table 2 and plotted in Figure 2. The distribution of the moisture gradient calculated from the result,s of this latter test is shown in Figure 3.
"
0 10 2 0 3 0 5 0 6 0 7 0 8 0
LAYER NUMBER
Figure
-
3. Distribution of moisture gradient in Specimen-
I;
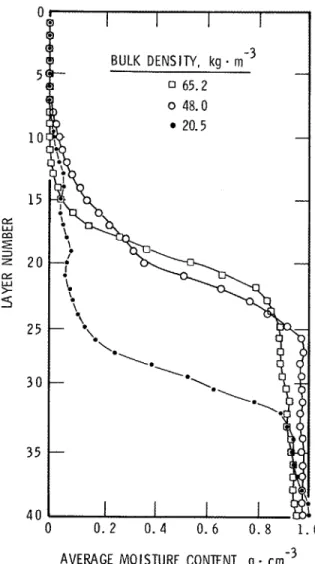
values calculated directly from the results of test MDGF535.For the sake of comparison, initial moisture distributions (i.e., after 48 h of equilibration in the room condition) in two saturated specimens with dimensions identical to specimen
I,
prepared from two other samples of glass fibre insulation with average densities 20.5 kg/m3 and 65.2 kg/m3, were also determined by the same method. This comparison is given in Figure 4.
i
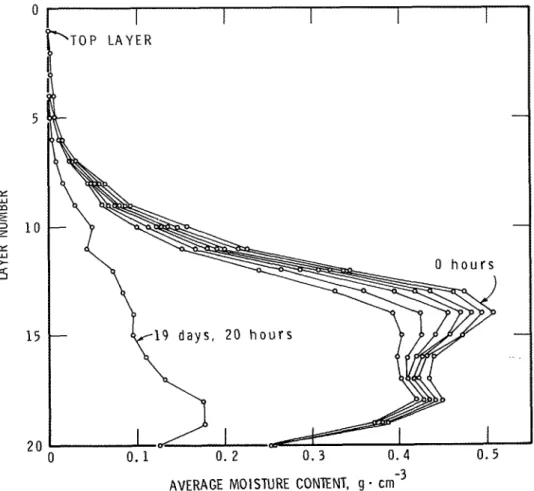
An unsaturated specimen with the moisture distributed randomly was prepared by inject- ing about 200 cm3 of distilled water in a random way into specimen I1 a t various locations. The base was then sealed with a plexiglass slab as in the case of specimen I. For the pur- pose of scanning, this specimen was arbitrarily divided into 20 layers of 0.5 cm thickness and, as for specimen I, each 1a.yer was scanned a t t,hree positions to arrive a t an average count, of photons. This specimen dried at. a much higher rate than specimen I. Moistlure distributions a t eight different stages of drying are summarized in Ta.ble 3 and ylott,ed in
Table 1. Average moisture contents p, in forty successive layers of specimen I a t various stages of drying; layer No. 1 is the top layer open to atmosphere. Test MDGF507 was done on 14 February 1985, 528 on 9 April 1985 and 542 on 31 July 1985
p n / g . cmP3 Layer No. MDGF507 -. MDGF528 - -. - - ..- - MDGF542 1 0.000 0.000 0.000 2 0.000 0.000 0.000 3 0.000 0.000 0.000 4 0.000 0.000 0.000 5 0.002 0.002 0.003 6 0.002 0.002 0.001 7 0.003 0.001 0.001 8 0.009 0.004 0.004 9 0.018 0.006 0.006 10 0.032 0.005 0.006
Table 2. Average moisture contents p , in eighty successive layers of specimen I derived from test MDGF535; layer No. 1 is the top layer
Layer No. 1 2 3 4 5 6 7 8 9 10 11 12 13 14 15 16 17 18 19 20 2 1 2 2 2 3 24 2 5 26 2 7 2 6 29 30 31 32 3 3 34 3 5 3 6 3 7 3 8 39 40 "ayer No. 4 1 42 43 44 45 46 47 4 8 49 50 5 1 5 2 53 54 55 56 57 5 8 59 60 61 62 63 64 65 66 67 68 69 70 7 1 7 2 73 7 4 7 5 7 6 77 7 8 79 80
Figure 4. Initial moisture distribution in three different saturated specimens of glass fibre insulation.
DISCUSSION
The process of drying undergone by the systems under investigation is due to evaporation and vapour diffusion. However various forces collectively determine the pattern of mois- ture distribution in these systems. These forces are gravity, intermolecular, capillary and interfacial forces, and forces of adsorption. The moisture profile in Figure 2 is a typical @tern of total moisture distribution in sy ecimen I. Three distinctly different regions can be seen. The region A-B upwards fro111 t,he ba.se has all voids completely filled by liq- uid water. The average moisture content here is 97 to 98% of the total volume, which is same as the porosity of the insulation. But in the region B-C, the total moisture content gradually decreases with height. This is t,he region where vapour and liquid coexist. The equilibrium vapour pressure in successive layers of voids continuously decreases, probably as a result of a continuous reduction of surl'a.ce area undergone by the liquid; as the total
Table 3. Moisture distribution in specimen I1 a t eight different stages of drying Average moisture content (g/cm3)
Layer No. O h 12 h 24 h 36 h 48 h 60 h 72 h 19 d, 20 h
moisture content decreases, the amount of liquid water has to decrease in relation to the amount of water vapour. Situations similar to this ha.ve previously been recognized in soils [7]. The region C-D may be identified as voids in which water vapour is in equilib- rium with adsorbed layers of water on the fibres. Here also the equilibrium vapour pressure continuously decreases with the total moisture content a.s a result of the partition of the total available moisture between two phases. This continues until the equilibrium vapour pressure approaches the partial pressure of water vapour in the surroundings. This, of course, is only a qualitative picture of the phenomenon. For a quantitative analysis one would have to know in more detail about the interfacial t,ension of water and fibre, and the effect of the binder on the adsorption characteristics.
From gravimetric measurements, specimen
I
initially held about 1 kg of water even when allowed to drain freely. This shows the extent of capillary forces operating in the system. Figure 4 shows that the amount. of water so held by glass fibre insulation decreases with bulk densit.y but the pat,t,erns of total moisture di~tribut~ion are identical.As indicated ea.rlier, the principal aim of tliese investiga.tions was t o est.imate the precision attainable by the iterative method used for data analysis [I!. The total moisture content having been determined gravimetrically, the accura,cy with which the total moisture content, is spectroscopically determined can be directly calculated. Each layer is scanned a t three,
Figure 5. Moisture distribution in twenty successive layers of specimen I1 a t various stages of drying; experimental values from eight different tests.
four or five a.djac,ent positions and these measurements give an average value of total moisture in each layer. Let this value be p , . Then the total moisture content (W) is given by
where k is the total number of layers and V is the volume of each layer. Thus the test MDGF507 gives the total moist,ure content. as 941.0 g and the corresponding moisture content determined gravimetrically is 935.8 g. The a g r e e ~ ~ i e n t is within 0.6%. For this test each layer was scanned only a.t three horizont,al positions and this did not fully cover the width of the layer. In the test MDGF528 four blocks were scanned for each layer and the space matrix was carefully chosen to cover the widt,h of e x h layer as well as possible. The tota.1 moisture content so determined was 588.7 g, which differs by less than 0.4% from the
and the agreement between the t,wo values wa.s always remarkably good. Evidently, with proper choice of the space matrix for the scanning, the total moisture content can be determined quantita.tively by the ga,mma-spect,roscopic method.
Specimen 11, as expected, dried at a rnuch fa.st,er rate. Initial moisture profile in speci- men I showed that, vapour and liquid probably coexist,ed in the voids through a height of approximately 10 cm. Thus if the total height of the specimen is much larger than 10 cm, the evaporation rate will be low. This was why the height of specimen I1 was chosen to be 10 cm. As indicated earlier, water was distributed quite randomly in the specimen and this ra.ndorn distribution is clearly shown in Figure 4. It is interesting to see that the moisture di~t~riblition curve was only gradually "shrinking" as a result of drying and that there was no evidence of re-distribution of liquid water due to gravity during the process. This again shows the relative strength of the capillary forces operating in the system. The data represented by Figure 3 are particularly important for the calculation of the moisture diffusivity coefficient,. One of t,he va.riables plotted is a derivative, namely the moisture gradient, directly calculated from the experimental data. The precision attained in test MDGF535 was sufficient t,o indicate clearly the moisture gradient in the, specimen; the two peaks correspond to the two points of inflexion in the two regions, C-D and B-C in Figure 2. Thus it appears that this experimental method can be used to determine moisture gradients in porous media. This will be one important application of this experimental technique towards the determination of the moisture transport characteristics of porous media. From Figure 5 it is evident that the method can also be used to follow the change in moisture content at any given location in a porous medium as a function of time. CONCLUSION
A gamma spectrometer with only an Am source can be used to determine the distribution of moisture in porous materials with rigid solid structure. The results can be used to calculate moisture transport characteristics of these materials because the moisture distribution can be determined as a function of position and time.
The experimental method described here was applied only for isothermal drying. There is no reason why this cannot be extended to processes under non-isothermal conditions. Such extensions would give moisture distribution data as a function of temperature, p ~ s i t i o n and time. These data in turn can be used to calculate various transport characteristics that are necessary to describe si~nultarleous heat and moisture transport through the particular porous medium investigated. The research activities to achieve this should be direct,ed towards
1 identification of the various transport cha.racteristic.s that can be calculated from the moisture distribution data,
2 development of appropriate mathematical methods to calculate the transport char- acteristics and
3 development of experimental methods to determine moisture distribution as a func- tion of temperature, position and time.
REFERENCES
1. Kumaran,
M
.K. and Bomberg, M. A Gamma-Spectrometer for Determination of Den- sity Distribution and Moisture Distribution in Building Materials. Proceedings of the International Symposium on Moisture and Humidity, Washington, D.C. p. 485, 1985. 2. Corey, J.C., Peterson, S.F. and Wakat, M.A. Measurement of 137Cs and 241AmGamma Rays for Soil Density and 17\'at,er Content Determinations. Soil. Sci. Soc. Am. Proceedings. 35, 215, 1971.
3. Gradner, W .H., Campbell, G.S. and Calissendorff, C. Systematic and Random Errors in Dual Gamma Energy Soil Bulk Density and Water Content Measurements. Soil. Sci. Soc. Am. Proceedings. 36, 393, 1972.
4. Stroosnijder, L. and DeSwart, J.G. Column Scanning with Simultaneous use of 241Am and '"Cs Gamma. R.adia.tio11. Soil Science. 118(2), 61, 1974.
5. Goit, J.B. Development of a Dual Energy Gamma System to Study Soil Freezing. M.Sc. Thesis, University of Guelph, Guelph, Ontario 1976.
6. Groenevelt,
P.H.
The Use of a Dual Gamma. Scanner t o Observe the Shrinkage of Clay. Geoderma, 11, 287, 1974.7. Edlefsen, N.E. and Anderson, A.B.C. Thermodynamics of Soil Moisture. Hilgardia,